
 buy artwork
Pi Day 2022 — three one four: a number of notes — A musical journey into the digits of Pi


On March 14th celebrate `\pi` Day. Hug `\pi`—find a way to do it.
For those who favour `\tau=2\pi` will have to postpone celebrations until July 26th. That's what you get for thinking that `\pi` is wrong. I sympathize with this position and have `\tau` day art too!
If you're not into details, you may opt to party on July 22nd, which is `\pi` approximation day (`\pi` ≈ 22/7). It's 20% more accurate that the official `\pi` day!
Finally, if you believe that `\pi = 3`, you should read why `\pi` is not equal to 3.

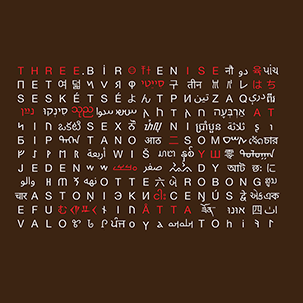
3 There you go
1 Straight
4 Number me not
1 Scales
5 There is more of me
9 To forget than you can remember
—Emma Beauxis-Aussalet (314... piku)
Welcome to 2022 Pi Day: a celebration of `\pi` and mathematics (and music).
Buy the Album
The "three one four: a number of notes" album is available on Bandcamp, Spotify and Tidal.


Numberphile Podcast
Greg and I discuss the album on the Numberphile podcast.
Download the score
The album is fully scored for solo piano.
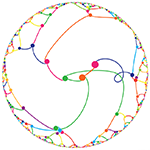
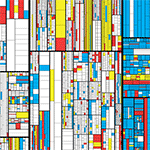
Artwork
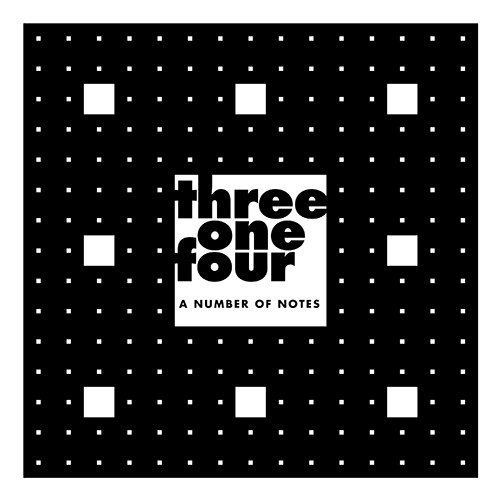
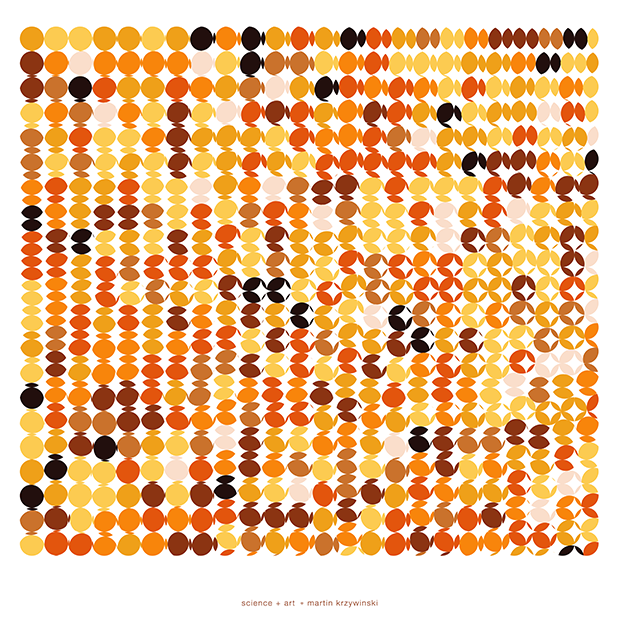
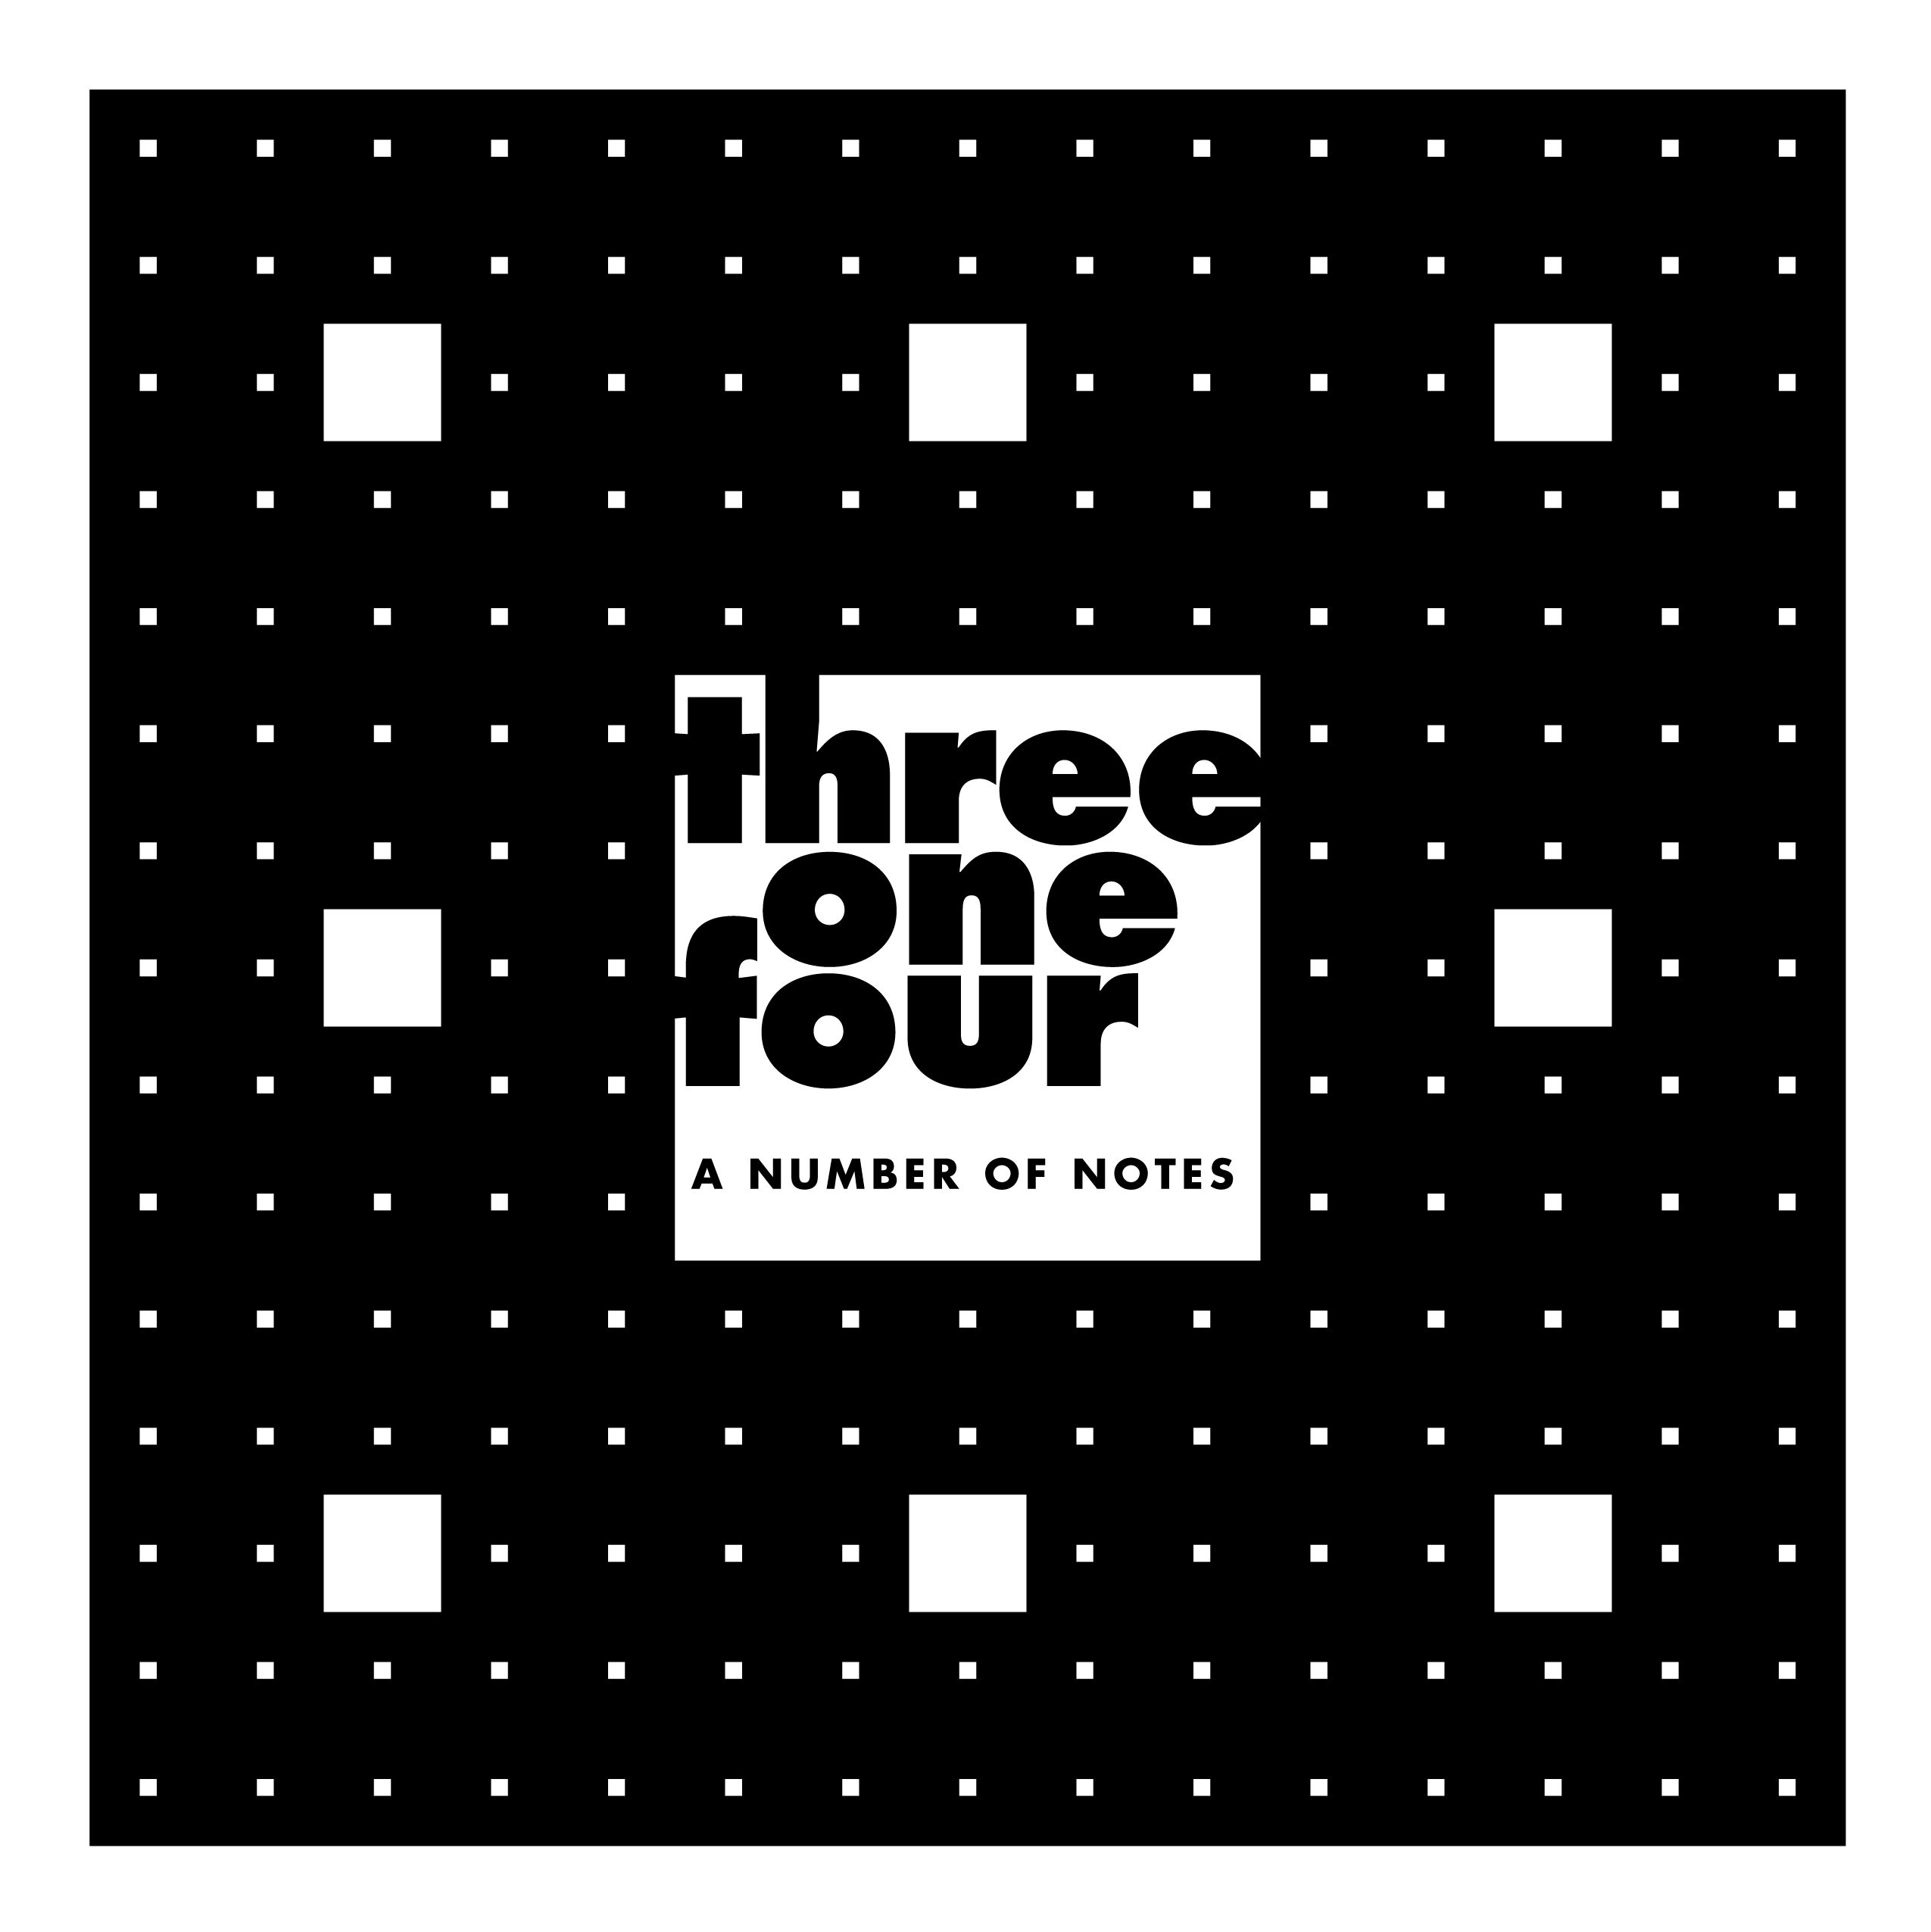
The artwork for the album is the Wallis Sieve. It is a fractal whose area is `\pi/4`.
The sieve is generated by starting with a black square and dividing it into a grid of 3 × 3 squares and removing the middle square. On the second iteration, each of the squares is further divided into a grid of 5 × 5 squares, and the middle in each grid is removed. As this process continues (at iteration `n` we divide each square into `(2n+1)^2` smaller squares and remove the middle one), the black area (what remains after the middle squares are removed) approaches `\pi/4`.
The Wallis Sieve is said to "round the square" because by removing progressively smaller squares, we've rounded the big square into a quarter circle.
You can download a very high resolution level 5 Wallis Sieve. For normal viewing, the first three levels are visible and the fourth appears as dots. The fifth level is essentially invisible and, unless you're looking to zoom in interactively, there's little point in dividing futher.
Musical Influences
The album is inspired by 20th century classical music. Each track is a tribute to an influential composer from the era.
The methods section has detailed notes from Greg, the composer.
track 1 — 314... : the mid-century multiple serialists
Pierre Boulez (Piano Sonatas No. 1 and No. 2)
Karlheinz Stockhausen (Klavierstücke I-XVII)
Gyorgy Ligeti (Musica Ricercata 1–11)
Steve Reich (Piano phase score and visualization | Clapping Music Electric Counterpoint)
Phillip Glass (Mad Rush, String Quartet No. 3)
Erik Satie (Gnossienne No. 3, 3 Gymnopedies and 6 Gnossiennes)
Morton Feldman (Piano Pieces | Triadic Memories for the Piano | Intermissions for Piano)
Wynton Kelly (On Green Dolphin St. | Autumn Leaves | If I Should Lose You)
Bud Powell (Wail)
Thelonious Monk (Underground)
track 2 — Feynman Point
track 3 — Wallis Product
track 4 — nn
track 5 — null
track 6 — ...264 : Bebop jazz
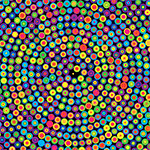
Beyond Belief Campaign BRCA Art
Fuelled by philanthropy, findings into the workings of BRCA1 and BRCA2 genes have led to groundbreaking research and lifesaving innovations to care for families facing cancer.
This set of 100 one-of-a-kind prints explore the structure of these genes. Each artwork is unique — if you put them all together, you get the full sequence of the BRCA1 and BRCA2 proteins.

Propensity score weighting
The needs of the many outweigh the needs of the few. —Mr. Spock (Star Trek II)
This month, we explore a related and powerful technique to address bias: propensity score weighting (PSW), which applies weights to each subject instead of matching (or discarding) them.

Kurz, C.F., Krzywinski, M. & Altman, N. (2025) Points of significance: Propensity score weighting. Nat. Methods 22:1–3.
Happy 2025 π Day—
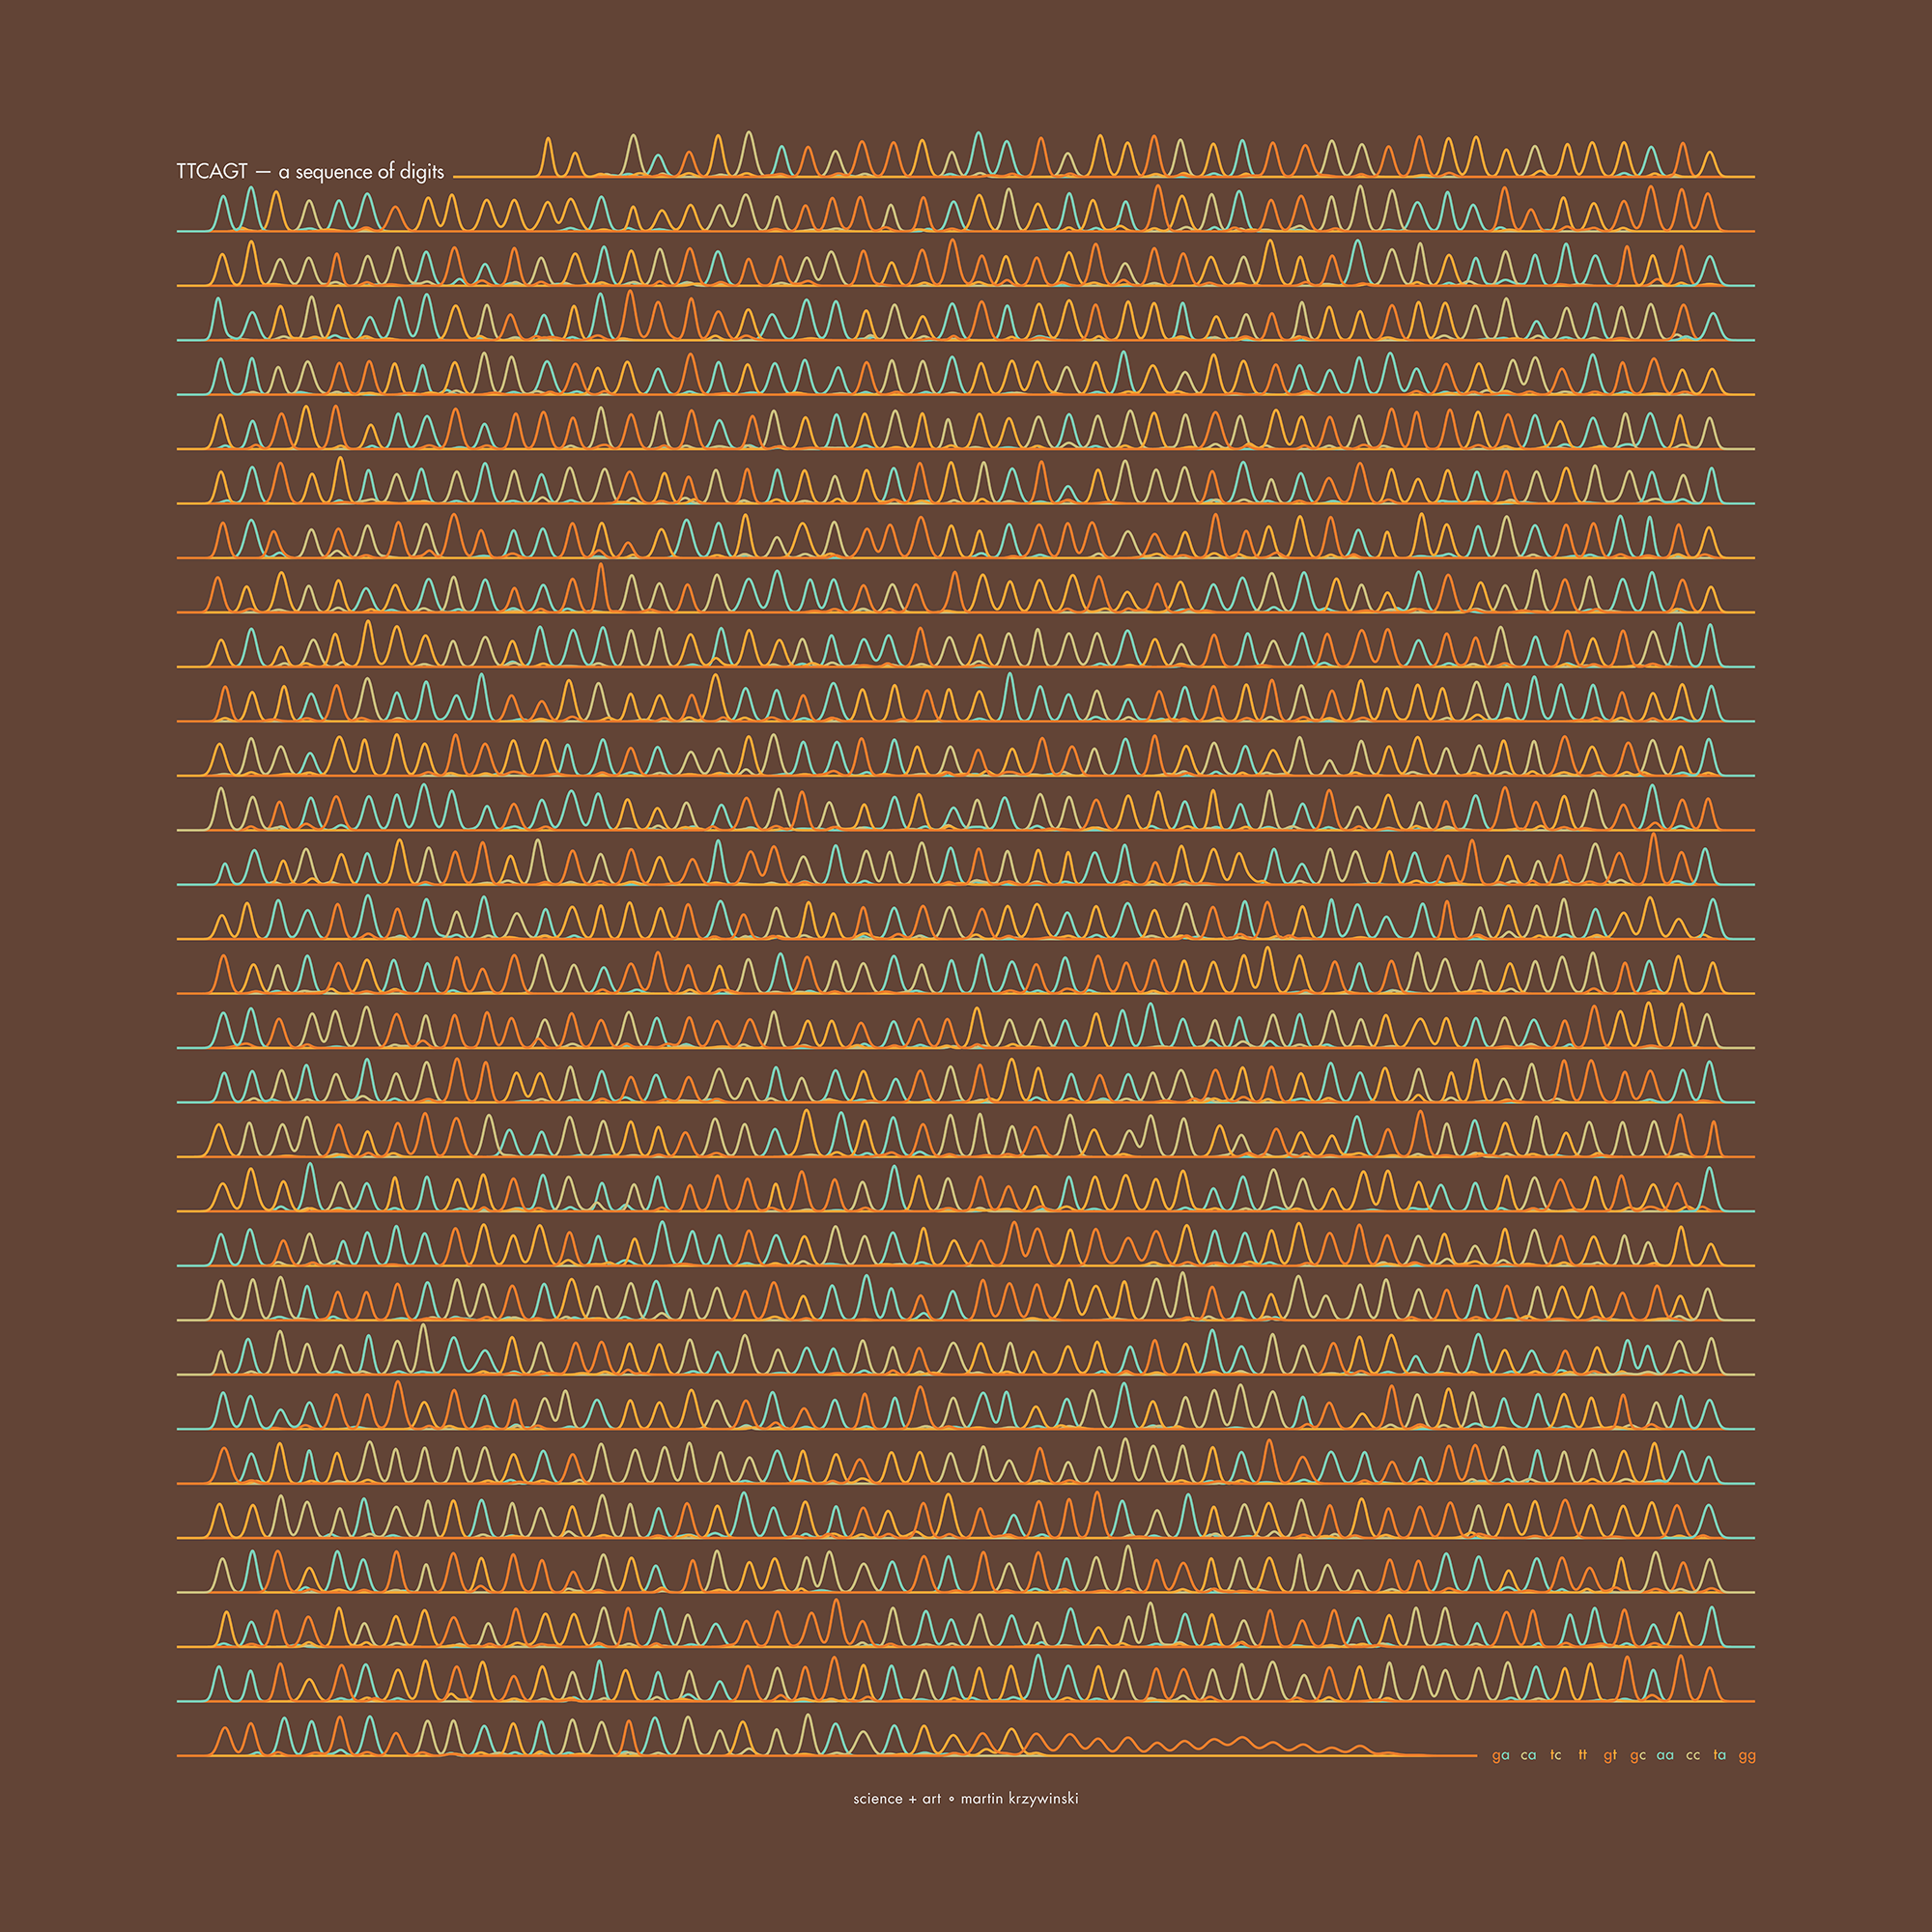
TTCAGT: a sequence of digits
Celebrate π Day (March 14th) and sequence digits like its 1999. Let's call some peaks.

Crafting 10 Years of Statistics Explanations: Points of Significance
I don’t have good luck in the match points. —Rafael Nadal, Spanish tennis player
Points of Significance is an ongoing series of short articles about statistics in Nature Methods that started in 2013. Its aim is to provide clear explanations of essential concepts in statistics for a nonspecialist audience. The articles favor heuristic explanations and make extensive use of simulated examples and graphical explanations, while maintaining mathematical rigor.
Topics range from basic, but often misunderstood, such as uncertainty and P-values, to relatively advanced, but often neglected, such as the error-in-variables problem and the curse of dimensionality. More recent articles have focused on timely topics such as modeling of epidemics, machine learning, and neural networks.
In this article, we discuss the evolution of topics and details behind some of the story arcs, our approach to crafting statistical explanations and narratives, and our use of figures and numerical simulations as props for building understanding.

Altman, N. & Krzywinski, M. (2025) Crafting 10 Years of Statistics Explanations: Points of Significance. Annual Review of Statistics and Its Application 12:69–87.
Propensity score matching
I don’t have good luck in the match points. —Rafael Nadal, Spanish tennis player
In many experimental designs, we need to keep in mind the possibility of confounding variables, which may give rise to bias in the estimate of the treatment effect.

If the control and experimental groups aren't matched (or, roughly, similar enough), this bias can arise.
Sometimes this can be dealt with by randomizing, which on average can balance this effect out. When randomization is not possible, propensity score matching is an excellent strategy to match control and experimental groups.
Kurz, C.F., Krzywinski, M. & Altman, N. (2024) Points of significance: Propensity score matching. Nat. Methods 21:1770–1772.
Understanding p-values and significance
P-values combined with estimates of effect size are used to assess the importance of experimental results. However, their interpretation can be invalidated by selection bias when testing multiple hypotheses, fitting multiple models or even informally selecting results that seem interesting after observing the data.
We offer an introduction to principled uses of p-values (targeted at the non-specialist) and identify questionable practices to be avoided.

Altman, N. & Krzywinski, M. (2024) Understanding p-values and significance. Laboratory Animals 58:443–446.