
 buy artwork
 buy artwork
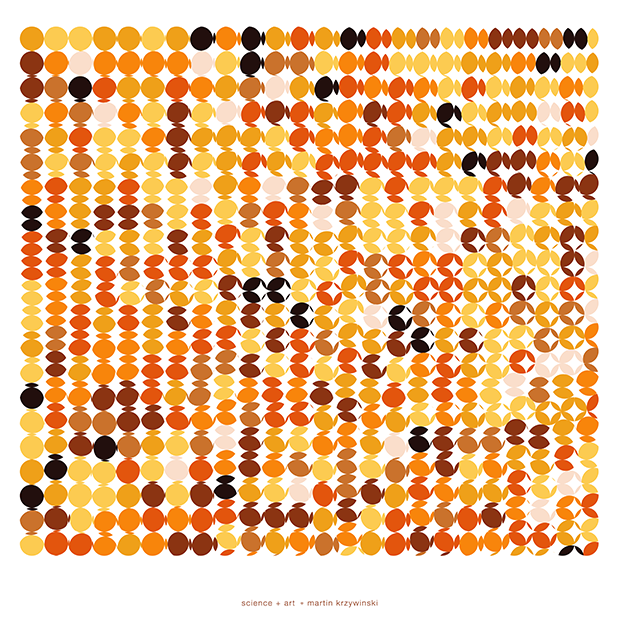
The art of Pi (`\pi`), Phi (`\phi`) and `e`


Numbers are a lot of fun. They can start conversations—the interesting number paradox is a party favourite: every number must be interesting because the first number that wasn't would be very interesting! Of course, in the wrong company they can just as easily end conversations.
The art here is my attempt at transforming famous numbers in mathematics into pretty visual forms, start some of these conversations and awaken emotions for mathematics—other than dislike and confusion

Numerology is bogus, but art based on numbers can be beautiful. Proclus got it right when he said (as quoted by M. Kline in Mathematical Thought from Ancient to Modern Times)
Wherever there is number, there is beauty.
—Proclus Diadochus
 buy artwork

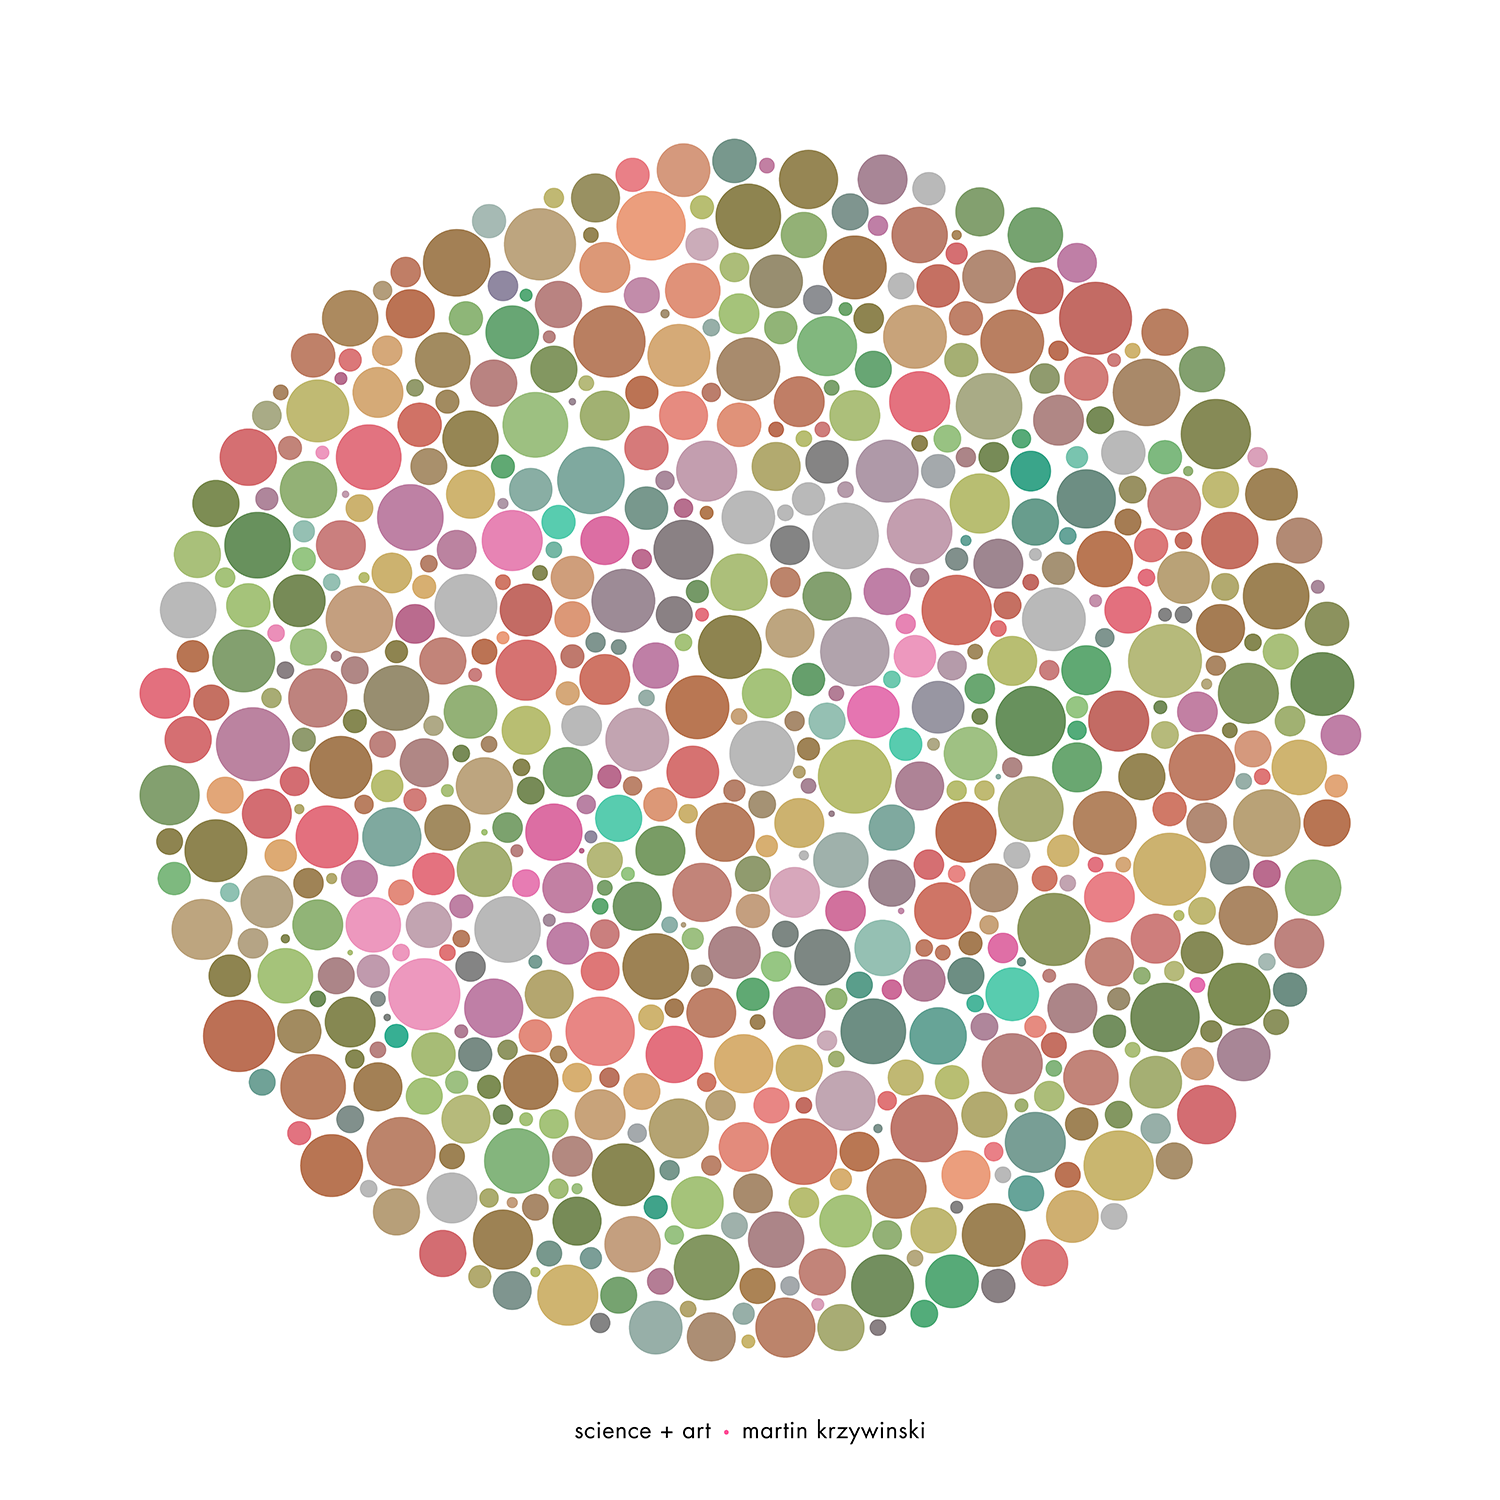
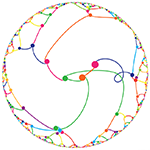
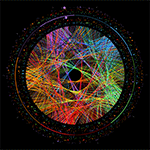
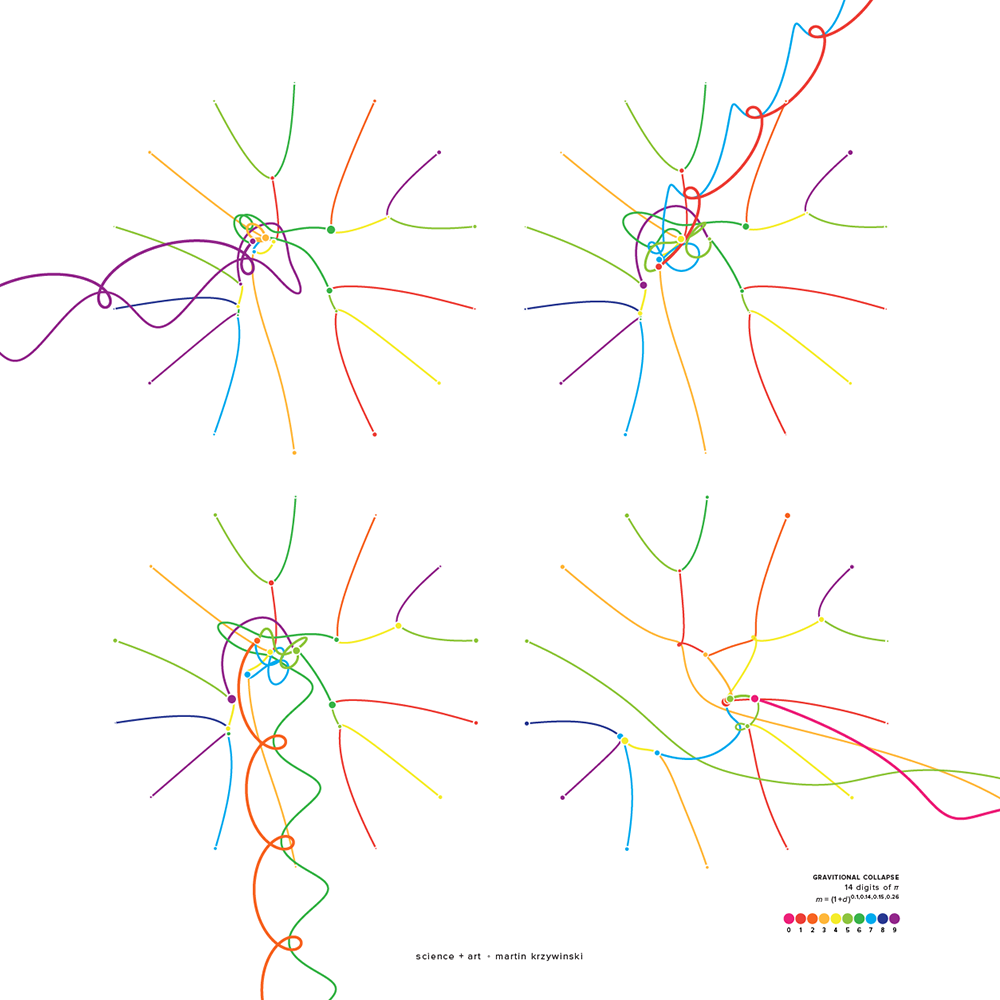
the numbers `\pi`, `\phi` and `e`
The consequence of the interesting number paradox is that all numbers are interesting. But some are more interesting than others—how Orwellian!
All animals are equal, but some animals are more equal than others.
—George Orwell (Animal Farm)
Numbers such as `\pi` (or `\tau` if you're a revolutionary), `\phi`, `e`, `i = \sqrt{-1}`, and `0` have captivated imagination. Chances are at least one of them appears in the next physics equation you come across.
`\pi`
`\phi`
`e`
= 3.14159 26535 89793 23846 26433 83279 50288 41971 69399 ...
= 1.61803 39887 49894 84820 45868 34365 63811 77203 09179 ...
= 2.71828 18284 59045 23536 02874 71352 66249 77572 47093 ...
Of these three transcendental numbers, `\pi` (3.14159265...) is the most well known. It is the ratio of a circle's circumference to its diameter (`d = \pi r`) and appears in the formula for the area of the circle (`a = \pi r^2`).
 buy artwork
The Golden Ratio (`\phi`, 1.61803398...) is the attractive proportion of values `a > b` that satisfy `{a+b}/2 = a/b`, which solves to `a/b = {1 + \sqrt{5}}/2`.
The last of the three numbers, `e` (2.71828182...) is Euler's number and also known as the base of the natural logarithm. It, too, can be defined geometrically—it is the unique real number, `e`, for which the function `f(x) = e^x` has a tangent of slope 1 at `x=0`. Like `\pi`, `e` appears throughout mathematics. For example, `e` is central in the expression for the normal distribution as well as the definition of entropy. And if you've ever heard of someone talking about log plots ... well, there's `e` again!
Two of these numbers can be seen together in mathematics' most beautiful equation, the Euler identity: `e^{i\pi} = -1`. The tau-oists would argue that this is even prettier: `e^{i\tau} = 1`.
accidentally similar
Did you notice how the 13th digit of all three numbers is the same (9)? This accidental similarity generates its own number—the Accidental Similarity Number (ASN).
Propensity score weighting
It is not certain that everything is uncertain. —Blaise Pascal
We have already explored how we can mitigate bias caused by confounding variables in observational studies using propensity score (PS) matching (PSM) and propensity score weighting (PSW). However, any statistical model is only as good as its assumptions and, if it is specified incorrectly, it can itself produce biased estimates of the treatment effect.

This month, we explore double robustness, a powerful statistical concept that provides a valuable “safety net” against the risk of an incorrect model. It offers two opportunities, instead of just one, to obtain a valid estimate of the treatment effect — making it possible to draw credible causal inferences from observational data without having to depend on a single set of modeling assumptions.
Kurz, C.F., Krzywinski, M. & Altman, N. (2026) Points of significance: Double Robustness. Nat. Methods 23:868–869.
Nature Biotechnology cover
My cover design on the 7 April 2026 Nature Biotechnology issue shows the dendrogram that represents a cluster of uniquely expressed (or downregulated) genes in human naive stem cells induced from such cells. Within each dendrogram block, the genomic barcode sequence (sampled from Supplementary Table 1) is depicted with a Code 39 barcode. The highlighted barcode is one of those used for cell isolation.
Ishiguro S. et al. A multi-kingdom genetic barcoding system for precise clone isolation (2026) Nature Biotechnology 44:616–629.

Browse my gallery of cover designs.

Happy 2026 π Day—
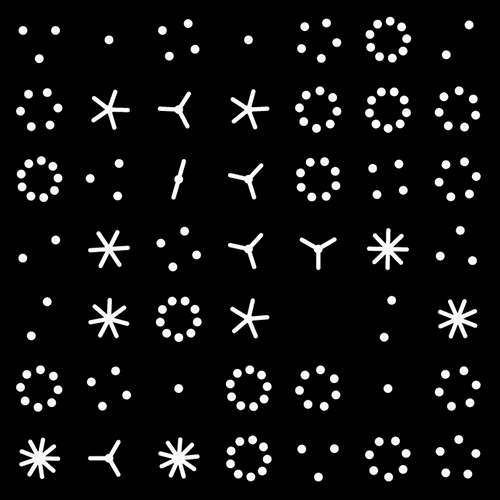
Art for the 5%
Celebrate π Day (March 14th) and enjoy the art — but only if you're part of the 5%.
Go ahead, see what you can't see.
Ishihara's Tests for Colour Deficiency
Authentic and accurate images of Ishihara's test plates photographed (and lovingly color-corrected) from the 38-plate Ishihara's Tests for Colour Deficiency.
I also provide the position, size, and color of each circle on each test plate.


Symmetric alternatives to the ordinary least squares regression
What immortal hand or eye, could frame thy fearful symmetry? — William Blake, "The Tyger"
This month, we look at symmetric regression, which, unlike simple linear regression, it is reversible — remaining unaltered when the variables are swapped.
Simple linear regression can summarize the linear relationship between two variables `X` and `Y` — for example, when `Y` is considered the response (dependent) and `X` the predictor (independent) variable.
However, there are times when we are not interested (or able) to distinguish between dependent and independent variables — either because they have the same importance or the same role. This is where symmetric regression can help.

Luca Greco, George Luta, Martin Krzywinski & Naomi Altman (2025) Points of significance: Symmetric alternatives to the ordinary least squares regression. Nat. Methods 22:1610–1612.
Beyond Belief Campaign BRCA Art
Fuelled by philanthropy, findings into the workings of BRCA1 and BRCA2 genes have led to groundbreaking research and lifesaving innovations to care for families facing cancer.
This set of 100 one-of-a-kind prints explore the structure of these genes. Each artwork is unique — if you put them all together, you get the full sequence of the BRCA1 and BRCA2 proteins.
