 buy artwork
The art of Pi (`\pi`), Phi (`\phi`) and `e`


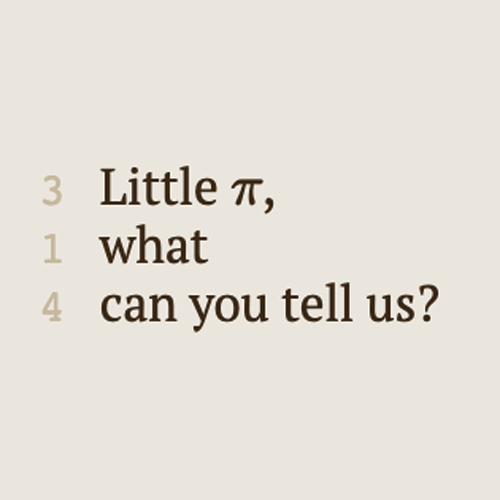


Numbers are a lot of fun. They can start conversations—the interesting number paradox is a party favourite: every number must be interesting because the first number that wasn't would be very interesting! Of course, in the wrong company they can just as easily end conversations.
is π normal?
It is not yet known whether the digits of π are normal—determining this is an important problem in mathematics. In other words, is the distribution of digit frequencies in π uniform? Do each of the digits 0–9 appear exactly 1/10th of the time, does every two-digit string appear exactly 1/100th of the time and so on for every finite-length string1?
1 One interesting finite-length string is the 6-digit Fenyman Point (...999999...) which appears at digit 762 in π. The Feynman Point was the subject of 2014 `\pi` Day art.
This question can be posed for different representations of π—in different bases. The distribution frequencies of 1/10, 1/100, and so on above refer to the representation of π in base 10. This is the way we're used to seeing numbers. However, if π is encoded as binary (base 2), would all the digits in 11.00100100001111... be normal? The table below shows the first several digits of π in each base from 2 to 16, as well as the natural logarithm base, `e`.
| base, `b` | `\pi_b` | base, `b` | `\pi_b` |
| 2 | 11.00100100001111 | 10 | 3.14159265358979 |
| 3 | 10.01021101222201 | 11 | 3.16150702865A48 |
| 4 | 3.02100333122220 | 12 | 3.184809493B9186 |
| 5 | 3.03232214303343 | 13 | 3.1AC1049052A2C7 |
| 6 | 3.05033005141512 | 14 | 3.1DA75CDA813752 |
| 7 | 3.06636514320361 | 15 | 3.21CD1DC46C2B7A |
| 8 | 3.11037552421026 | 16 | 3.243F6A8885A300 |
| `e` | 10.10100202000211 | ||
| source: virtuescience.com | |||
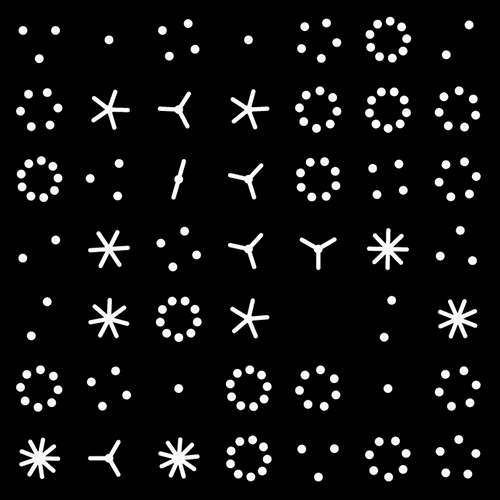
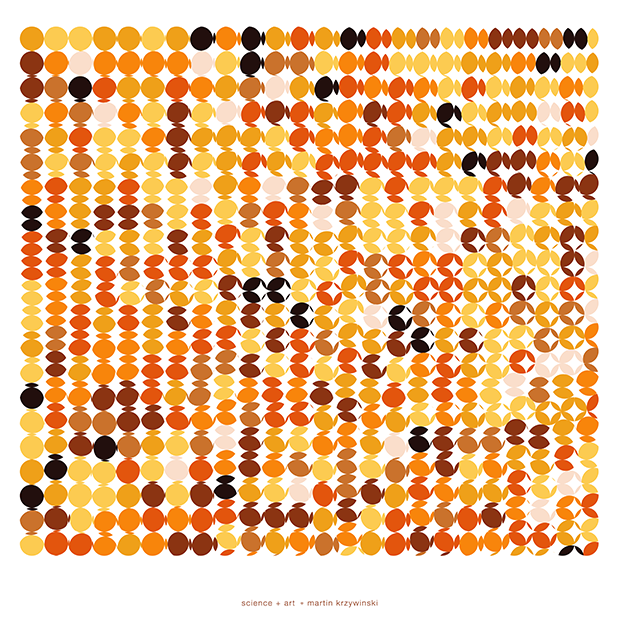
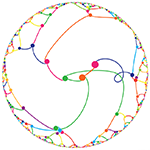
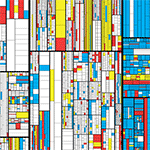
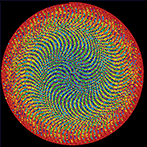
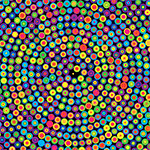
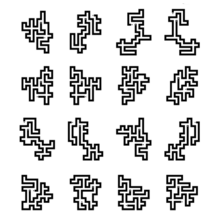
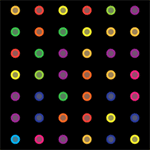
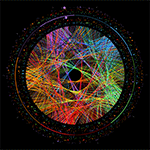
Because the digits in the numbers are essentially random (this is a conjecture), the essence of the art is based on randomness.
A vexing consequence of π being normal is that, because it is non-terminating, π would contain all patterns. Any word you might think of, encoded into numbers in any way, would appear infinitely many times. The entire works of Shakespeare, too. As well, all his plays in which each sentence is reversed, or has one spelling mistake, or two! In fact, you would eventually find π within π, but only if you have infinite patience.
This is why any attempts to use the digits of `\pi` to infer meaning about anything is ridiculous. The exact opposite of what you find is also in `\pi`.
Stoneham's constant
A number can be normal in one base, but another. For example, Stoneham's constant,
`\alpha_{2,3} = 1/2 + 1/(2^{3^1} 3^1) + 1/(2^{3^2} 3^2) + 1/(2^{3^3} 3^3) + ... + 1/(2^{3^k} 3^k) + ... `
is 0.54188368083150298507... in base 10 and 0.100010101011100011100011100... in base 2.
Stoneham's constant is provably normal in base 2. In some other bases, such 6, Stoneham's constant is provably not normal.
Propensity score weighting
The needs of the many outweigh the needs of the few. —Mr. Spock (Star Trek II)
This month, we explore a related and powerful technique to address bias: propensity score weighting (PSW), which applies weights to each subject instead of matching (or discarding) them.

Kurz, C.F., Krzywinski, M. & Altman, N. (2025) Points of significance: Propensity score weighting. Nat. Methods 22:1–3.
Happy 2025 π Day—
TTCAGT: a sequence of digits
Celebrate π Day (March 14th) and sequence digits like its 1999. Let's call some peaks.

Crafting 10 Years of Statistics Explanations: Points of Significance
I don’t have good luck in the match points. —Rafael Nadal, Spanish tennis player
Points of Significance is an ongoing series of short articles about statistics in Nature Methods that started in 2013. Its aim is to provide clear explanations of essential concepts in statistics for a nonspecialist audience. The articles favor heuristic explanations and make extensive use of simulated examples and graphical explanations, while maintaining mathematical rigor.
Topics range from basic, but often misunderstood, such as uncertainty and P-values, to relatively advanced, but often neglected, such as the error-in-variables problem and the curse of dimensionality. More recent articles have focused on timely topics such as modeling of epidemics, machine learning, and neural networks.
In this article, we discuss the evolution of topics and details behind some of the story arcs, our approach to crafting statistical explanations and narratives, and our use of figures and numerical simulations as props for building understanding.

Altman, N. & Krzywinski, M. (2025) Crafting 10 Years of Statistics Explanations: Points of Significance. Annual Review of Statistics and Its Application 12:69–87.
Propensity score matching
I don’t have good luck in the match points. —Rafael Nadal, Spanish tennis player
In many experimental designs, we need to keep in mind the possibility of confounding variables, which may give rise to bias in the estimate of the treatment effect.

If the control and experimental groups aren't matched (or, roughly, similar enough), this bias can arise.
Sometimes this can be dealt with by randomizing, which on average can balance this effect out. When randomization is not possible, propensity score matching is an excellent strategy to match control and experimental groups.
Kurz, C.F., Krzywinski, M. & Altman, N. (2024) Points of significance: Propensity score matching. Nat. Methods 21:1770–1772.
Understanding p-values and significance
P-values combined with estimates of effect size are used to assess the importance of experimental results. However, their interpretation can be invalidated by selection bias when testing multiple hypotheses, fitting multiple models or even informally selecting results that seem interesting after observing the data.
We offer an introduction to principled uses of p-values (targeted at the non-specialist) and identify questionable practices to be avoided.

Altman, N. & Krzywinski, M. (2024) Understanding p-values and significance. Laboratory Animals 58:443–446.
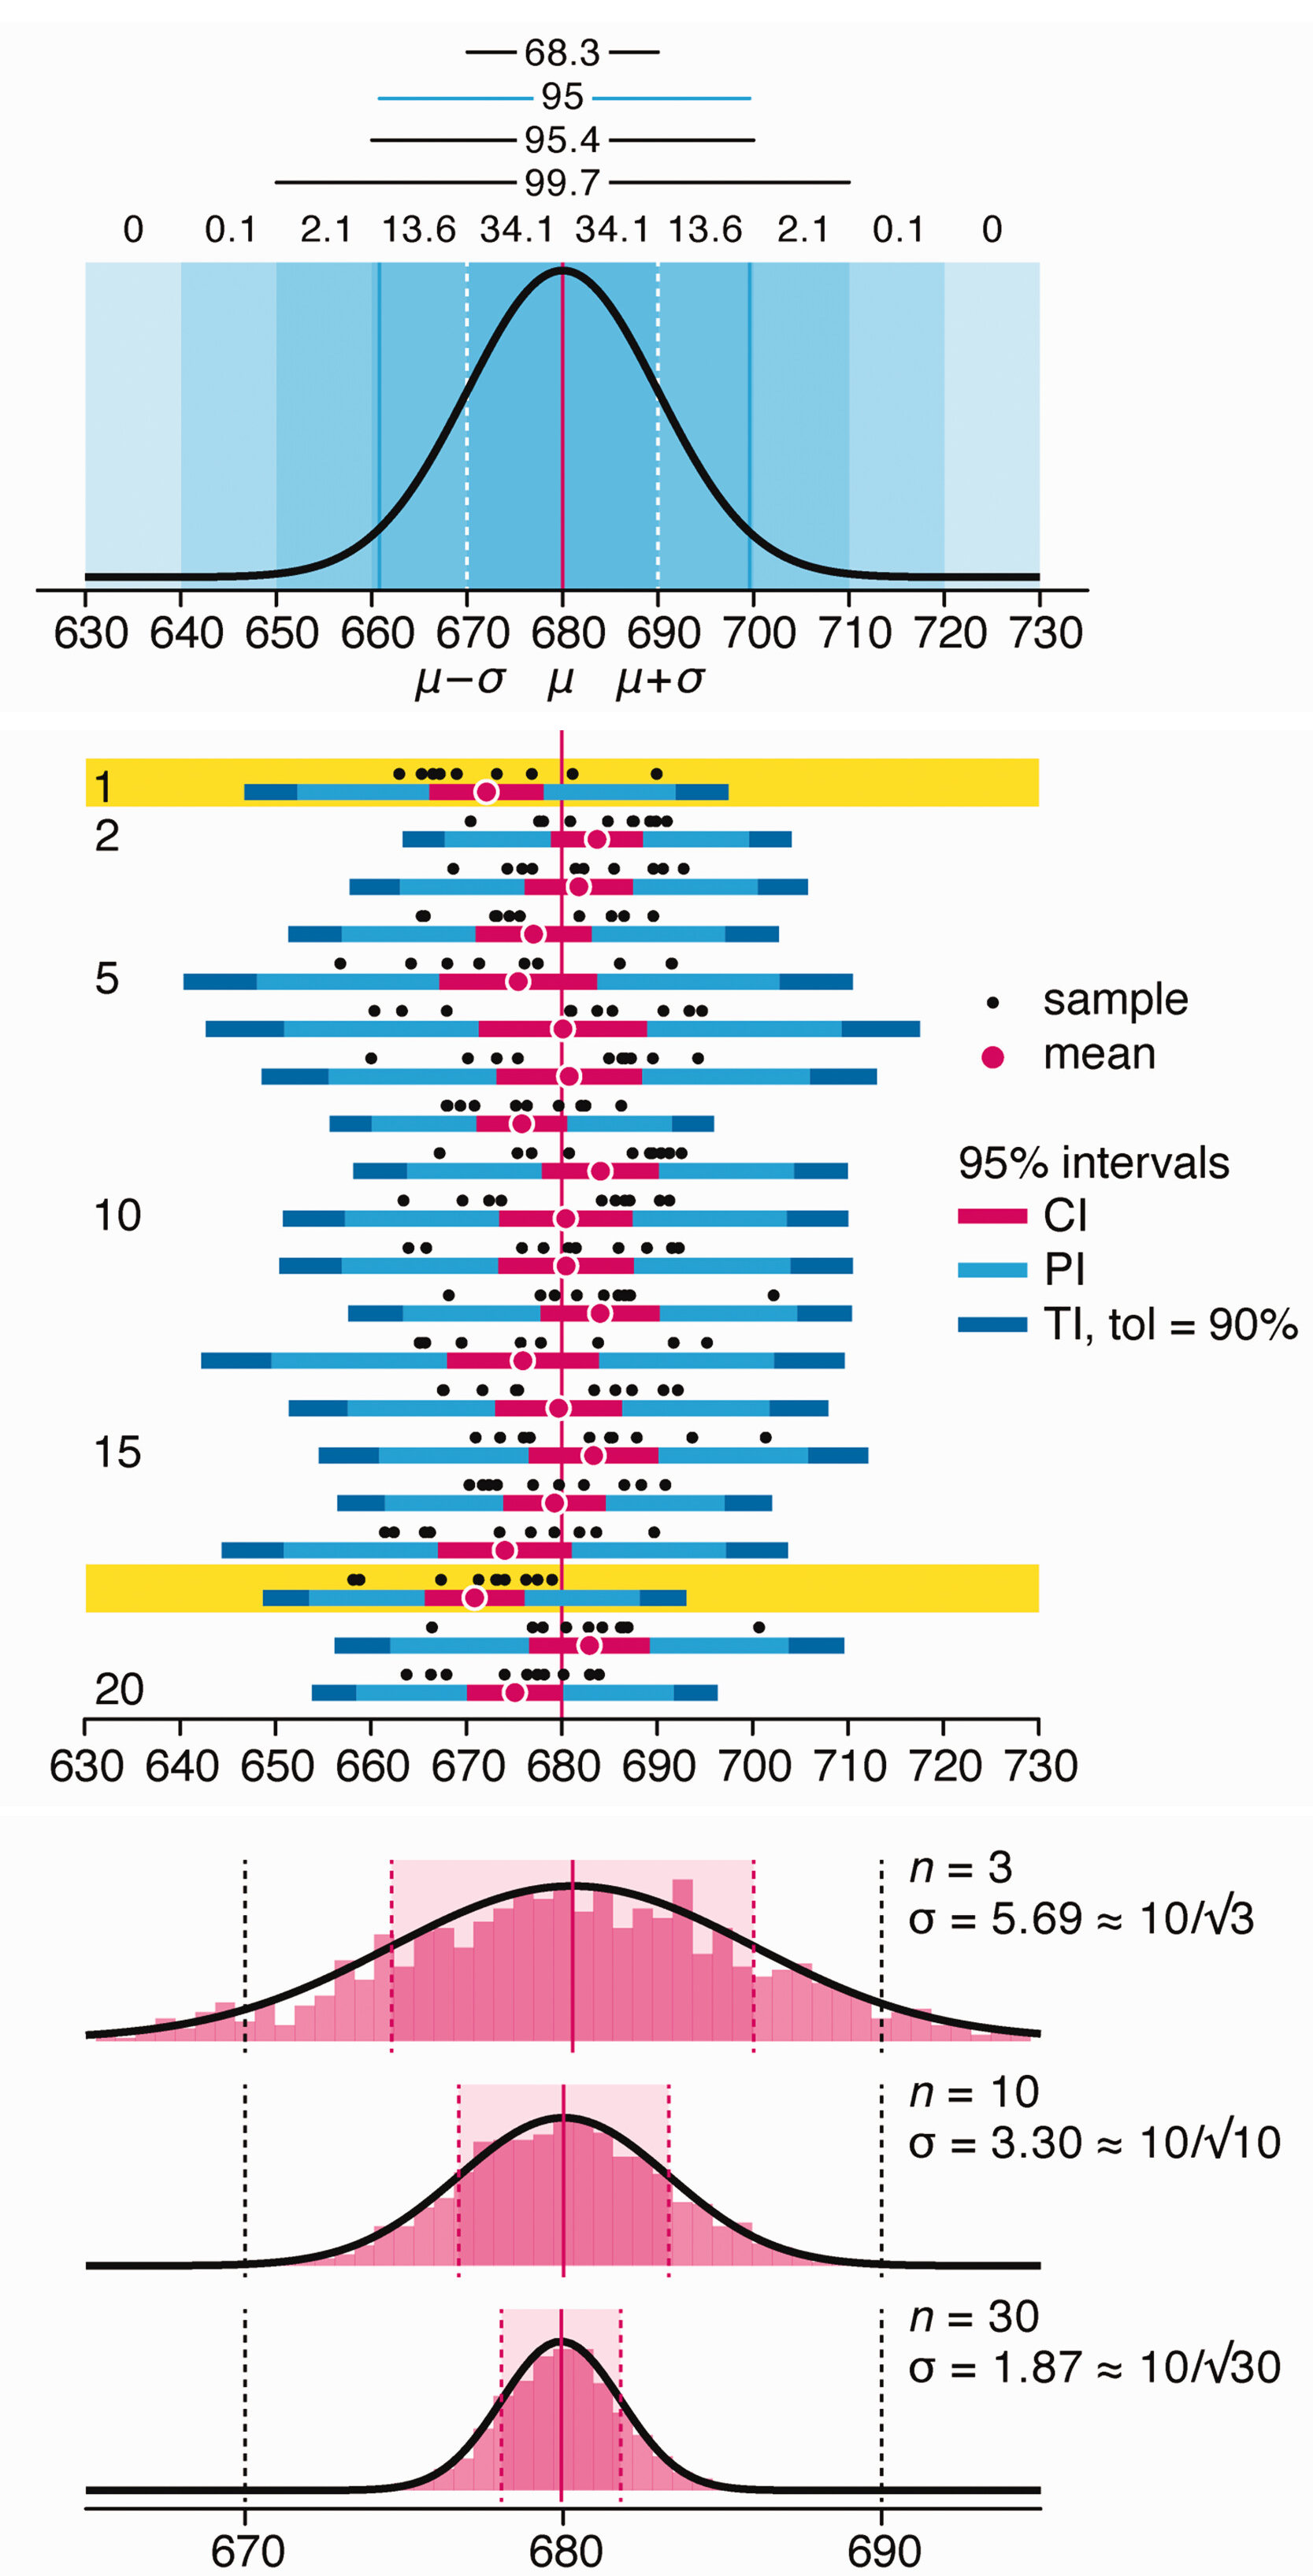
Depicting variability and uncertainty using intervals and error bars
Variability is inherent in most biological systems due to differences among members of the population. Two types of variation are commonly observed in studies: differences among samples and the “error” in estimating a population parameter (e.g. mean) from a sample. While these concepts are fundamentally very different, the associated variation is often expressed using similar notation—an interval that represents a range of values with a lower and upper bound.
In this article we discuss how common intervals are used (and misused).
Altman, N. & Krzywinski, M. (2024) Depicting variability and uncertainty using intervals and error bars. Laboratory Animals 58:453–456.