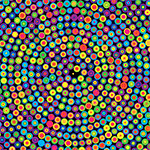
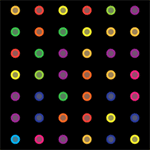
The art of Pi (`\pi`), Phi (`\phi`) and `e`

Numbers are a lot of fun. They can start conversations—the interesting number paradox is a party favourite: every number must be interesting because the first number that wasn't would be very interesting! Of course, in the wrong company they can just as easily end conversations.
I debunk the proof that `\pi = 3` by proving, once and for all, that `\pi` can be any number you like!

Periodically I receive kooky emails from people who claim to know more. Not more than me—which makes me feel great—but more than everybody—which makes me feel suspicious. A veritable fount of crazy is The Great Design Book, Integration of the Cosmic, Atomic & Darmic (Dark Matter) Systems by R.A. Forde.
Look at the margin of error. Archimedes' value for `\pi` (3.14) is an approximation — not an exact value. Would you accept an approximation or errors for your bank account balance? Then, why do you accept it for `\pi`? What else may be wrong? —R.A. Forde
What else may be wrong? Everything!
religion—the original roundoff error
Here is a "proof" I recently received that π = 3. The main thrust of the proof is that "God said so." QED? Not quite.
Curiously the proof was sent to me as a bitmap.
Given that it claims to show that π has the exact value of 3, it begins reasonably humbly—that I "may find this information ... interesting." Actually, if this were true, I would find this information staggering.
what's wrong with wrong math?
Because mathematics is the language of physical reality, there's only that far that you can go with wrong math. If you build it based on wrong math, it will break.
Given that math is axiomatic and not falsifiable, its arguments are a kind of argument from authority—the authority of the axioms. You must accept the axioms for the rest to make sense.
Religion also makes its arguments from authority—a kind of divine authority by proxy—though its "axioms" are nowhere as compelling nor its conclusions useful. Normally, the deception in religion's arguments from authority is not obvious. The arguments have been inocculated over time—amgiguity, hedging and the appeal to faith—to be immune to criticism.
When these arguments include demonstrably incorrect math, the curtain falls. The stage, props and other machinery of the scheme becomes apparent. Here you can see this machinery in action. Or, should I say, inaction.
no, π is not 3
If you're 5 years-old: (1) draw a reasonably good circle, (2) lay out a piece of string along the circle and measure the length of the string (circumference), (3) measure the diameter of the circle, (4) divide circumference by diameter. You should get a value close to the actual value of π = 3.14. If you're older, read on.
The book purports "real" (why the quotes?) life experiments to demonstrate that that π is 3. I'll take a look at one below, since it makes use of a coffee cup and I don't like to see coffee cups besmirched through hucksterish claims.
What appears below is a critique of a wrong proof. It is not a proof that `\pi` = 3.
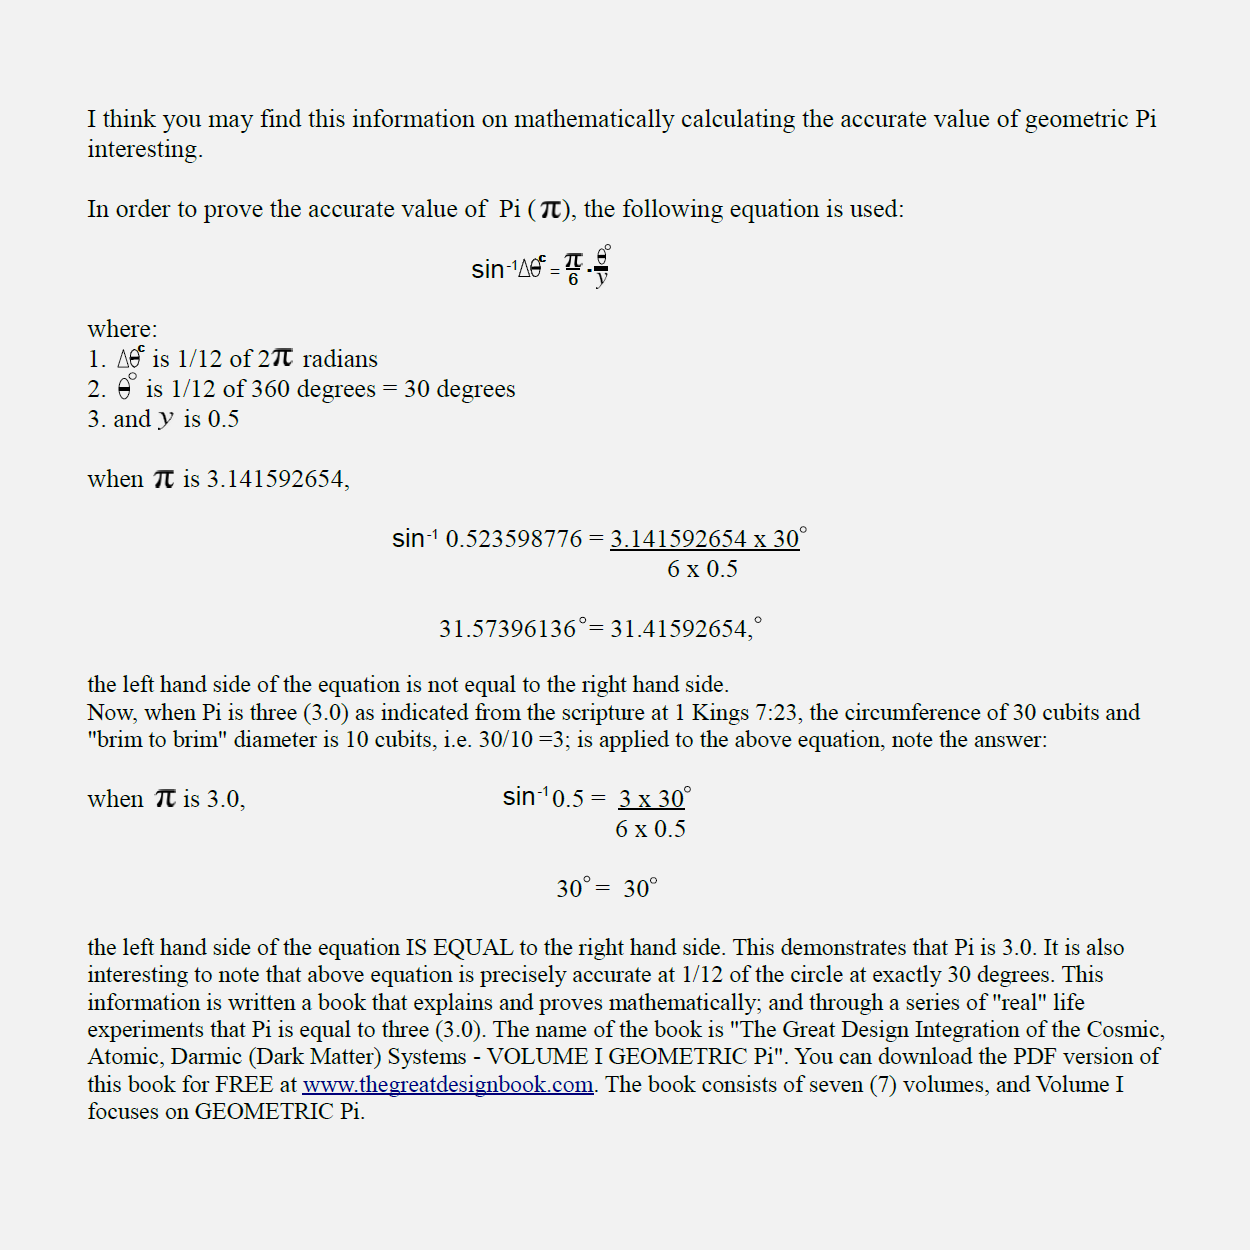
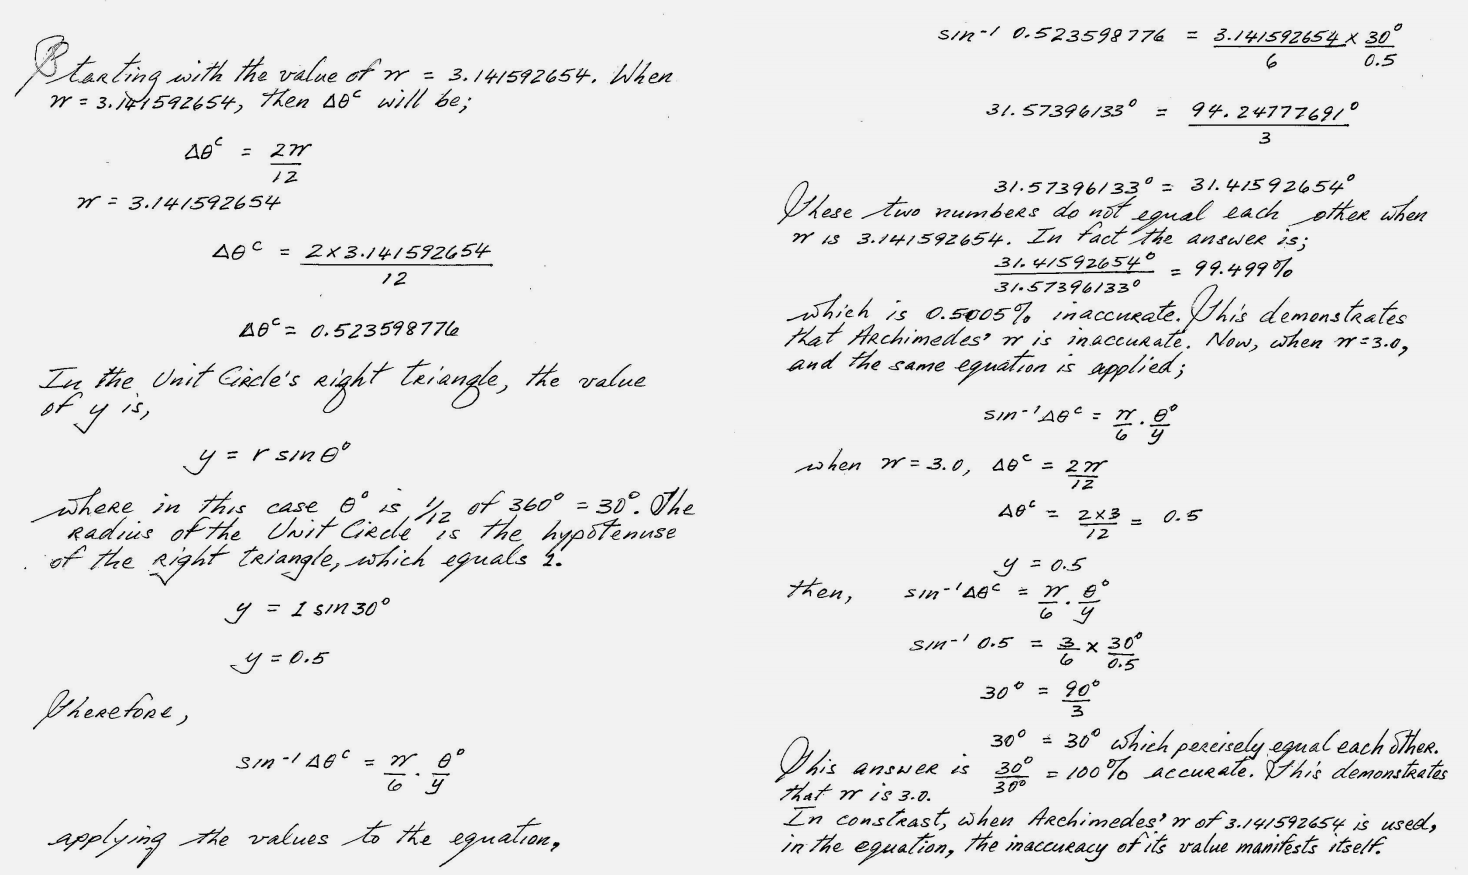
The proof begins with some horrendous notation. But, since notation has never killed anyone (though frustration is a kind of death, of patience), let's go with it. We're asked to consider the following equation, which is used by the proof to show that `\pi = 3`. $$ \sin^{-1} \Delta \theta^c = \frac{\pi}{6} \frac{\theta^{\circ}}{y}\tag{1} $$
where $$ \begin{array}{l} \Delta \theta^c = \frac{2\pi}{12} & \theta^{\circ} = \frac{360^\circ}{12} & y = \frac{1}{2} \end{array} $$
At this point you might already suspect that we're asked to consider a statement which is an inequality. The proof might as well have started by saying "We will use `6 = 2\pi` to show that `\pi = 3`." In fact, this is the exact approach I use below prove that `\pi` is any number. But let's continue with examining the proof.
Nothing so simple as equation (1) should look so complicated. Let's clean it up a little bit. $$ \sin^{-1} a = \tfrac{\pi}{3} b\tag{2} $$
where $$ \begin{array}{l} a = \frac{2\pi}{12} & b = \frac{360^\circ}{12} \end{array} $$
The fact that we're being asked to take the inverse sine of a quantity that is explicitly indicated to be an angle should make you suspicious. Although an angle is a dimensionless quantity and we can write $$ \sin^{-1}(\pi \; \text{rad}) = \sin^{-1}(\pi) = 0 $$
using an angle as an argument to `\sin()` suggests that we don't actually know what the function does.
If we go back to (2) and substitute the values we're being asked to use, $$ \sin^{-1} \tfrac{\pi}{6} = \tfrac{\pi}{3} 30 = 10 \pi \tag{3} $$
we get $$ 0.551 = 31.416 \tag{4} $$
That's as good an inequality as you're going to get. An ounce of reason would be enough for us to stop here, backtrack and find our error. Short of that, we press ahead to see how we can manipulate this to our advantage.
In the next step, the proof treats the left-hand side as a quantity in radians—completely bogus step, but let's go with it—and converts it to degrees to obtain $$ 0.551 \times \tfrac{360}{2 \pi} = 31.574 $$
Yes, we just multiplied only one side of equation (4) by a value that is not one. Sigh.
After committing this crime, the proof attempts to shock you into confusion by stating that $$ 31.574 \neq 31.416 $$
And, given that these numbers aren't the same—they weren't the same in equation (4) either, so the additional bogus multiplication by \(\tfrac{360}{{2 \pi}}\) wasn't actually needed‐the proof states that this inequality must be due to the fact that we used the wrong value for `\pi` in equation (1).
The proof fails to distinguish the difference between an incorrect identity (e.g. `1 = 2` is not correct) and the concept of a variable (e.g. `1 = 2 x` may be correct, depending on the value of `x`). Guided by the dim headlamp of unreason, it suggests that we right our delusion that `\pi = 3.1415...` and instead use `\pi = 3` in equation (1), we get $$ sin^{-1} \tfrac{1}{2} = 30 $$
which is true, because `\sin(30^\circ) = \tfrac{1}{2}`. Therefore, `\pi = 3`.
what just happened?
The entire proof is bogus because it starts with an equality that is not true. In equation (1), the left hand side is not equal to the right hand side.
a simpler wrong proof
To illustrate explicitly what just happened, here's a proof that `\pi = 4` using the exact same approach.
proof that π = 4
Consider the equation, $$ 4 = \pi \tag{5} $$
if we substitute the conventionally accepted value of `\pi` we find $$ 4 = 3.1415... $$
which isn't true! But if we use `\pi = 4` then $$ 4 = 4 $$
which is true! Therefore, `\pi = 4`. QED.
This only demonstrated that I'm an idiot, not that `\pi = 4`.
proof that π is any number you like
But why stop at 4? Everyone can have their own value of `\pi`. In equation (5) in the above "proof", set 4 to any number you like and use it to prove that `\pi` is any number you like.
Isn't misunderstanding math fun?
litany of horrors
The history of the value of π is rich. There is good evidence for `\pi = (16/9)^2` in the Egyptian Rhind Papyris (circa 1650 BC). Archimedes (287-212 BC) estimated `\pi \approx 3.1418` using the inequality `\tfrac{223}{71} \lt \pi \lt \tfrac{22}{7}`
One thing is certain, the precision to which the number is known is always increasing. At this point, after about 12 trillion digits.
So, it might seem, that `\pi \approx 3` is ancient history. Not to some.
Approximations are fantastic—they allow us to get the job done early. We use the best knowledge available to us today to solve today's problems. Tomorrow's problems might require tomorrow's knowledge—an improvement in the approximations of today.
`\pi = 3` is an approximation that is about 2,000 years old (not the best of its time, either). It's comical to consider it as today's best knowledge.
don't bring coffee cups into it
One of the "real" life experiments proposed in the book (pp. 65–68) uses a coffee cup. The experiment is a great example in failing to identify your wrong assumptions.
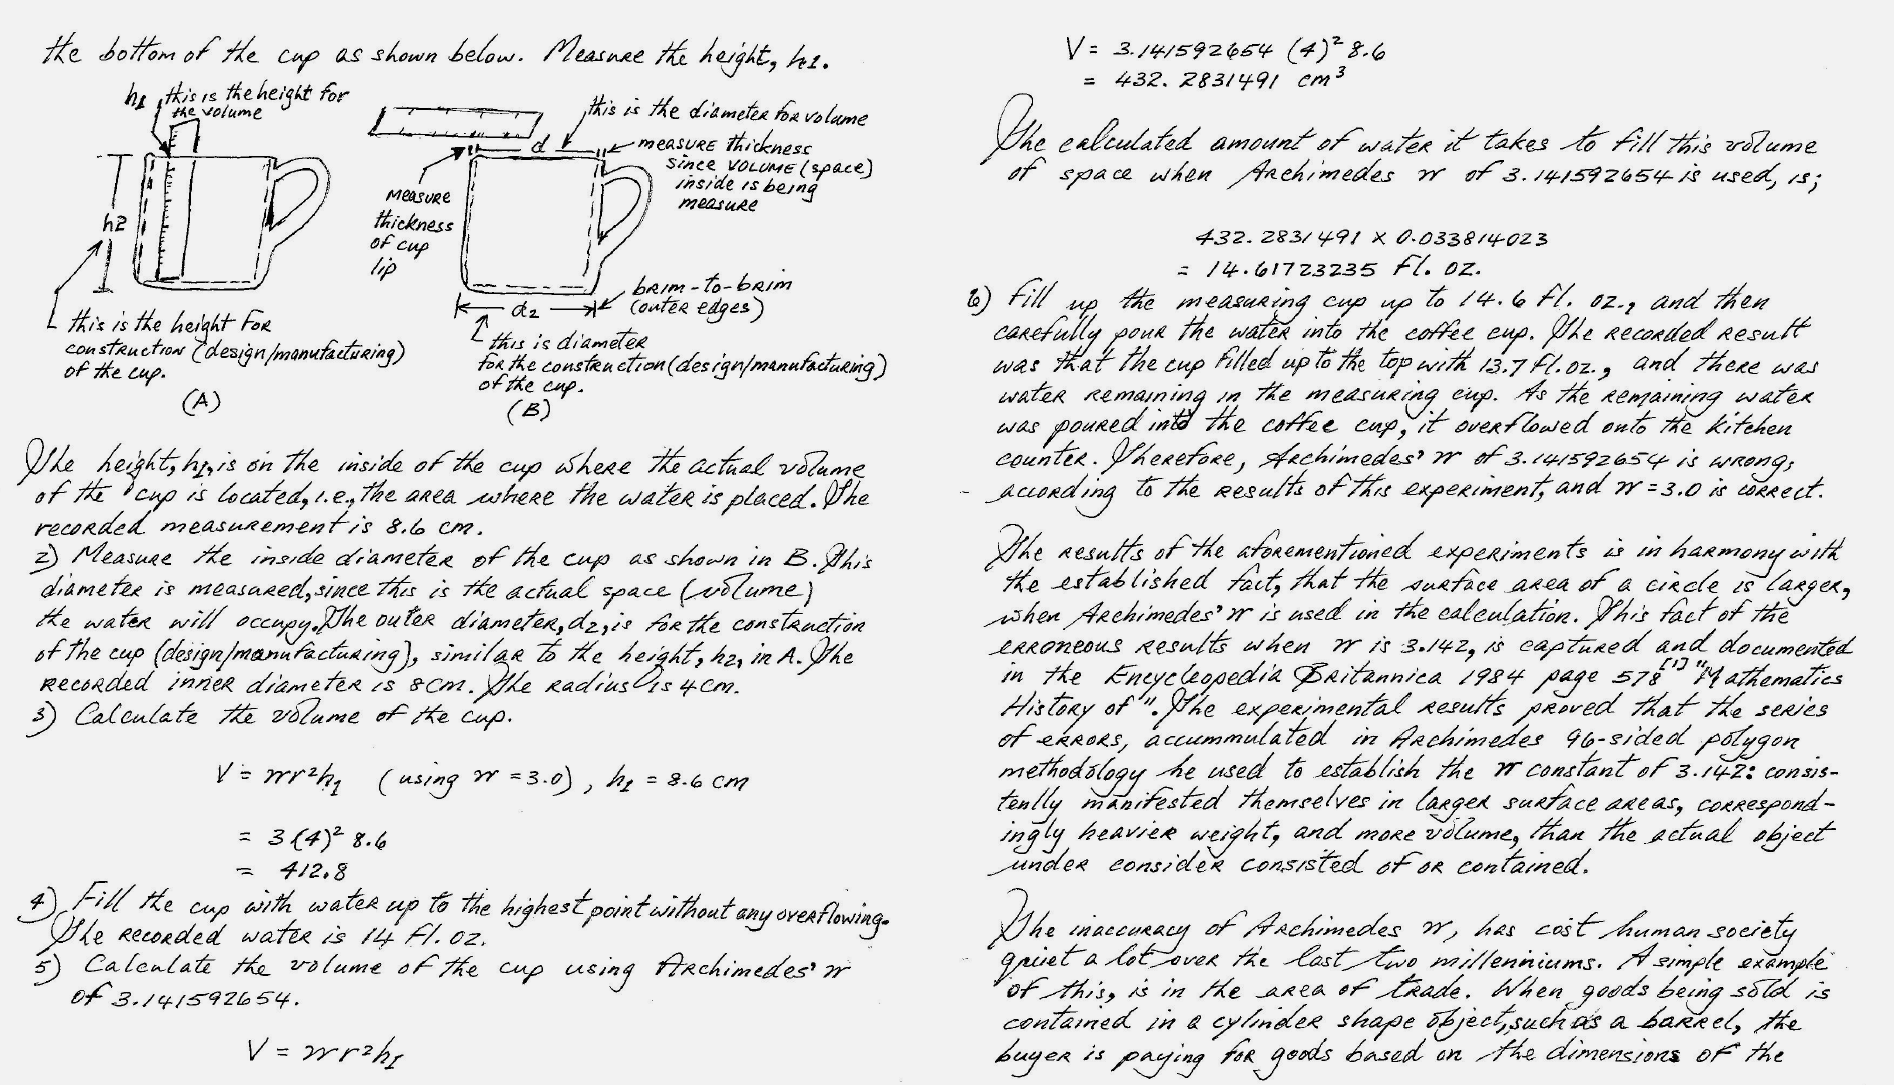
First you take measurements of your coffee cup. The author finds that the inner radius is `r = 4 cm` and the depth is `d = 8.6 cm`. Using the volume of a cylinder, the author finds that the volume is either `412.8 \; \mathrm{cm}^3 \ 14.0 \mathrm \; {fl.oz}` if `\pi=3` or `432.3 \; \mathrm{cm}^3 = 14.6 \mathrm \; {fl.oz.}` if `\pi=3.14...`.
You're next instructed to full up a measuring cup to 14.6 fl.oz. (good luck there, since measuring cups usually come in 1/2 (4 fl.oz) or 1/3 (2.6 fl.oz) increments).
The author supposedly does this and finds that he could fill the cup to the brim using only 13.7 fl.oz, with the remaining 0.9 fl.oz. spilling.
And now, for some reason, he concludes that this is proof that `\pi = 3`, despite that when using this value of `\pi` the cup's volume was calculated to be 14 fl.oz. not 13.7 fl.oz.
Other than being sloppy, it's most likely that the original assumption that the inside of the coffee cup is a perfect cylinder is wrong. The inside of the cup is probably smooth and perhaps even slightly tapered. Using the maximum radius and depth dimensions will yield a volume larger than the cup's. This is why water spilled out.
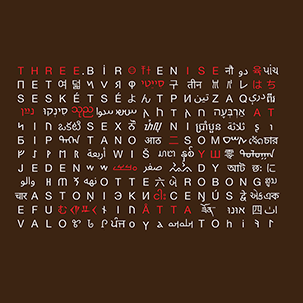
Nasa to send our human genome discs to the Moon
We'd like to say a ‘cosmic hello’: mathematics, culture, palaeontology, art and science, and ... human genomes.

Comparing classifier performance with baselines
All animals are equal, but some animals are more equal than others. —George Orwell
This month, we will illustrate the importance of establishing a baseline performance level.
Baselines are typically generated independently for each dataset using very simple models. Their role is to set the minimum level of acceptable performance and help with comparing relative improvements in performance of other models.
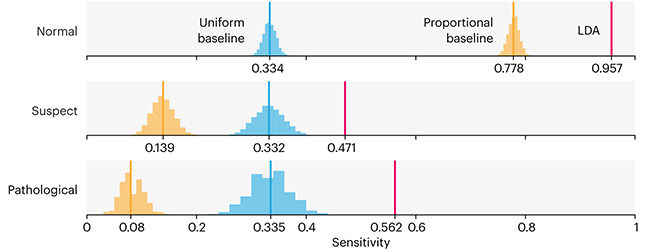
Unfortunately, baselines are often overlooked and, in the presence of a class imbalance5, must be established with care.
Megahed, F.M, Chen, Y-J., Jones-Farmer, A., Rigdon, S.E., Krzywinski, M. & Altman, N. (2024) Points of significance: Comparing classifier performance with baselines. Nat. Methods 20.
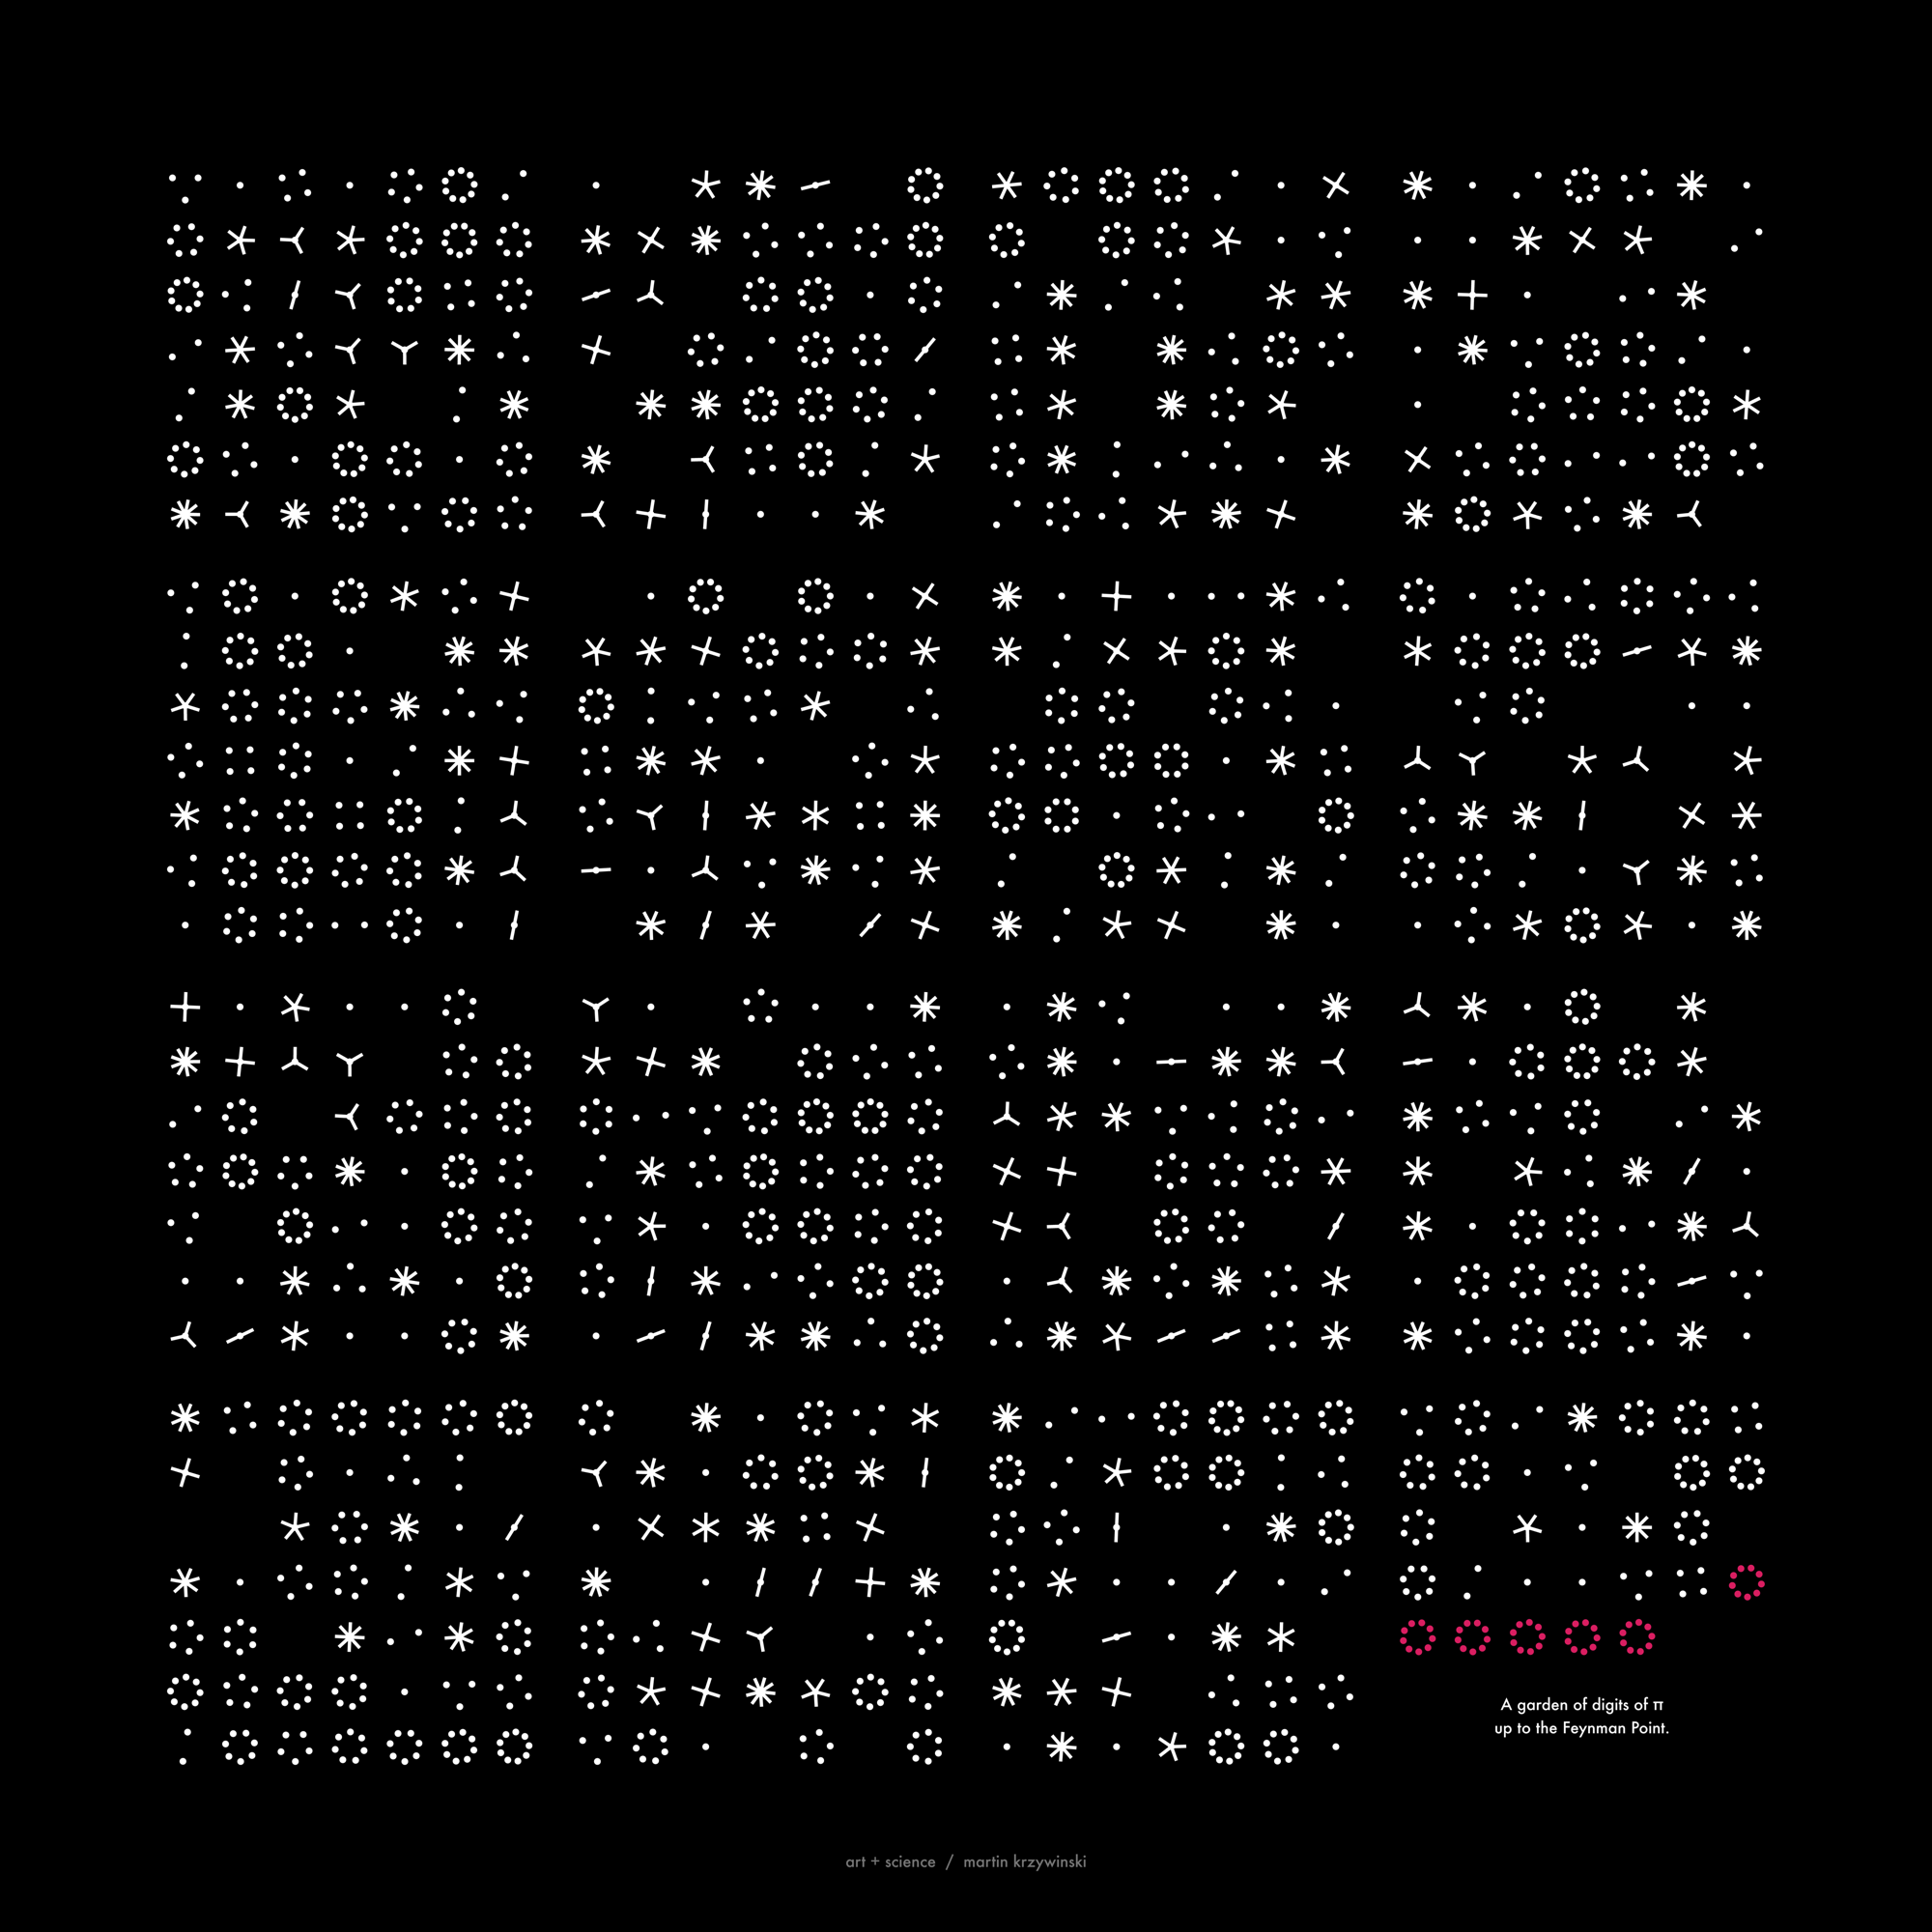
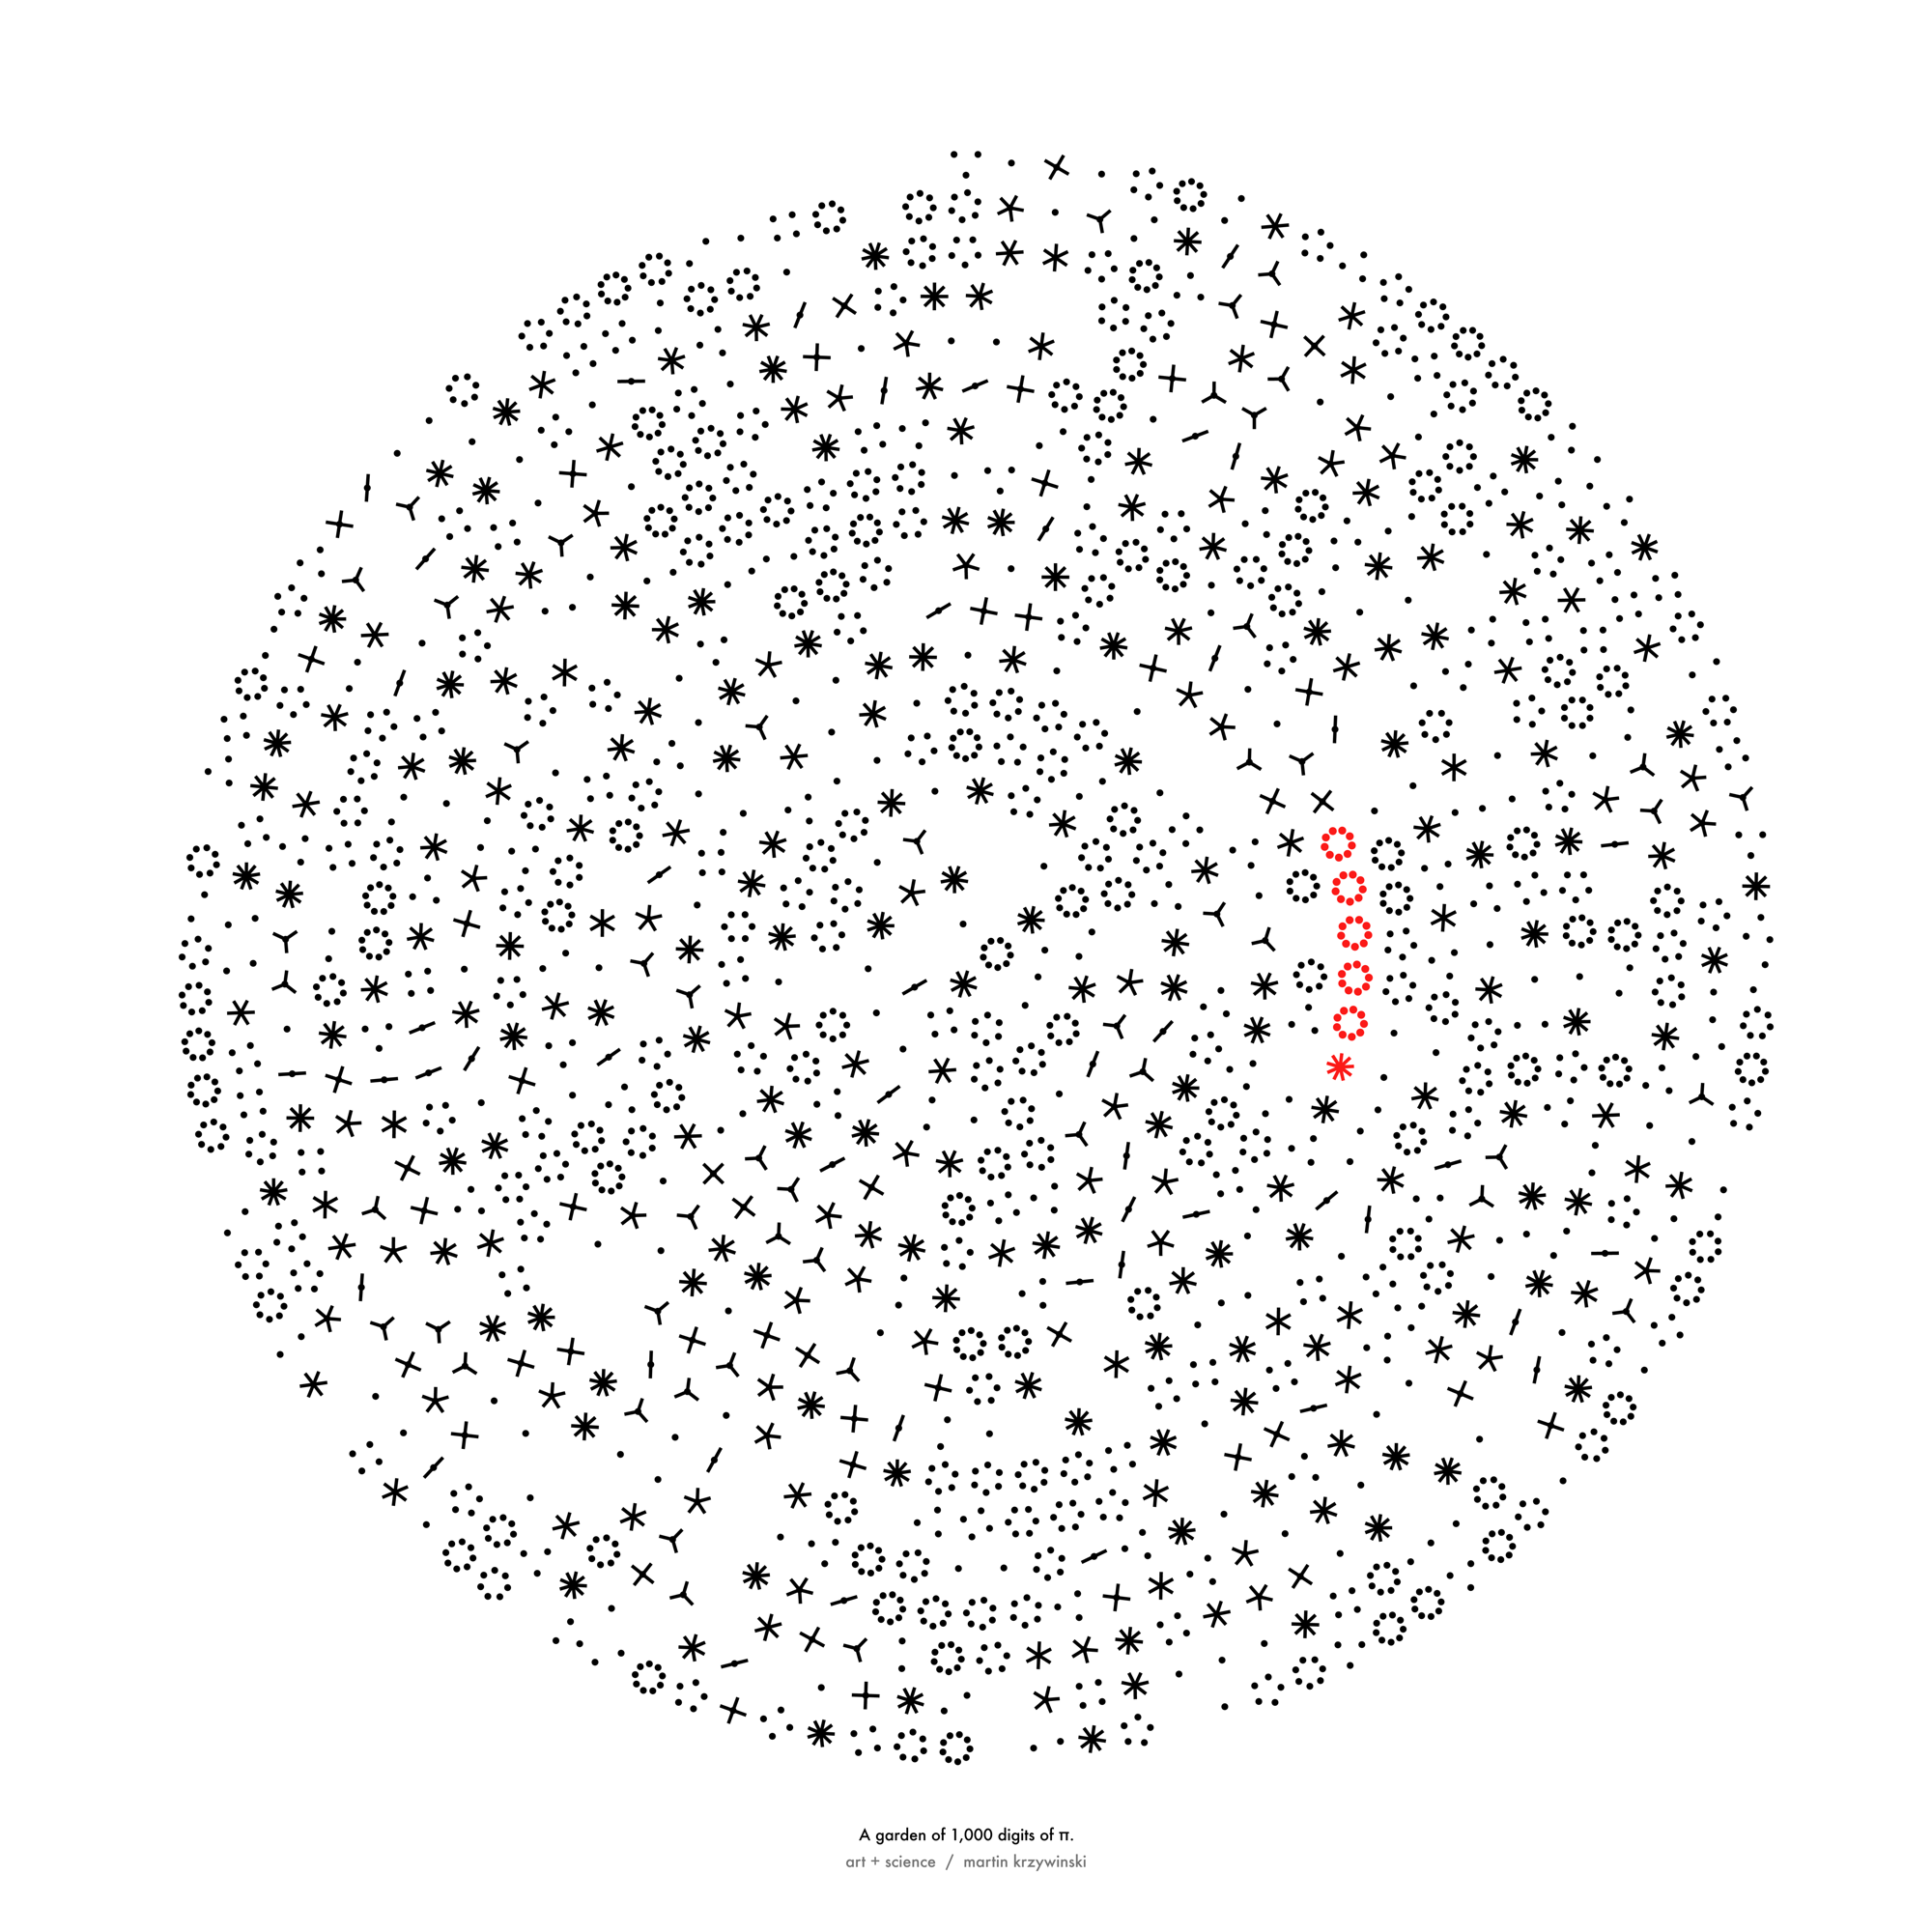
Happy 2024 π Day—
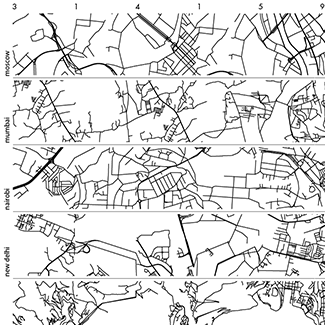
sunflowers ho!
Celebrate π Day (March 14th) and dig into the digit garden. Let's grow something.
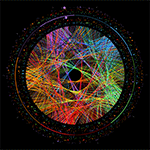
How Analyzing Cosmic Nothing Might Explain Everything
Huge empty areas of the universe called voids could help solve the greatest mysteries in the cosmos.
My graphic accompanying How Analyzing Cosmic Nothing Might Explain Everything in the January 2024 issue of Scientific American depicts the entire Universe in a two-page spread — full of nothing.
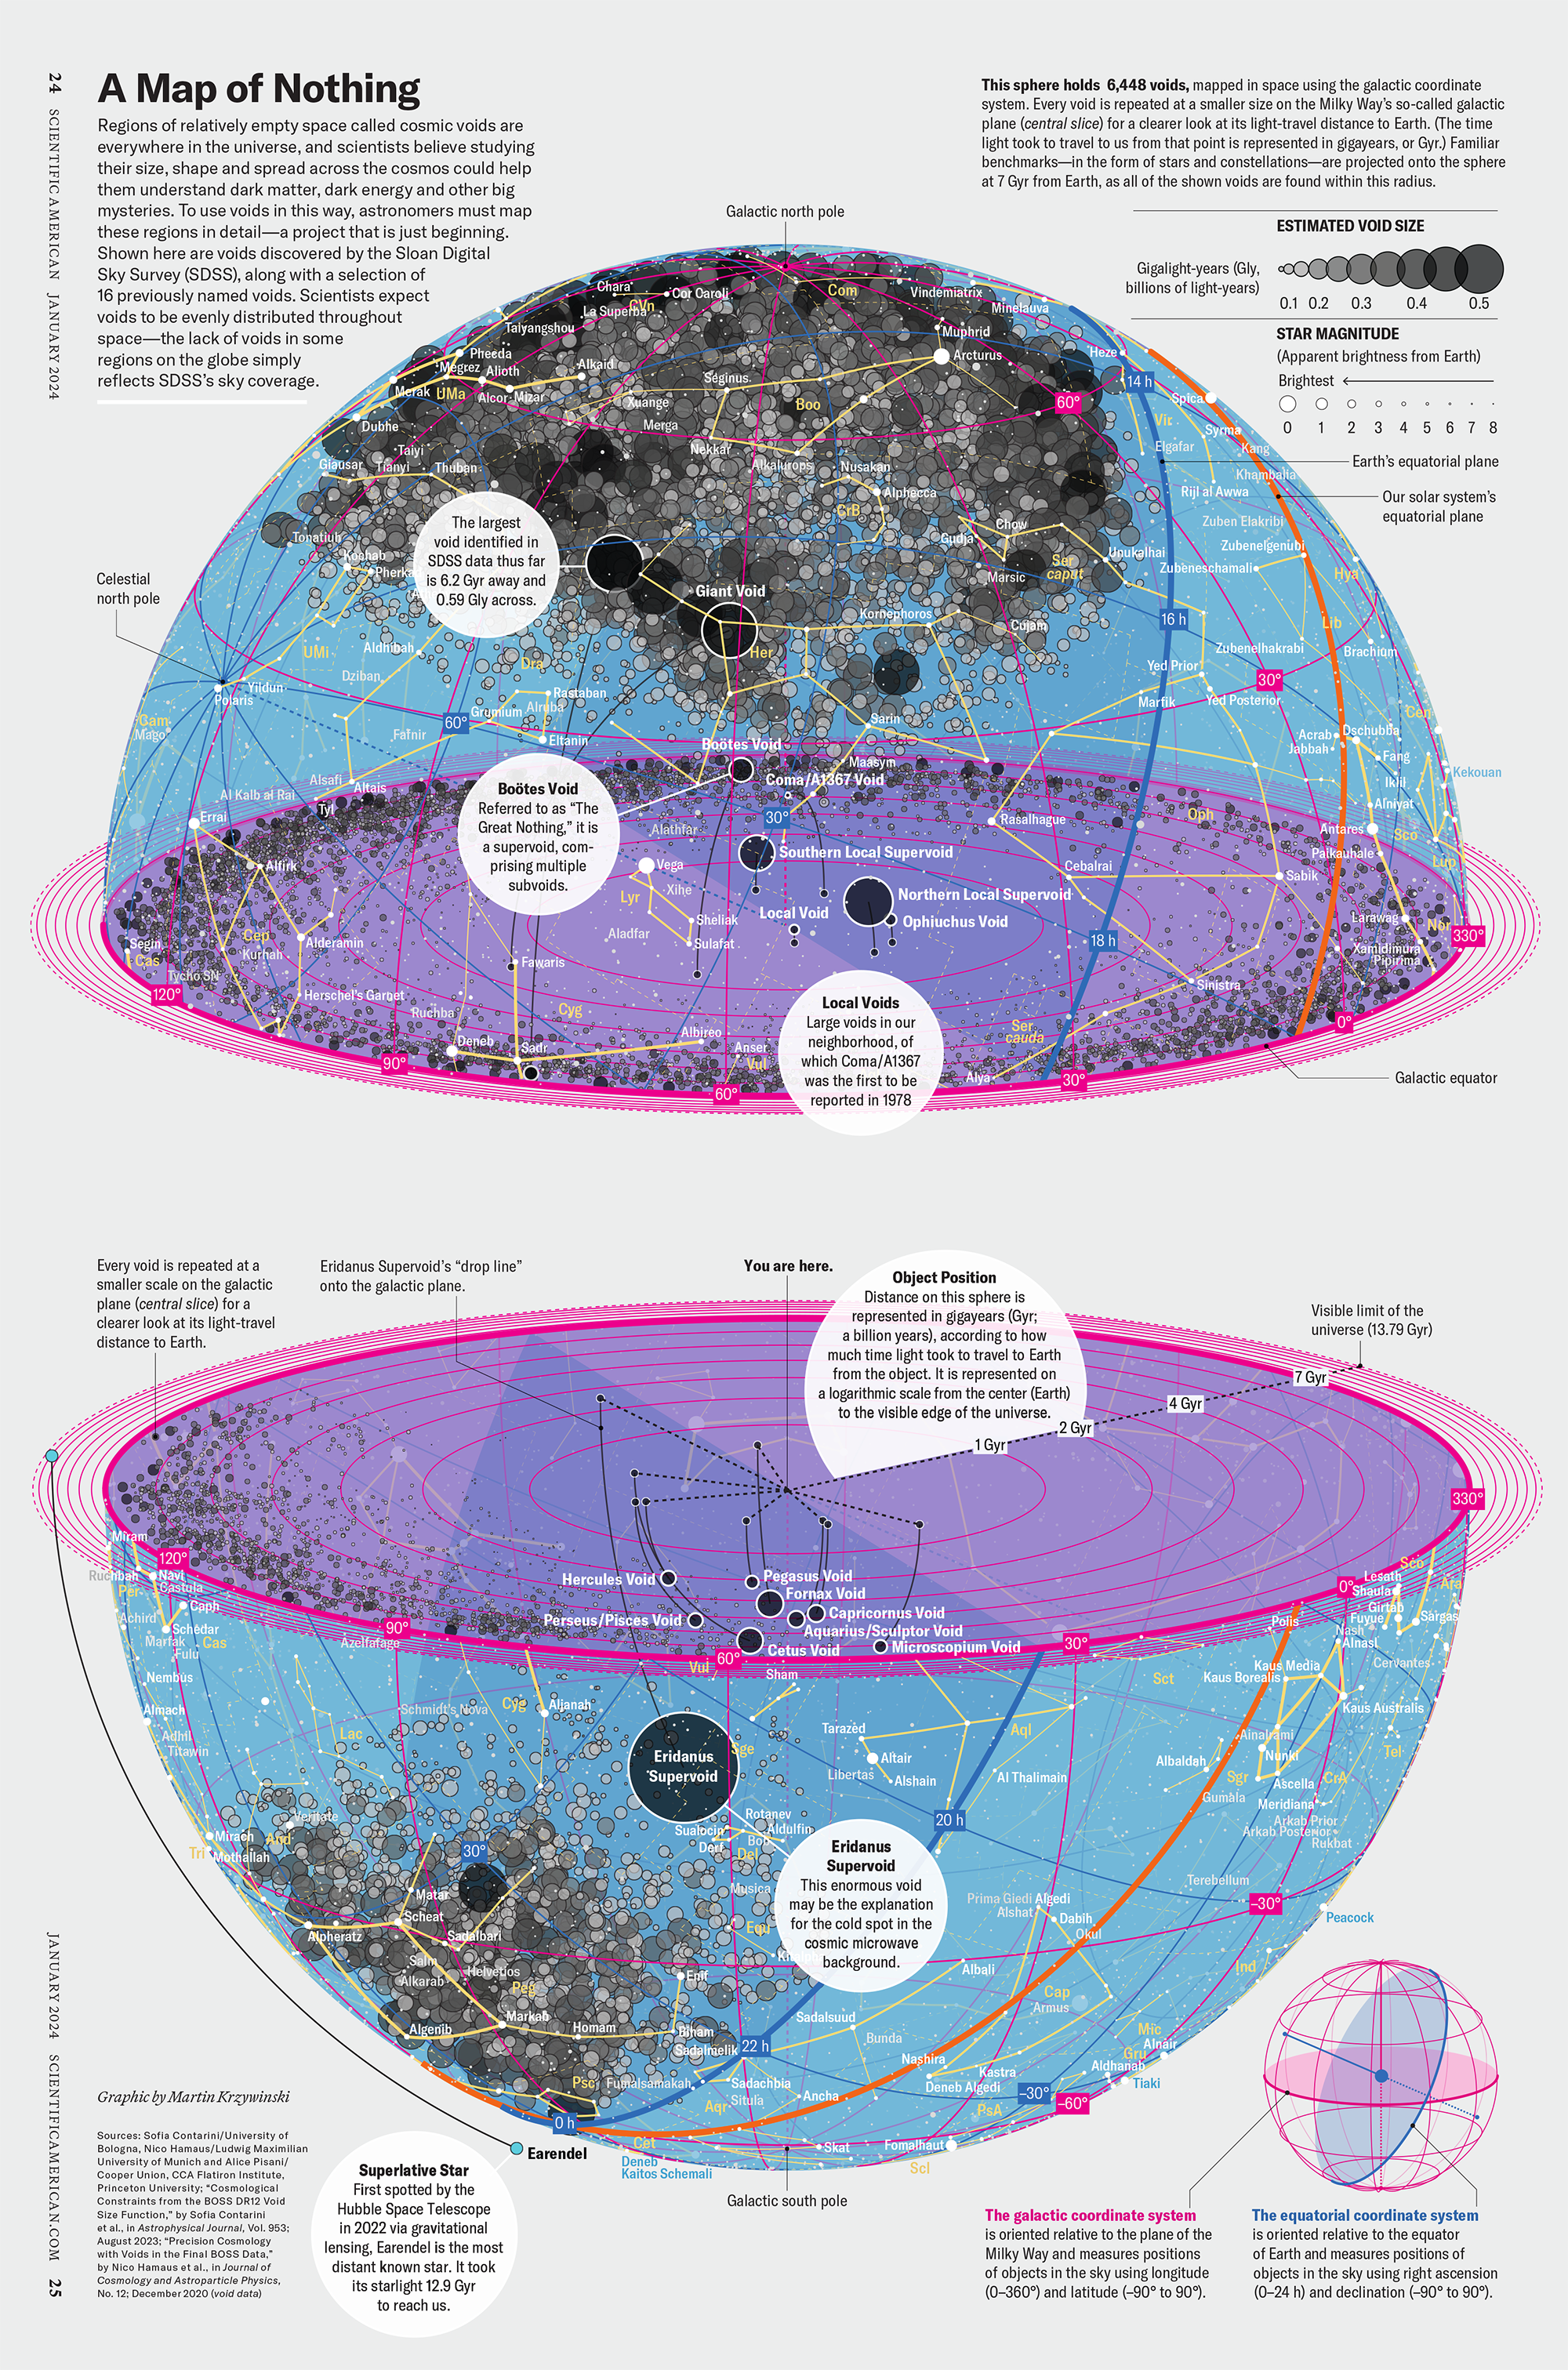
The graphic uses the latest data from SDSS 12 and is an update to my Superclusters and Voids poster.
Michael Lemonick (editor) explains on the graphic:
“Regions of relatively empty space called cosmic voids are everywhere in the universe, and scientists believe studying their size, shape and spread across the cosmos could help them understand dark matter, dark energy and other big mysteries.
To use voids in this way, astronomers must map these regions in detail—a project that is just beginning.
Shown here are voids discovered by the Sloan Digital Sky Survey (SDSS), along with a selection of 16 previously named voids. Scientists expect voids to be evenly distributed throughout space—the lack of voids in some regions on the globe simply reflects SDSS’s sky coverage.”
voids
Sofia Contarini, Alice Pisani, Nico Hamaus, Federico Marulli Lauro Moscardini & Marco Baldi (2023) Cosmological Constraints from the BOSS DR12 Void Size Function Astrophysical Journal 953:46.
Nico Hamaus, Alice Pisani, Jin-Ah Choi, Guilhem Lavaux, Benjamin D. Wandelt & Jochen Weller (2020) Journal of Cosmology and Astroparticle Physics 2020:023.
Sloan Digital Sky Survey Data Release 12
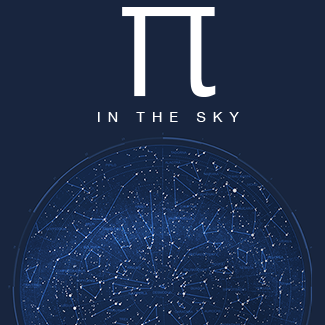
Alan MacRobert (Sky & Telescope), Paulina Rowicka/Martin Krzywinski (revisions & Microscopium)
Hoffleit & Warren Jr. (1991) The Bright Star Catalog, 5th Revised Edition (Preliminary Version).
H0 = 67.4 km/(Mpc·s), Ωm = 0.315, Ωv = 0.685. Planck collaboration Planck 2018 results. VI. Cosmological parameters (2018).
constellation figures
stars
cosmology
Error in predictor variables
It is the mark of an educated mind to rest satisfied with the degree of precision that the nature of the subject admits and not to seek exactness where only an approximation is possible. —Aristotle
In regression, the predictors are (typically) assumed to have known values that are measured without error.
Practically, however, predictors are often measured with error. This has a profound (but predictable) effect on the estimates of relationships among variables – the so-called “error in variables” problem.
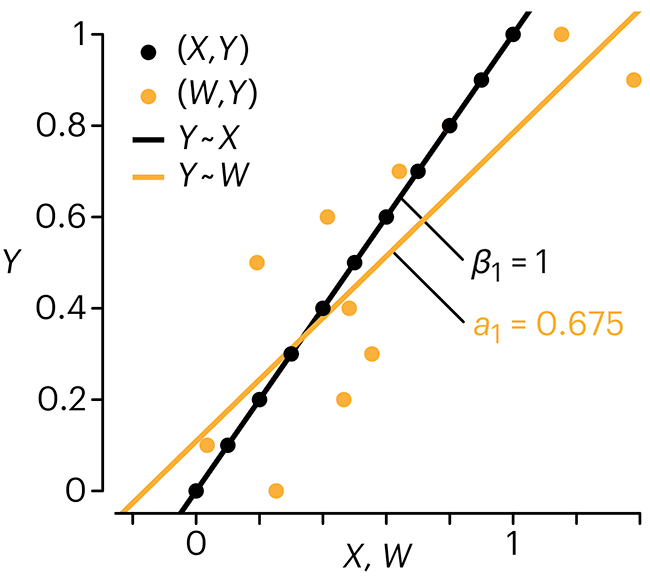
Error in measuring the predictors is often ignored. In this column, we discuss when ignoring this error is harmless and when it can lead to large bias that can leads us to miss important effects.
Altman, N. & Krzywinski, M. (2024) Points of significance: Error in predictor variables. Nat. Methods 20.
Background reading
Altman, N. & Krzywinski, M. (2015) Points of significance: Simple linear regression. Nat. Methods 12:999–1000.
Lever, J., Krzywinski, M. & Altman, N. (2016) Points of significance: Logistic regression. Nat. Methods 13:541–542 (2016).
Das, K., Krzywinski, M. & Altman, N. (2019) Points of significance: Quantile regression. Nat. Methods 16:451–452.
Convolutional neural networks
Nature uses only the longest threads to weave her patterns, so that each small piece of her fabric reveals the organization of the entire tapestry. – Richard Feynman
Following up on our Neural network primer column, this month we explore a different kind of network architecture: a convolutional network.
The convolutional network replaces the hidden layer of a fully connected network (FCN) with one or more filters (a kind of neuron that looks at the input within a narrow window).
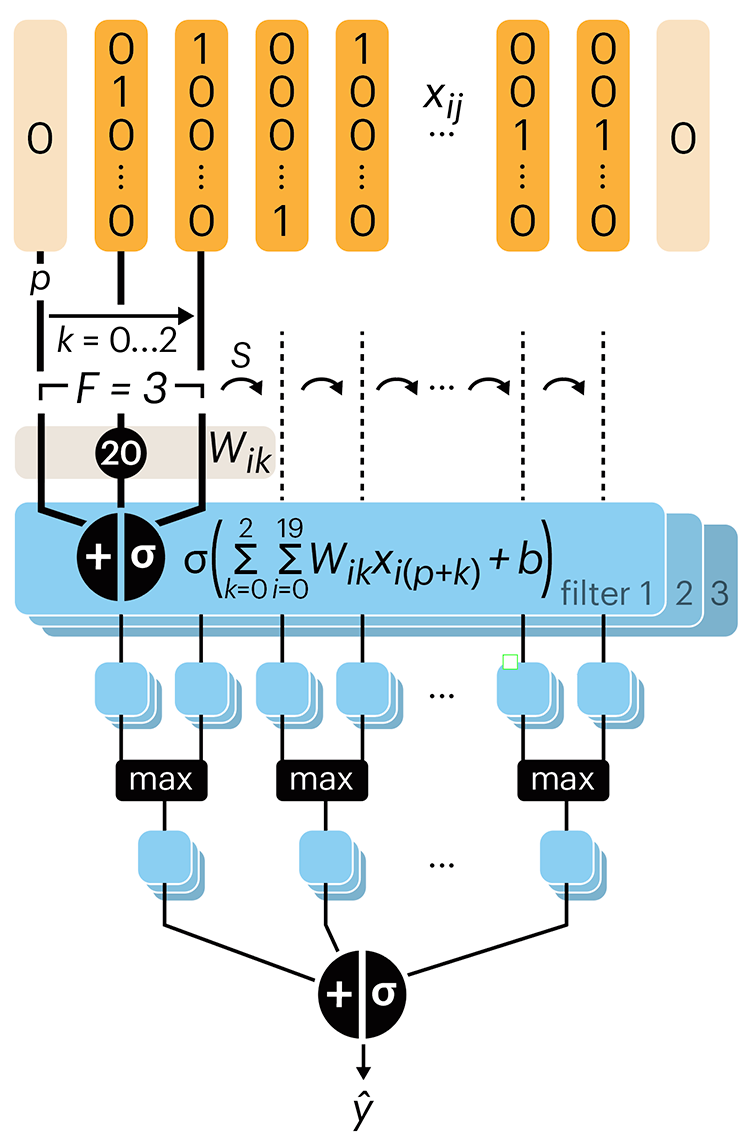
Even through convolutional networks have far fewer neurons that an FCN, they can perform substantially better for certain kinds of problems, such as sequence motif detection.
Derry, A., Krzywinski, M & Altman, N. (2023) Points of significance: Convolutional neural networks. Nature Methods 20:1269–1270.
Background reading
Derry, A., Krzywinski, M. & Altman, N. (2023) Points of significance: Neural network primer. Nature Methods 20:165–167.
Lever, J., Krzywinski, M. & Altman, N. (2016) Points of significance: Logistic regression. Nature Methods 13:541–542.