
Designing for Color blindness
Color choices and transformations for deuteranopia and other afflictions
Here, I help you understand color blindness and describe a process by which you can make good color choices when designing for accessibility.
The opposite of color blindness is seeing all the colors and I can help you find 1,000 (or more) maximally distinct colors.
You can also delve into the mathematics behind the color blindness simulations and learn about copunctal points (the invisible color!) and lines of confusion.
In an audience of 8 men and 8 women, chances are 50% that at least one has some degree of color blindness1,2. When encoding information or designing content, use colors that is color-blind safe.
1About 8% of males and 0.5% of females are affected with some kind of color blindness in populations of European descent (wikipedia, Worldwide prevalence of red-green color deficiency, JOSAA). The rate for other races is lower Asians and Africans is lower (Caucasian Boys Show Highest Prevalence of Color Blindness Among Preschoolers, AAO).
2The probability that among `N=8` men and `N=8` women at least one person is affected by color blindness is `P(men,women) = P(8,8) = 1 - (1-0.08)^8(1-0.005)^8 = 0.51`. For `N=34` (i.e., 68 people in total), this probability is `P(34,34)=0.95`. Because the rate of color blindness in women is so low, for most groups of mixed gender we can approximate the probability by only counting the men. For example, in a group of 17 women the probability that at least one of them is color blind is `P(0,17) = 0.082`, which is the same probability as for 1 man, `P(1,0)`.
color receptors are reduced or absent in color blindness
The normal human eye is a 3-channel color detector3. There are three types of photoreceptors, each sensitive to a different part of the spectrum. Their combined response to a given wavelength produces a unique response that is the basis of the perception of color.
3Compared to hearing, the color vision is a primitive detector. While we can hear thousands of distinct frequencies and process them simultaneously, we have only three independent color inputs. While the ear can distinguish pure tones from complex sounds that have multiple frequencies the eye is relatively unsophisticated in separating a color sensation into its three constituent primary stimuli.
People with color blindness have one of the photo receptor groups either reduced in number or entirely missing. With only two groups of photoreceptors, the perception of hue is drastically altered.
For example, in deuteranopia, the most common type of color blindness, the medium (M) wavelength photoreceptors are reduced in number or missing. This results in the loss of perceived difference between reds and greens because only one group of photoreceptors (L) are sensitive to the wavelengths of these colors. The spectrum appears to be split into two hues along the blue-green boundary (see figure below), which is roughly where the photoreceptor sensitivities curves cross.
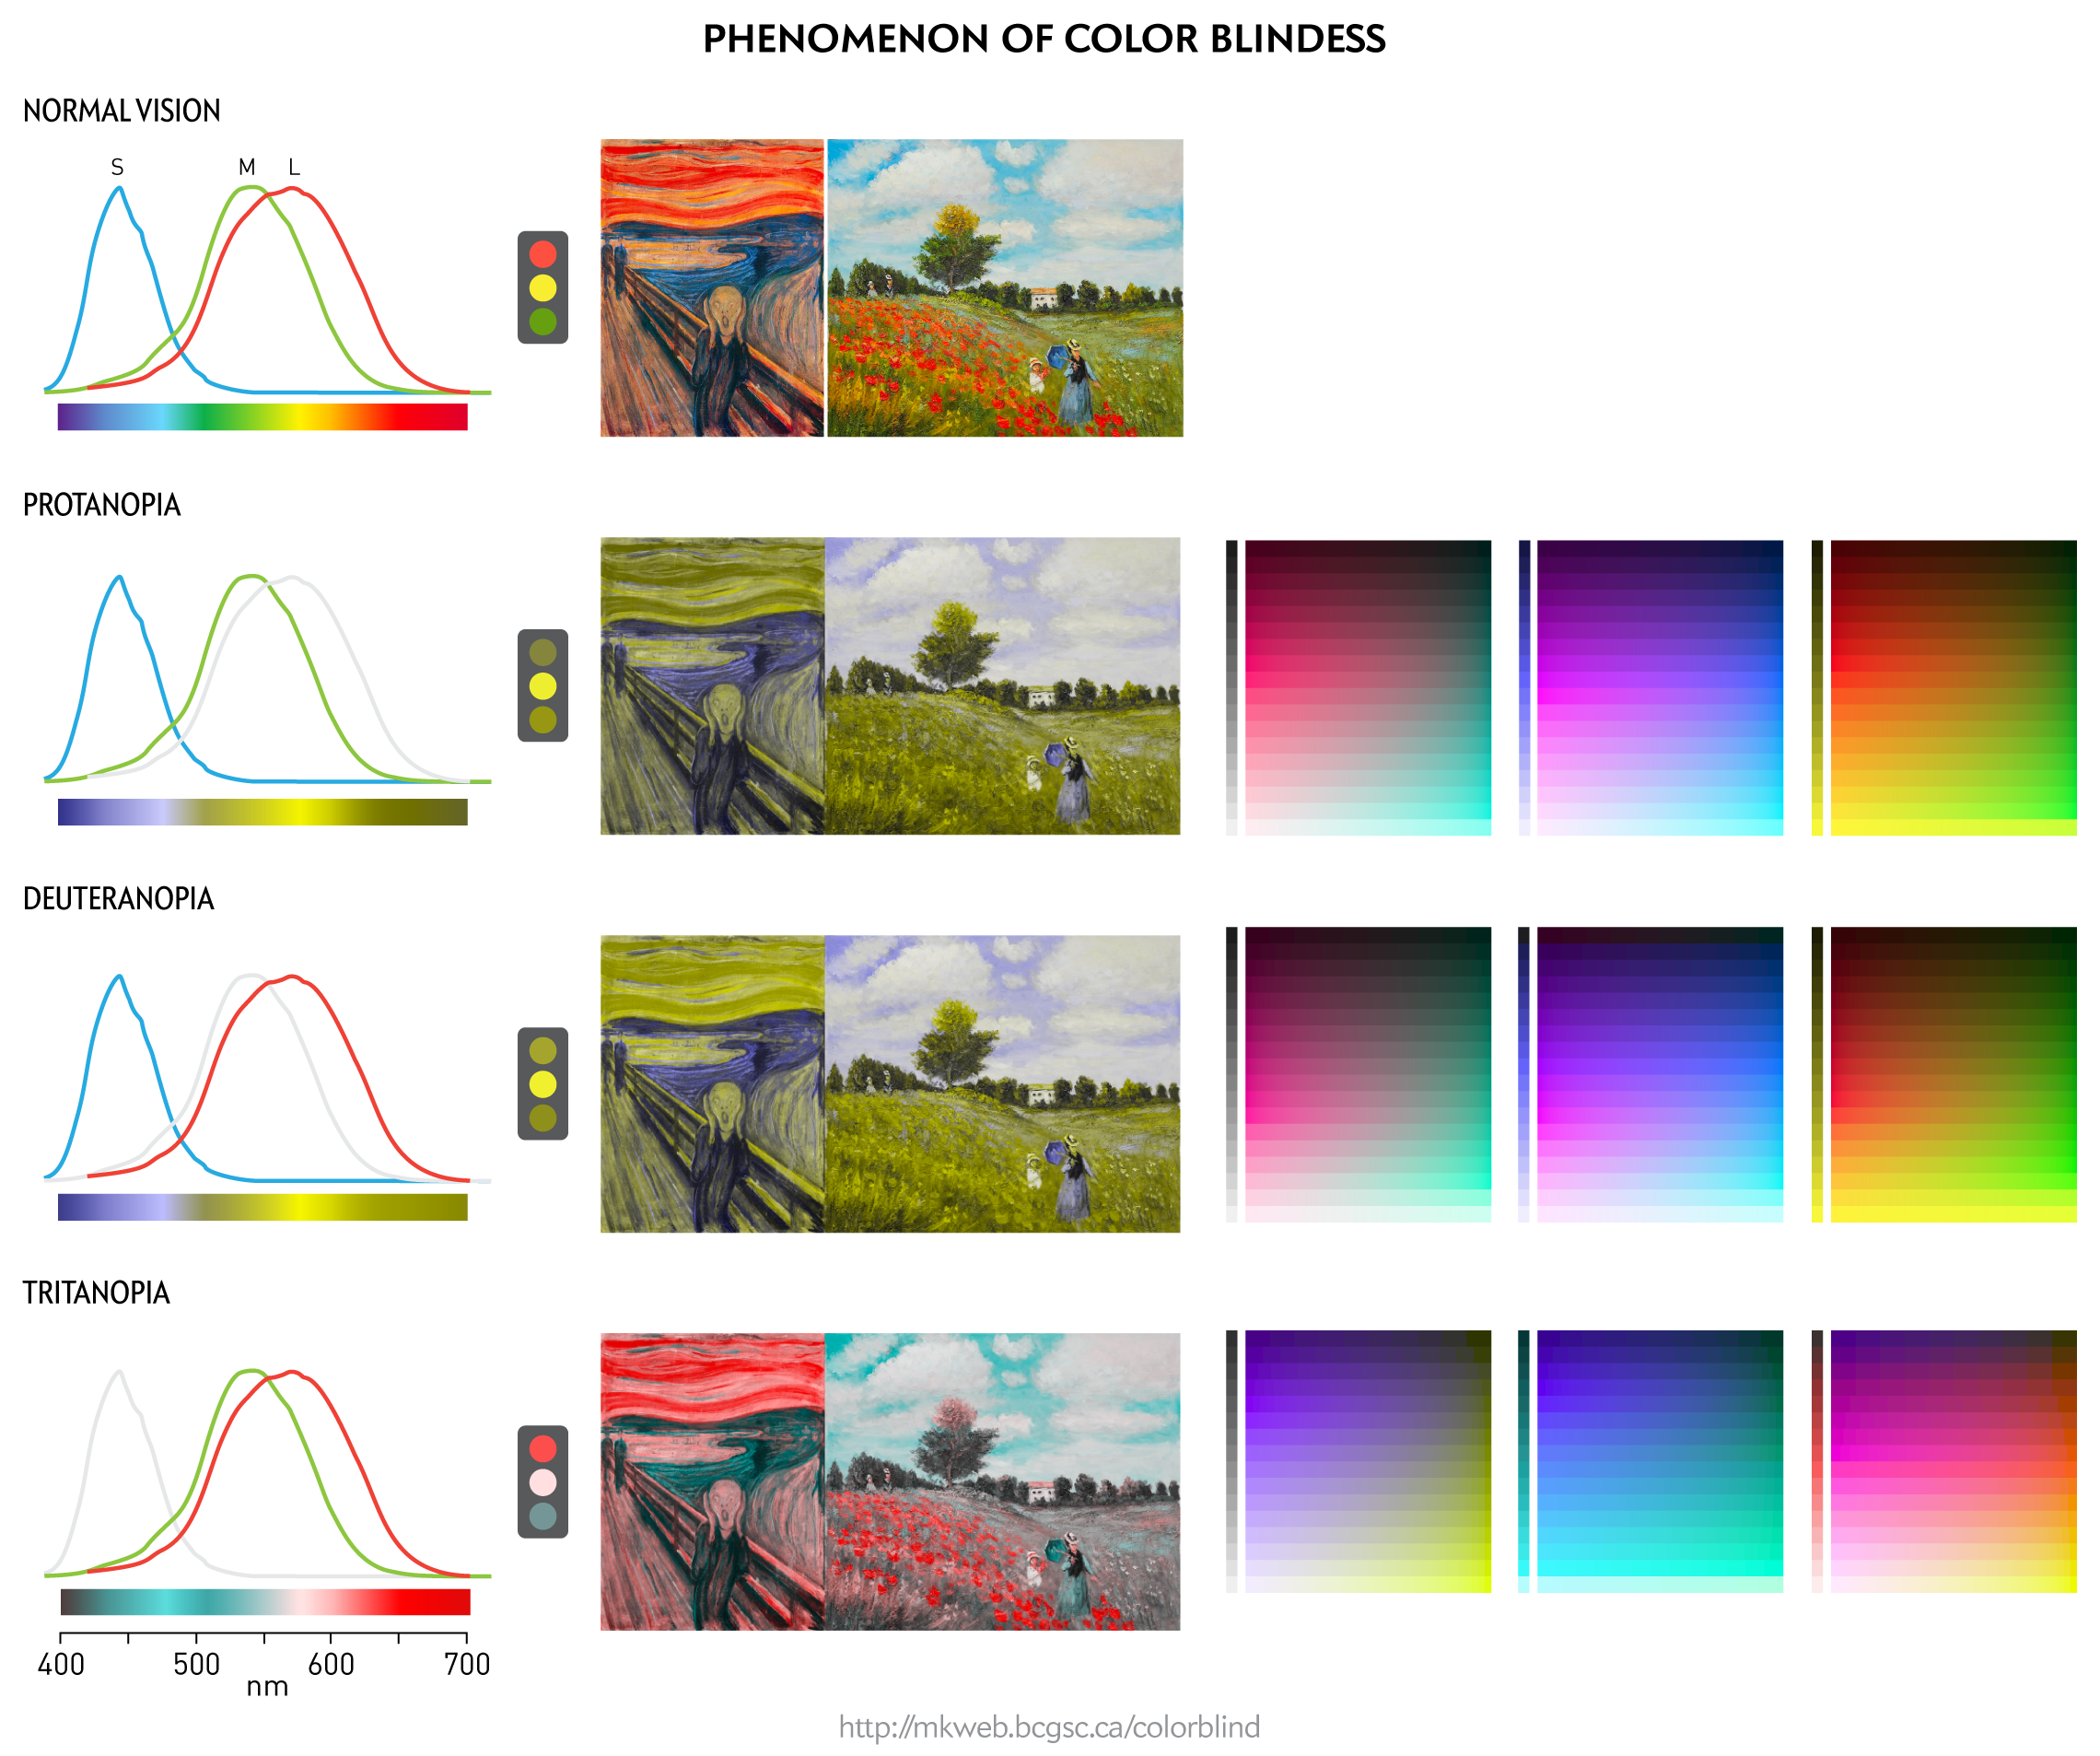
Visible light is in the range of 390–700 nm. The exact definition of the upper limit varies, with some sources giving as high as 760 nm. Shorter wavelengths are absorbed by the cornea (<295nm) and lens (315–390nm). Some near infrared light also reaches the retina (760–1,400nm).
it's all the same to me
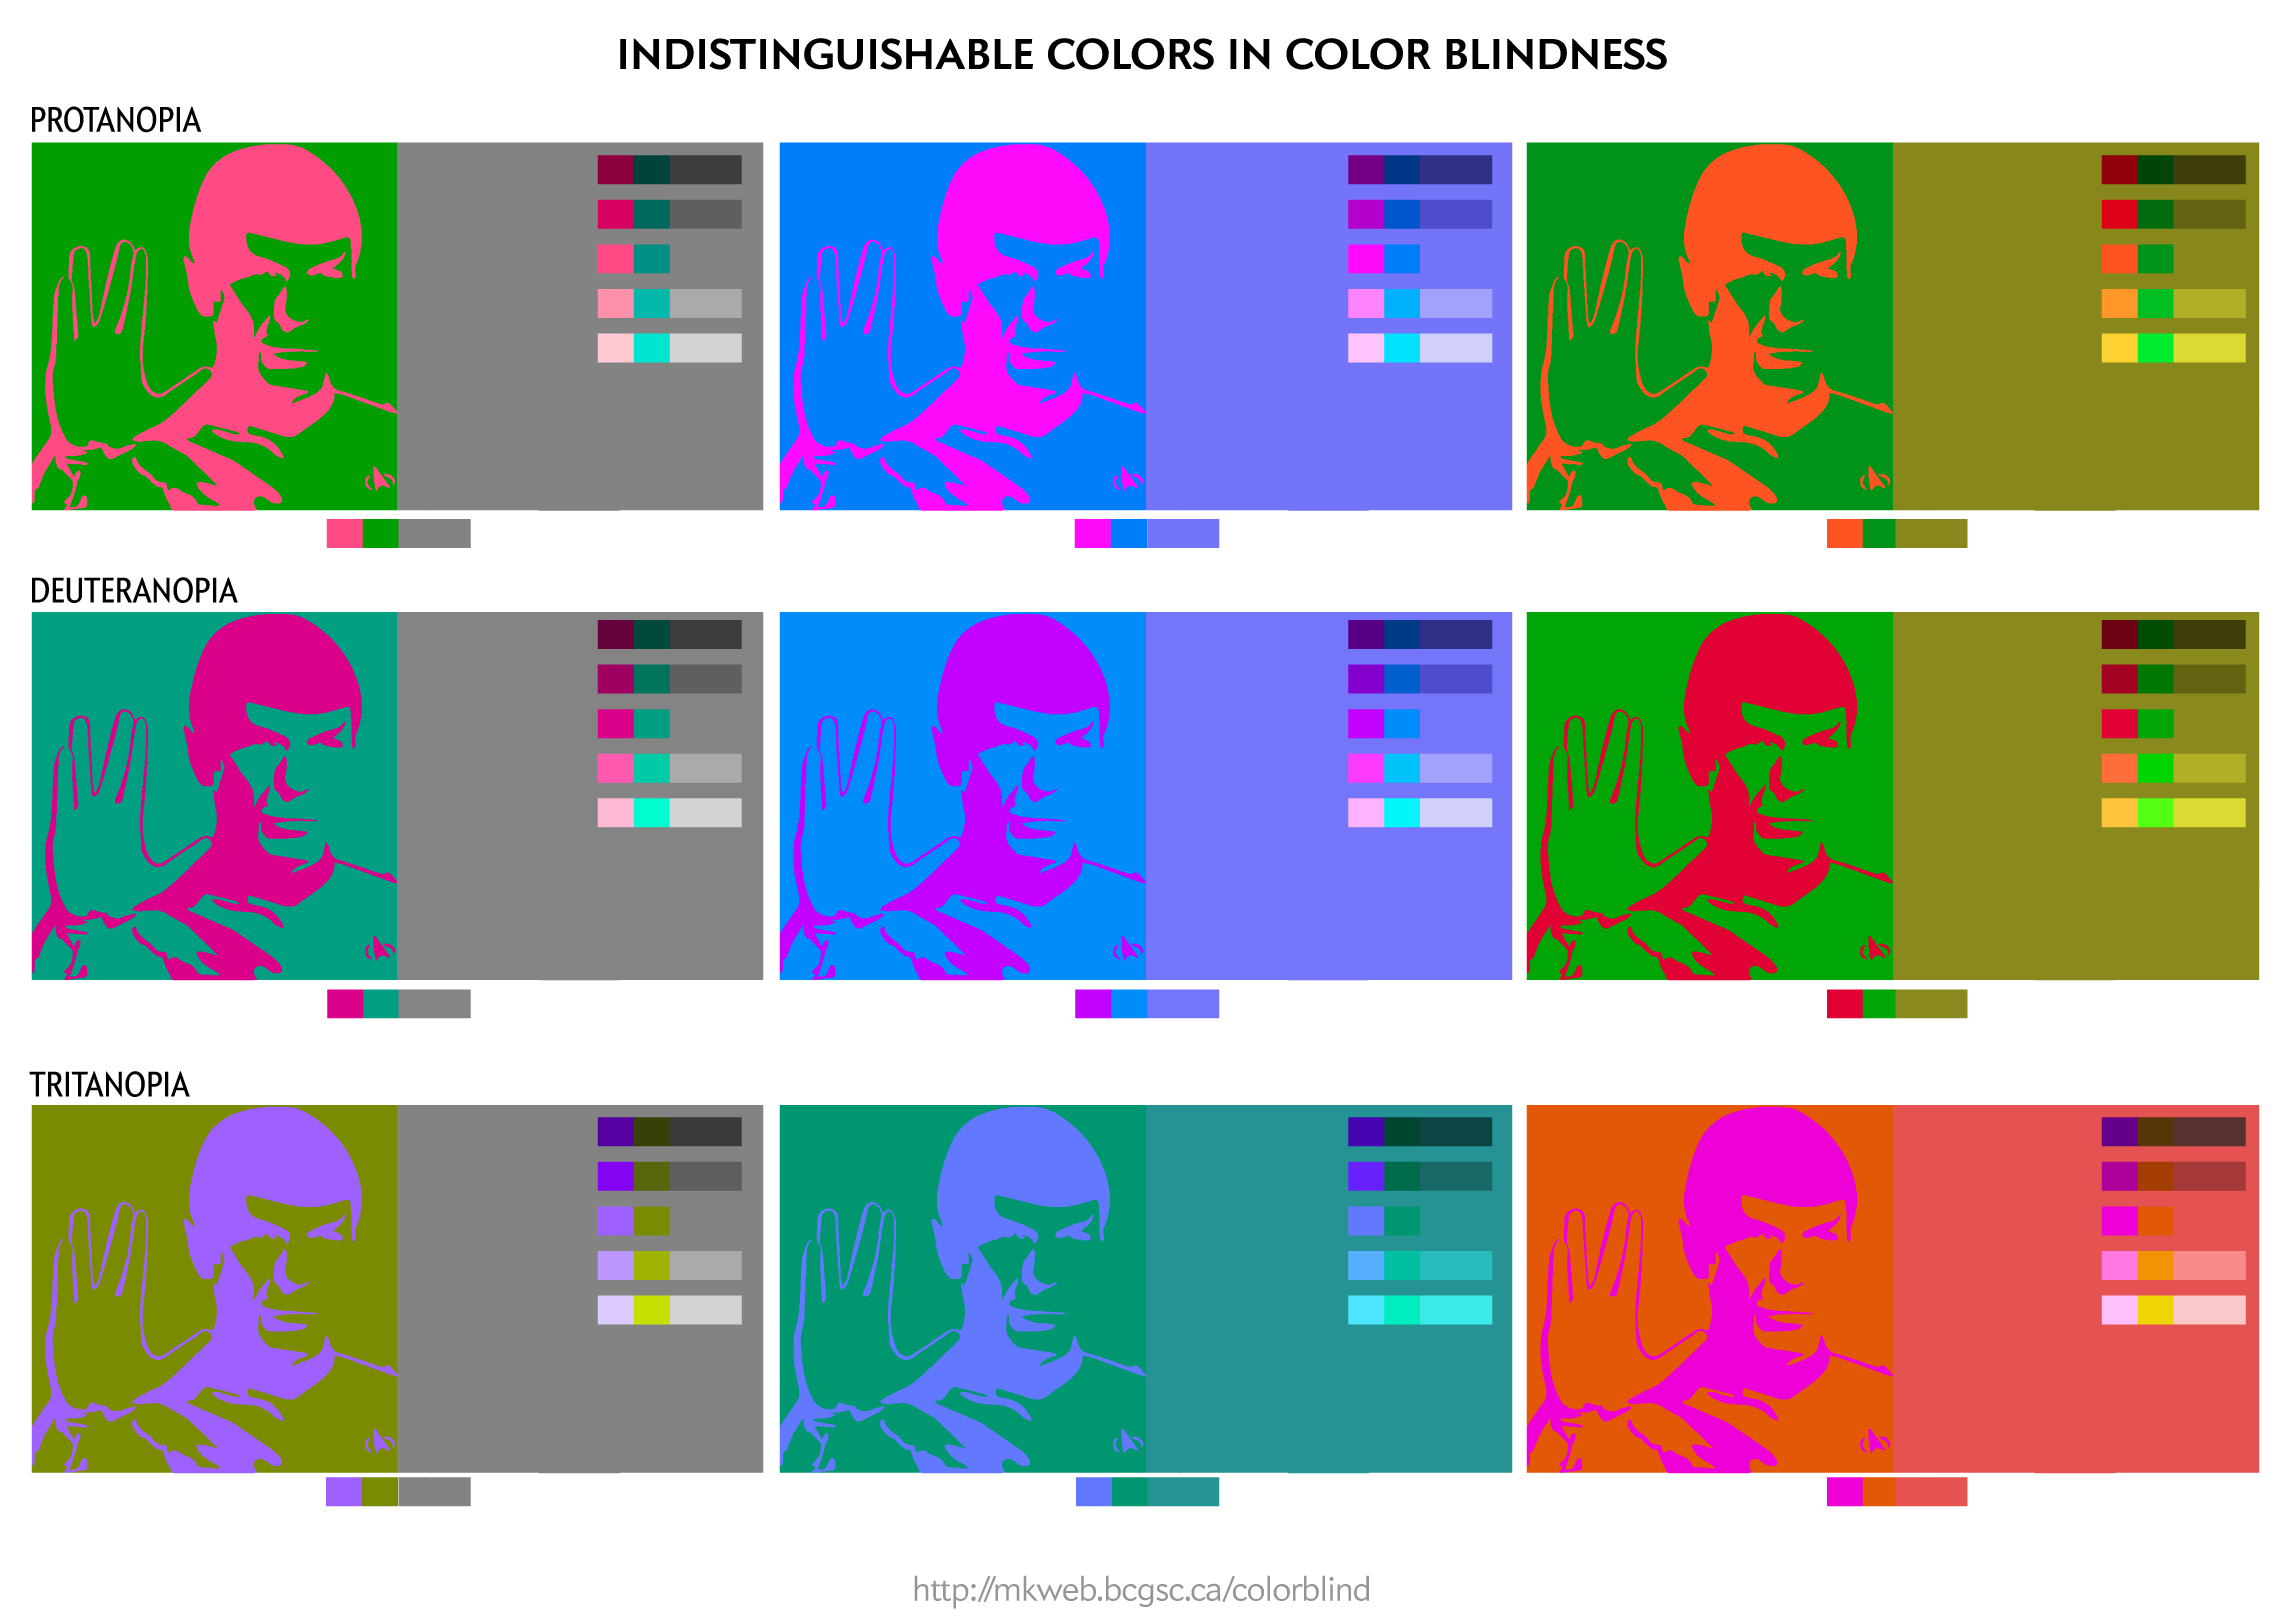
The Ishihara test is a color perception test for protanopia and deuteranopia. Think of the Rorschach test, except with a different diagnosis if you can't see a pattern.
Traditionally, the Ishihara test is performed with digits but why not use Mr. Spock4. He knows all the digits and is much more insteresting.
4In tribute to Leonard Nimoy, 1931–2015
simulating color blindness
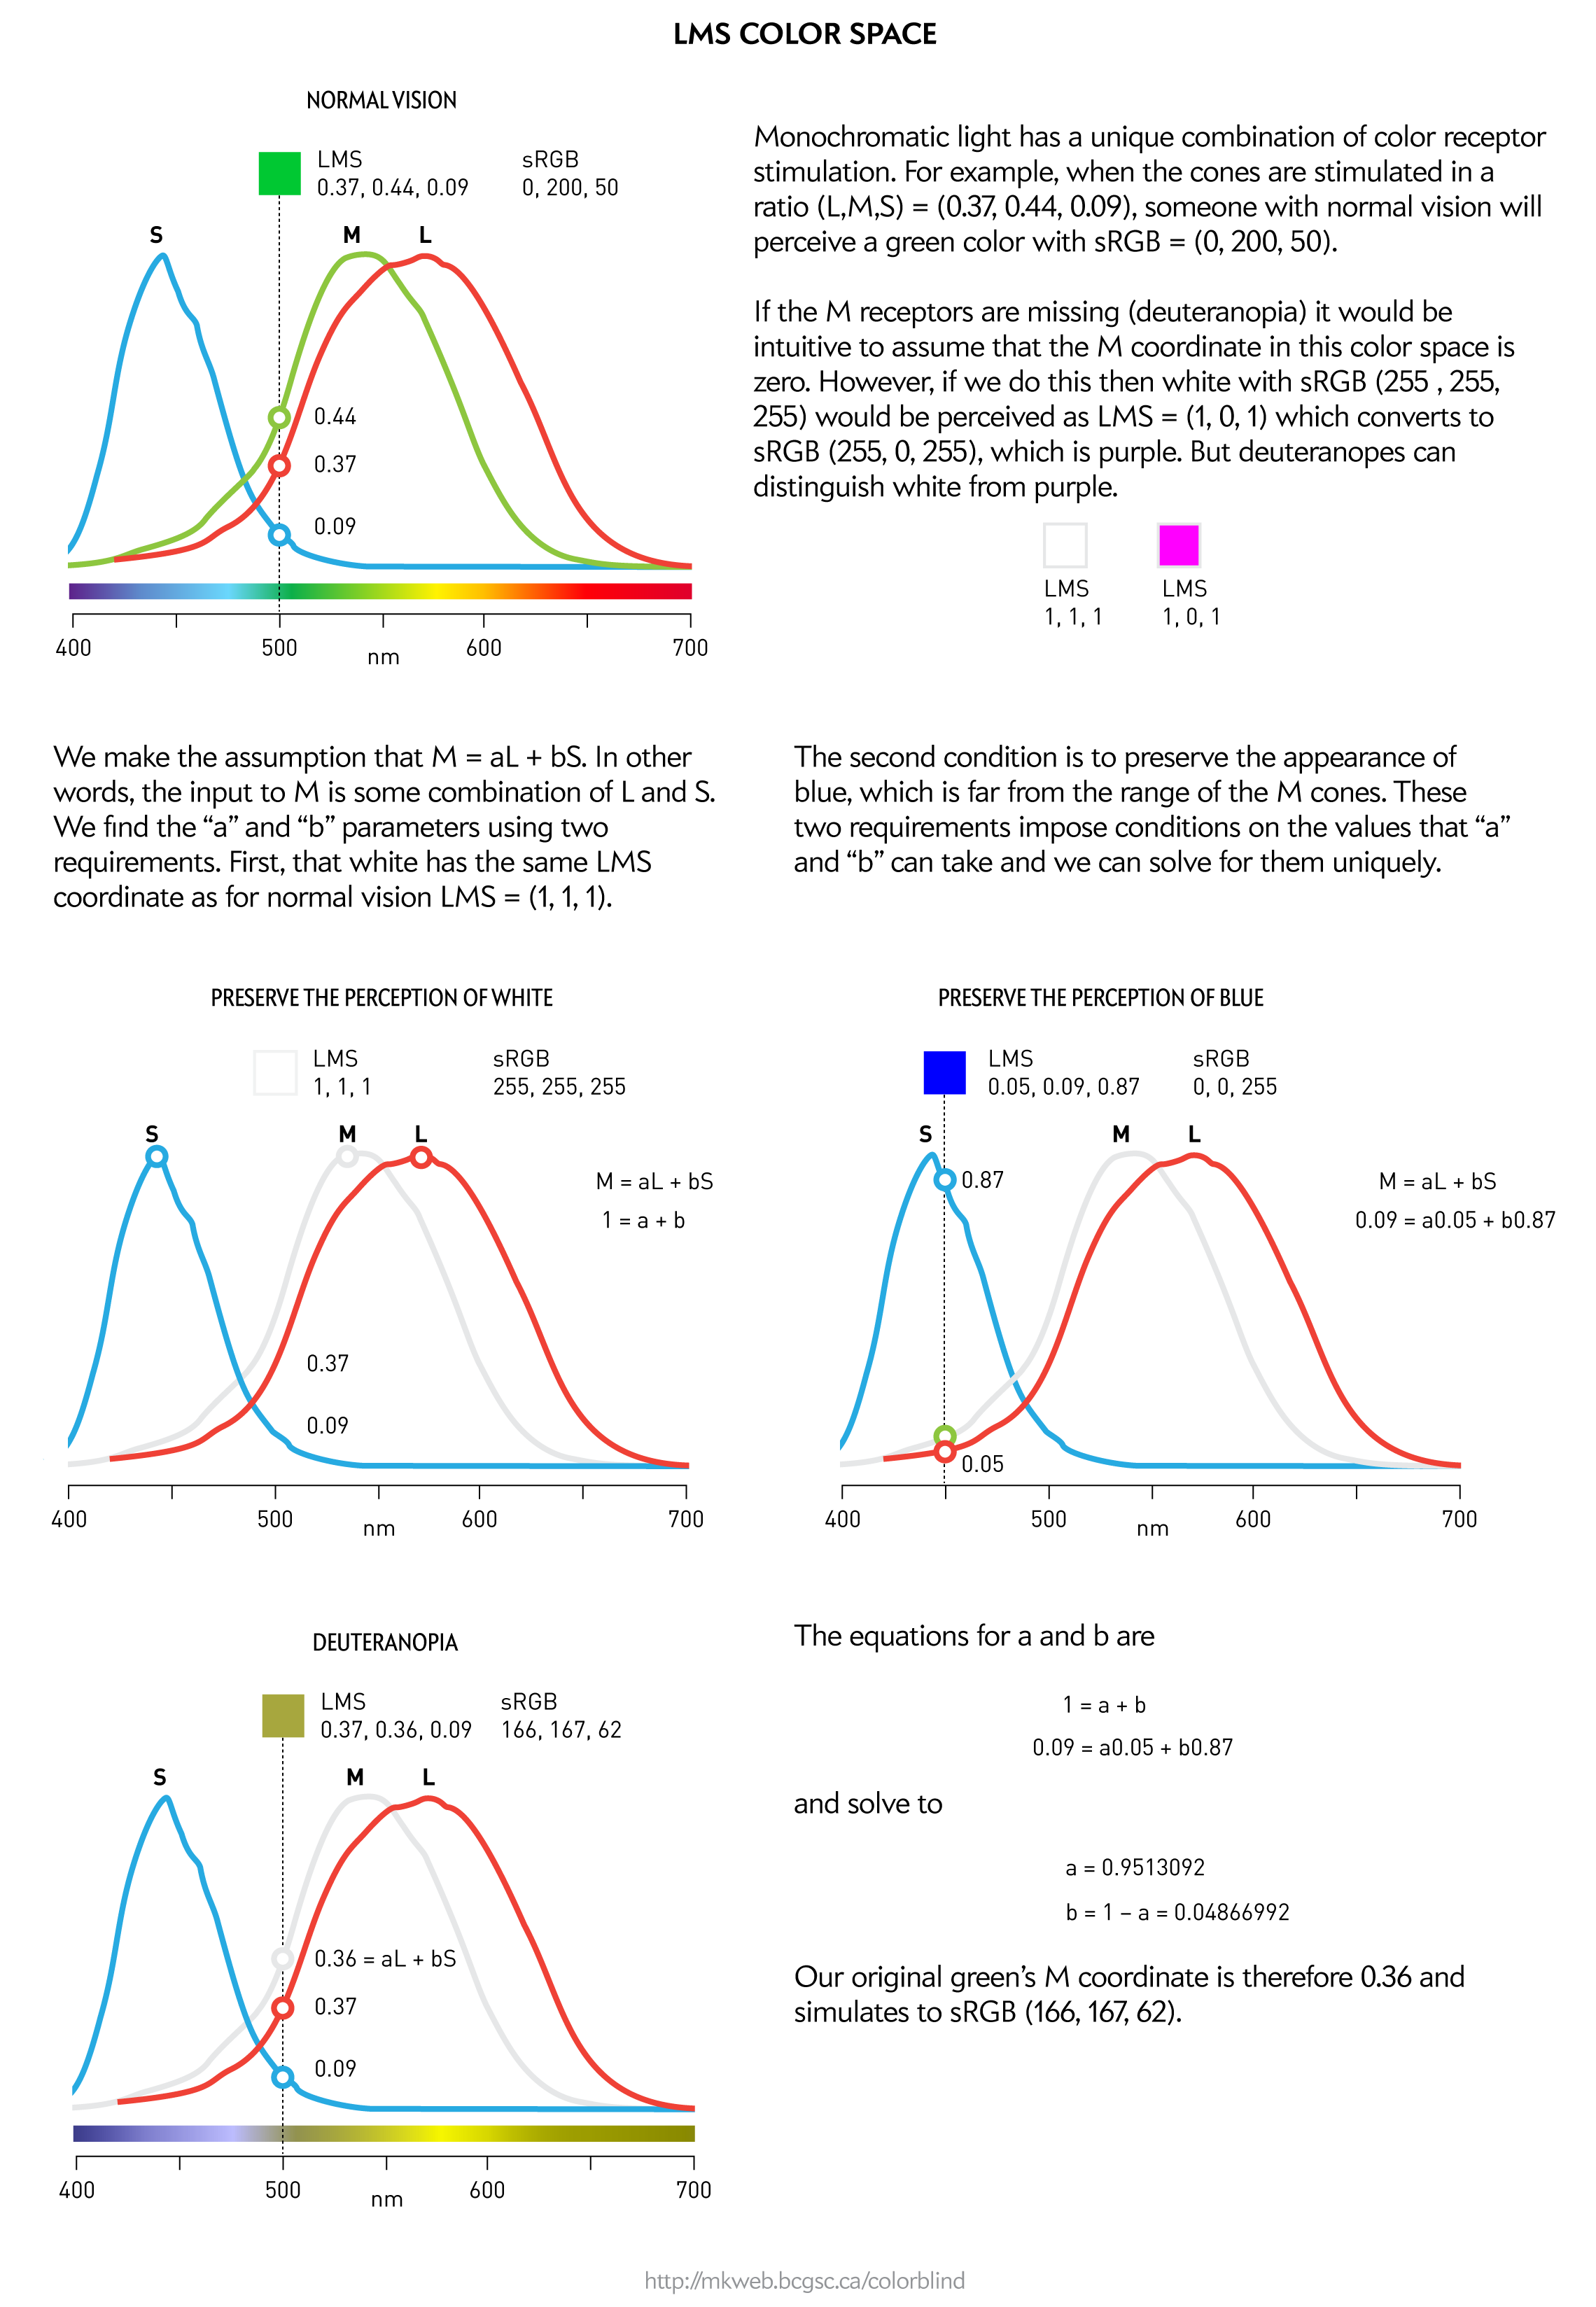
Color blindness comes in varying degrees and types. Let's consider total deuternanopia—where the M receptors are missing or completely dysfunctional. Because they only have two kinds of color receptors, someone with this condition will see only two dimensions of color.
To understand how to simulate color blindness we have to look briefly at how color can be represented. You're probaby familiar with the RGB color space—just one kind of many color spaces. The RGB coordinates of a color are a device-dependent output model—they tell a device, such as your monitor or TV how much of a pixel's red, green and blue to activate. Obviously, depending on which specific display panel we're talking about, the output color might actually look very different—it's a function of the actual phosphors and any calibration and adjustments.
It turns out that we can also specify color in terms of coordinates in a space based on the physiological response of the eye to the color. Since a normal eye has three photoreceptors whose sensitivity is centered on short (S), medium (M) and long (L) wavelengths, any given color (i.e. monochromatic light) creates a unique combination of S, M and L cone response.
Using a color's LMS coordinates we can simulate color blindness by modifying the coordinate that corresponds to the missing photoreceptor under the observations that (a) deuteranopes, for example, can distinguish white and greys from blues and greens and (b) colors for which the sensitivity of the missing photoreceptors is low should be perceived normally.
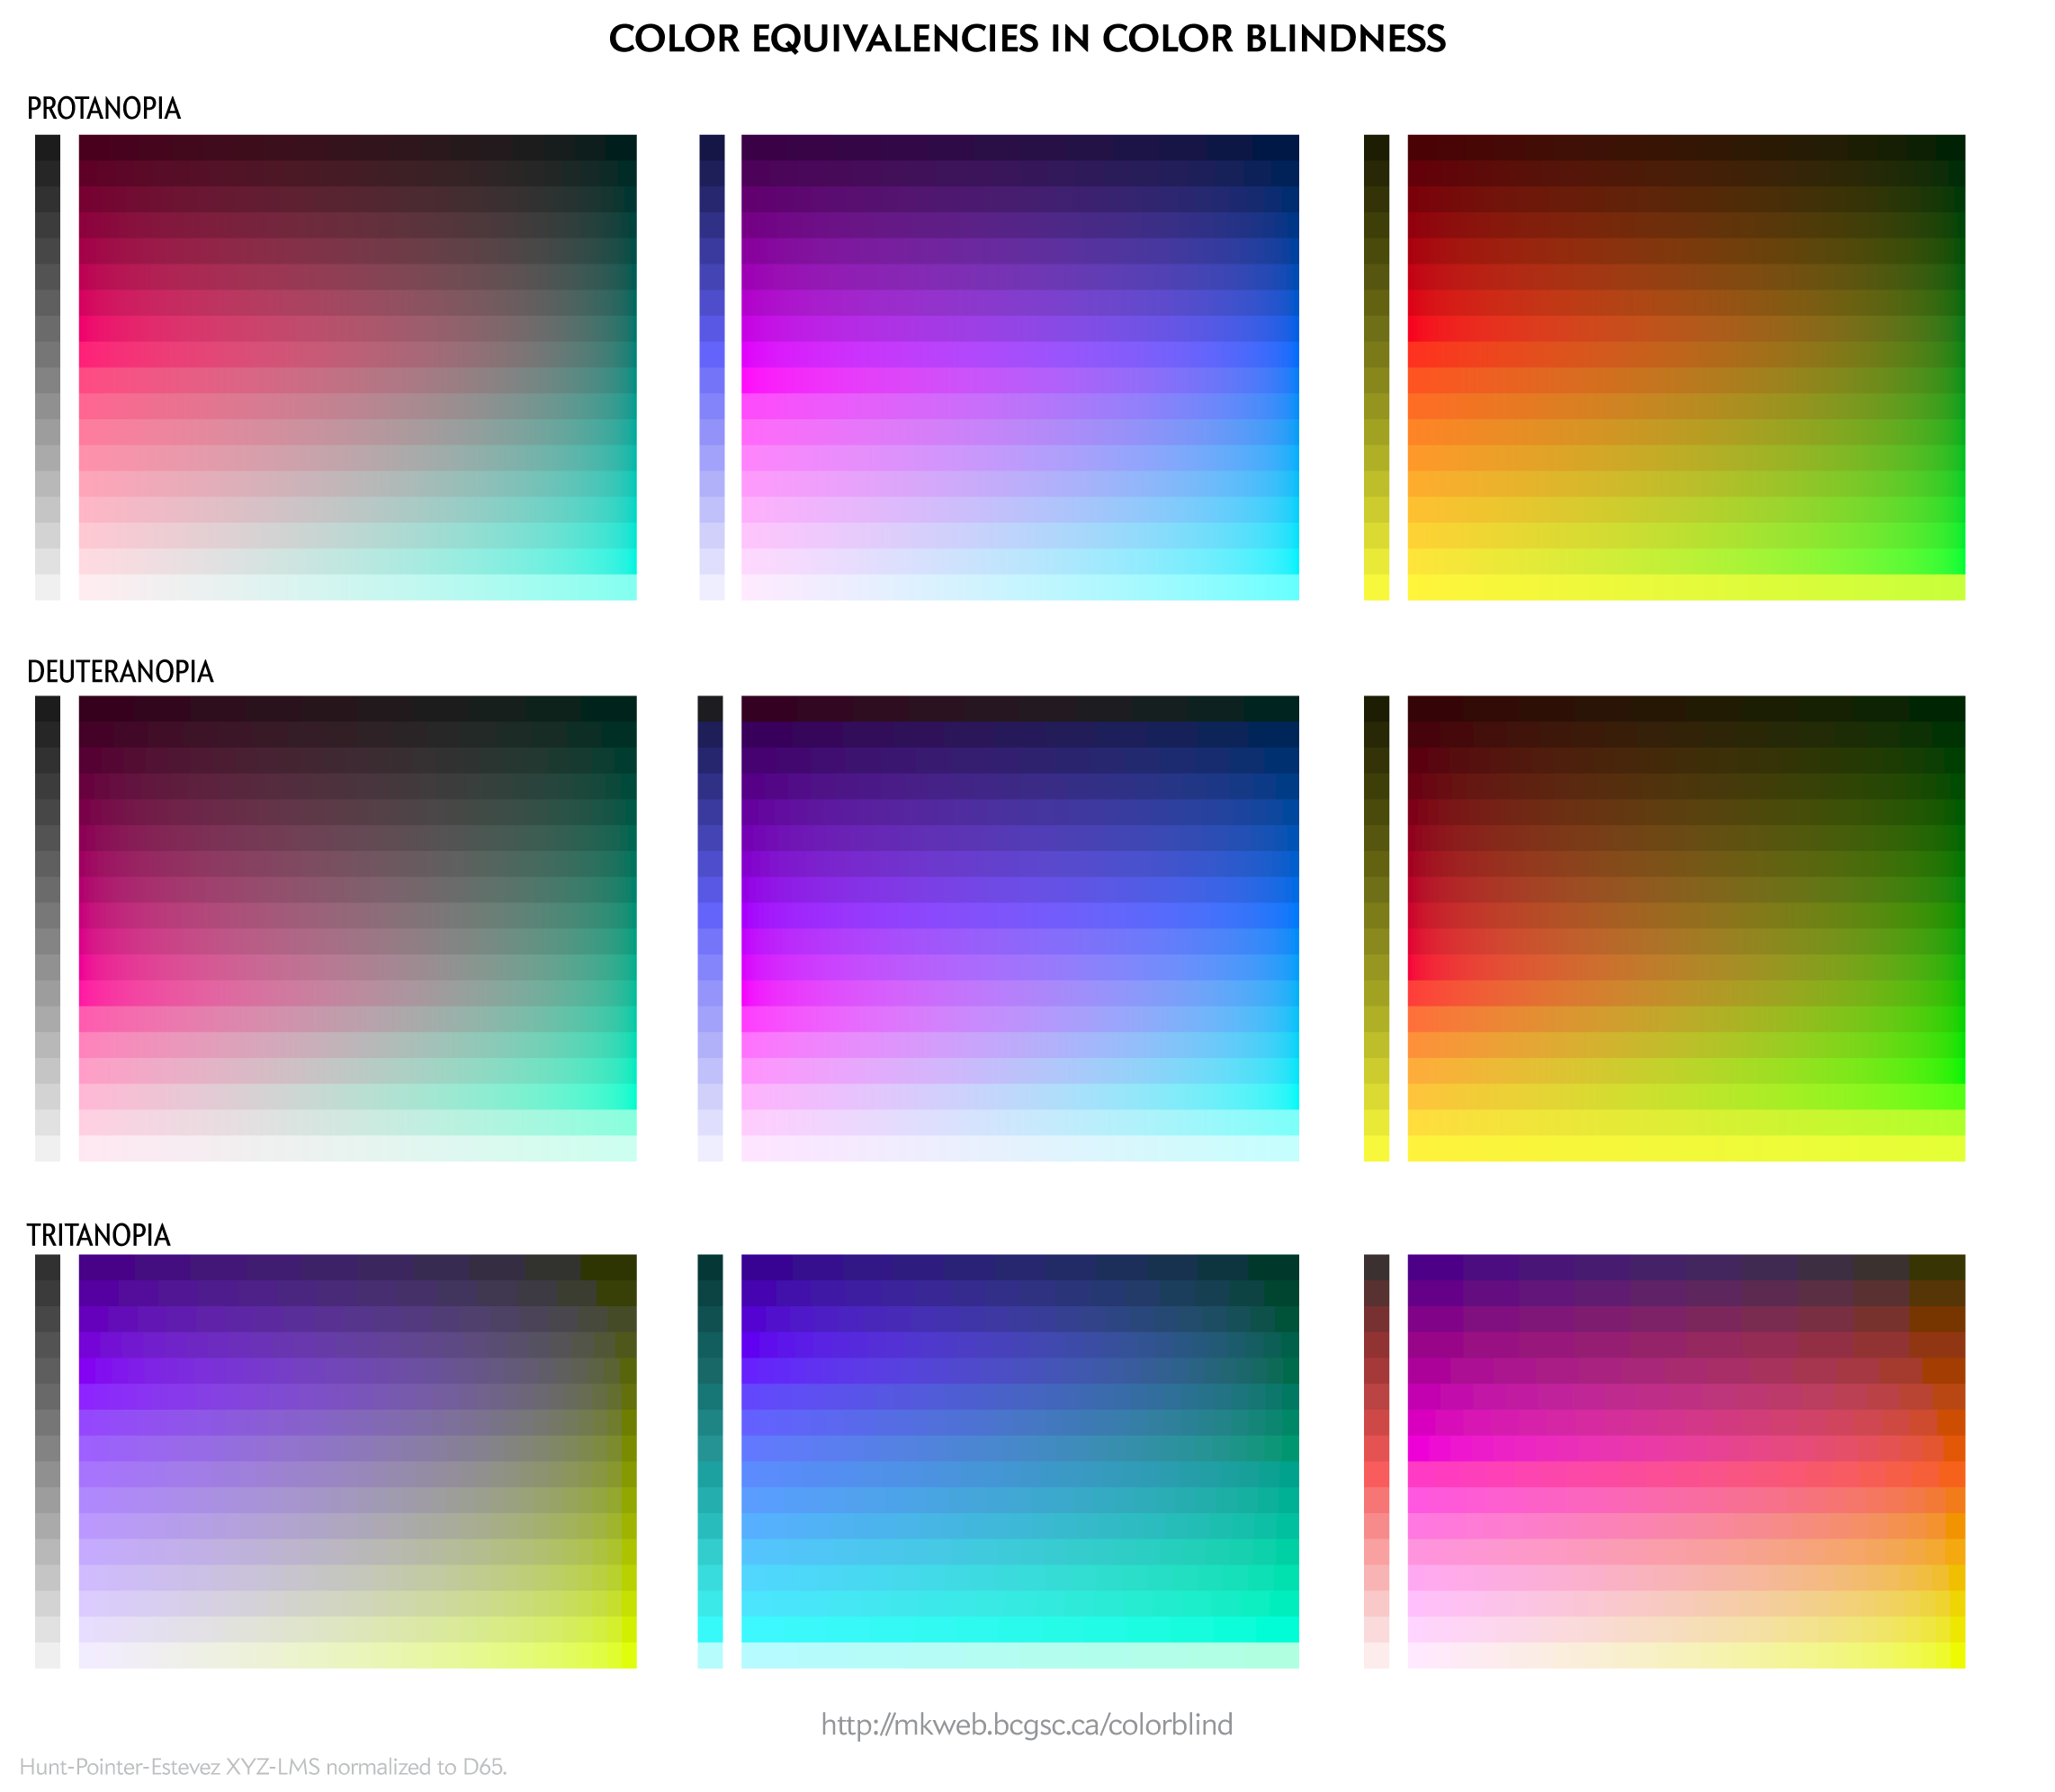
Because color blindess reduces the number of color dimensions, a large number of colors distinguishable to people with normal vision appear the same to someone with color blidness. The ramps below show these families of equivalent colors.
super color vision
The opposite condition to color blindness exists too—tetrachromacy. In this case, an individual has an extra type of color receptor which improves discrimination in the red part of the spectrum. While the anatomy of their retina can be described, how true tetrachromats subjectively perceive color is unknown. And, perhaps, even unknowable.
Tetrachromacy is common in other animals, such as fish (e.g. goldfish, zebrafish) and birds (e.g. finch, starling). The dimensionality of the perceived color space isn't necessarily proportional to the number of different receptors. If the signal from 3 color receptors are combined by the brain and each processor has a weighted response to a broad range of wavelengths, then a color can be modeled by a point in 3-dimensional space, in which the receptors are the axes. This system can perceive a large number of colors.
In the extreme case where the receptors respond to a very narrow range, of which none overlap with the other, a color is one of three points in a 1-dimensional space. This sytem can perceive only 3 colors.
For example, although the mantis shrimp has 12 different color receptors, the receptors work independently, their color discrimination is poorer than ours.
Propensity score weighting
It is not certain that everything is uncertain. —Blaise Pascal
We have already explored how we can mitigate bias caused by confounding variables in observational studies using propensity score (PS) matching (PSM) and propensity score weighting (PSW). However, any statistical model is only as good as its assumptions and, if it is specified incorrectly, it can itself produce biased estimates of the treatment effect.

This month, we explore double robustness, a powerful statistical concept that provides a valuable “safety net” against the risk of an incorrect model. It offers two opportunities, instead of just one, to obtain a valid estimate of the treatment effect — making it possible to draw credible causal inferences from observational data without having to depend on a single set of modeling assumptions.
Kurz, C.F., Krzywinski, M. & Altman, N. (2026) Points of significance: Double Robustness. Nat. Methods 23:868–869.
Nature Biotechnology cover
My cover design on the 7 April 2026 Nature Biotechnology issue shows the dendrogram that represents a cluster of uniquely expressed (or downregulated) genes in human naive stem cells induced from such cells. Within each dendrogram block, the genomic barcode sequence (sampled from Supplementary Table 1) is depicted with a Code 39 barcode. The highlighted barcode is one of those used for cell isolation.
Ishiguro S. et al. A multi-kingdom genetic barcoding system for precise clone isolation (2026) Nature Biotechnology 44:616–629.

Browse my gallery of cover designs.

Happy 2026 π Day—
Art for the 5%
Celebrate π Day (March 14th) and enjoy the art — but only if you're part of the 5%.
Go ahead, see what you can't see.

Ishihara's Tests for Colour Deficiency
Authentic and accurate images of Ishihara's test plates photographed (and lovingly color-corrected) from the 38-plate Ishihara's Tests for Colour Deficiency.
I also provide the position, size, and color of each circle on each test plate.


Symmetric alternatives to the ordinary least squares regression
What immortal hand or eye, could frame thy fearful symmetry? — William Blake, "The Tyger"
This month, we look at symmetric regression, which, unlike simple linear regression, it is reversible — remaining unaltered when the variables are swapped.
Simple linear regression can summarize the linear relationship between two variables `X` and `Y` — for example, when `Y` is considered the response (dependent) and `X` the predictor (independent) variable.
However, there are times when we are not interested (or able) to distinguish between dependent and independent variables — either because they have the same importance or the same role. This is where symmetric regression can help.

Luca Greco, George Luta, Martin Krzywinski & Naomi Altman (2025) Points of significance: Symmetric alternatives to the ordinary least squares regression. Nat. Methods 22:1610–1612.