Visions of Type
contents
- 1 · A font to test your eyes
- 2 · Optotypes
- 3 · Snellen chart design
- 4 · Snellen optotype font
- 5 · Classic and modern eyechart posters
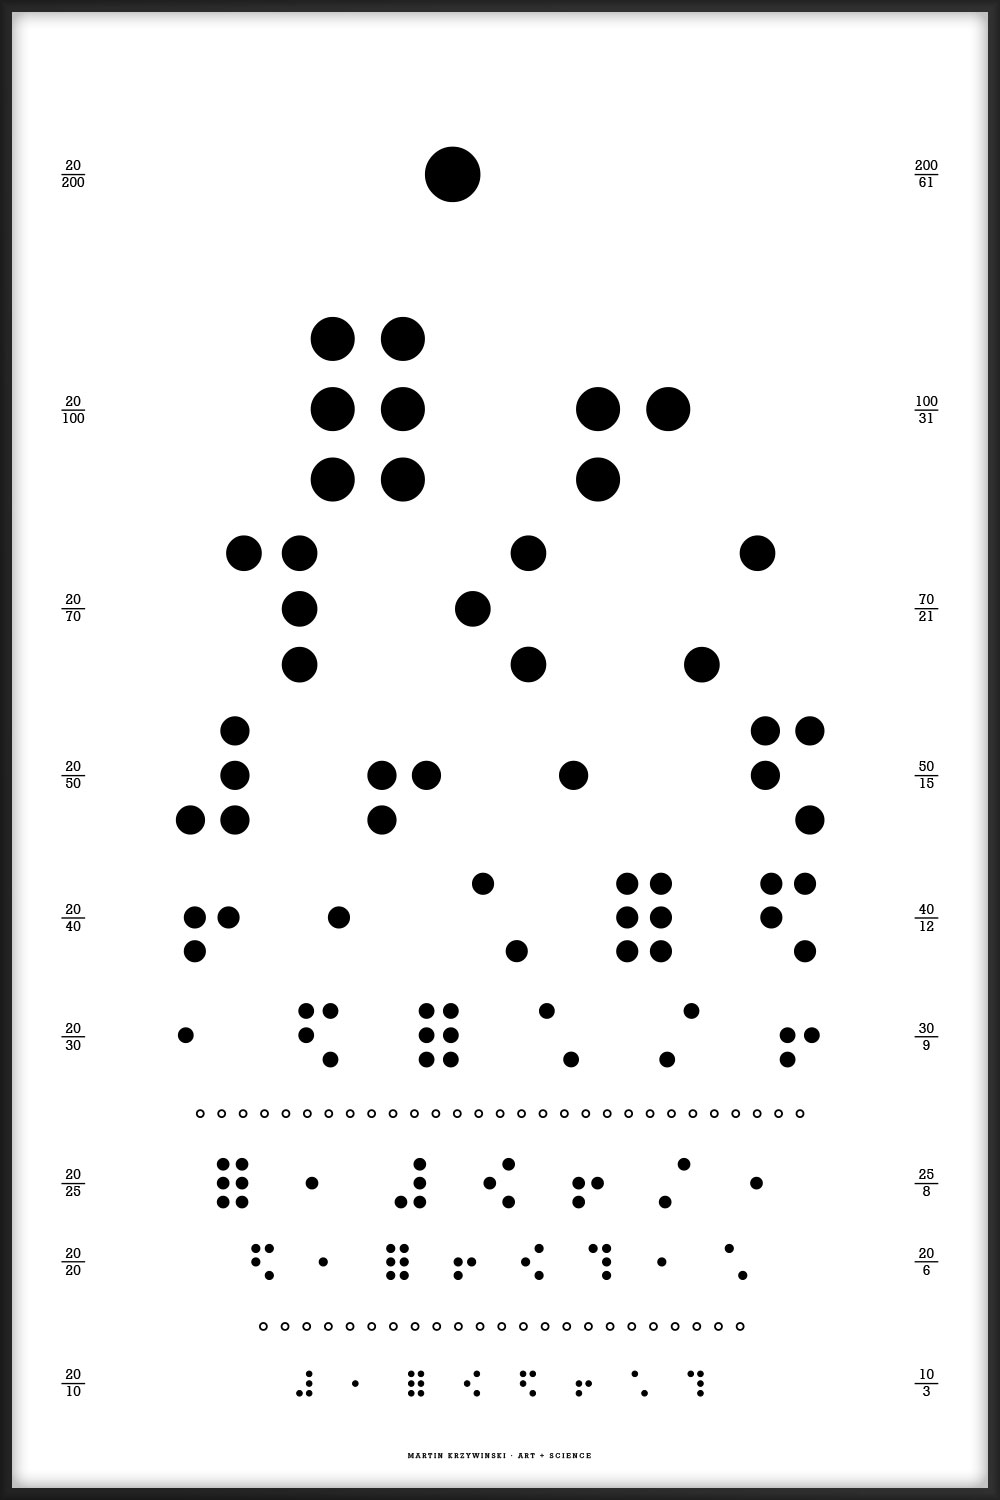
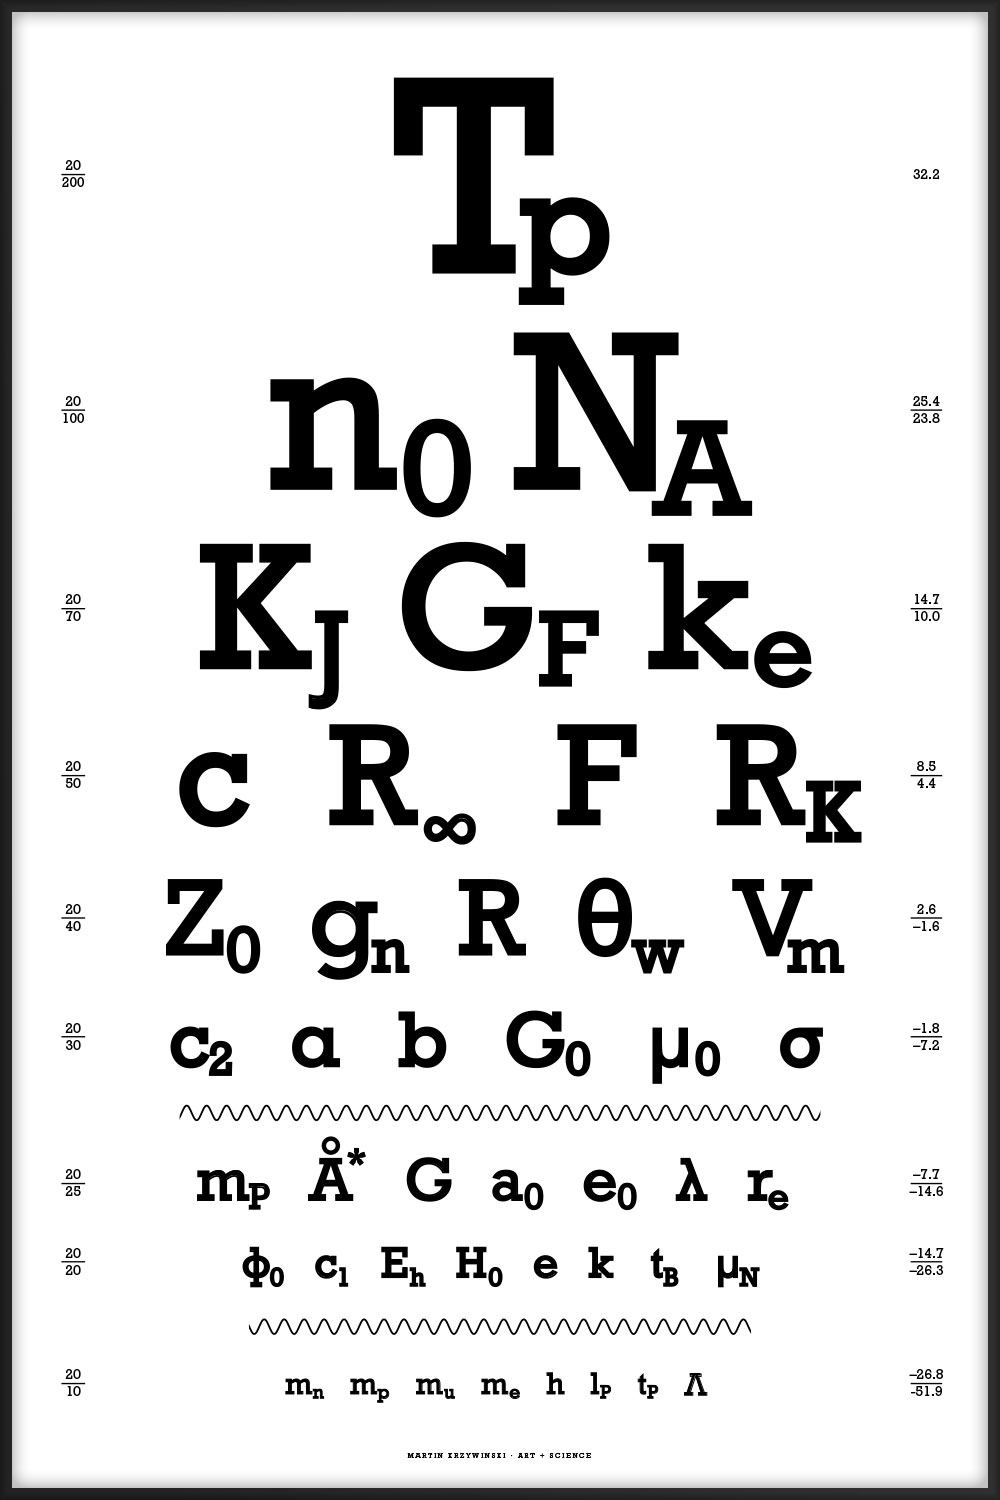
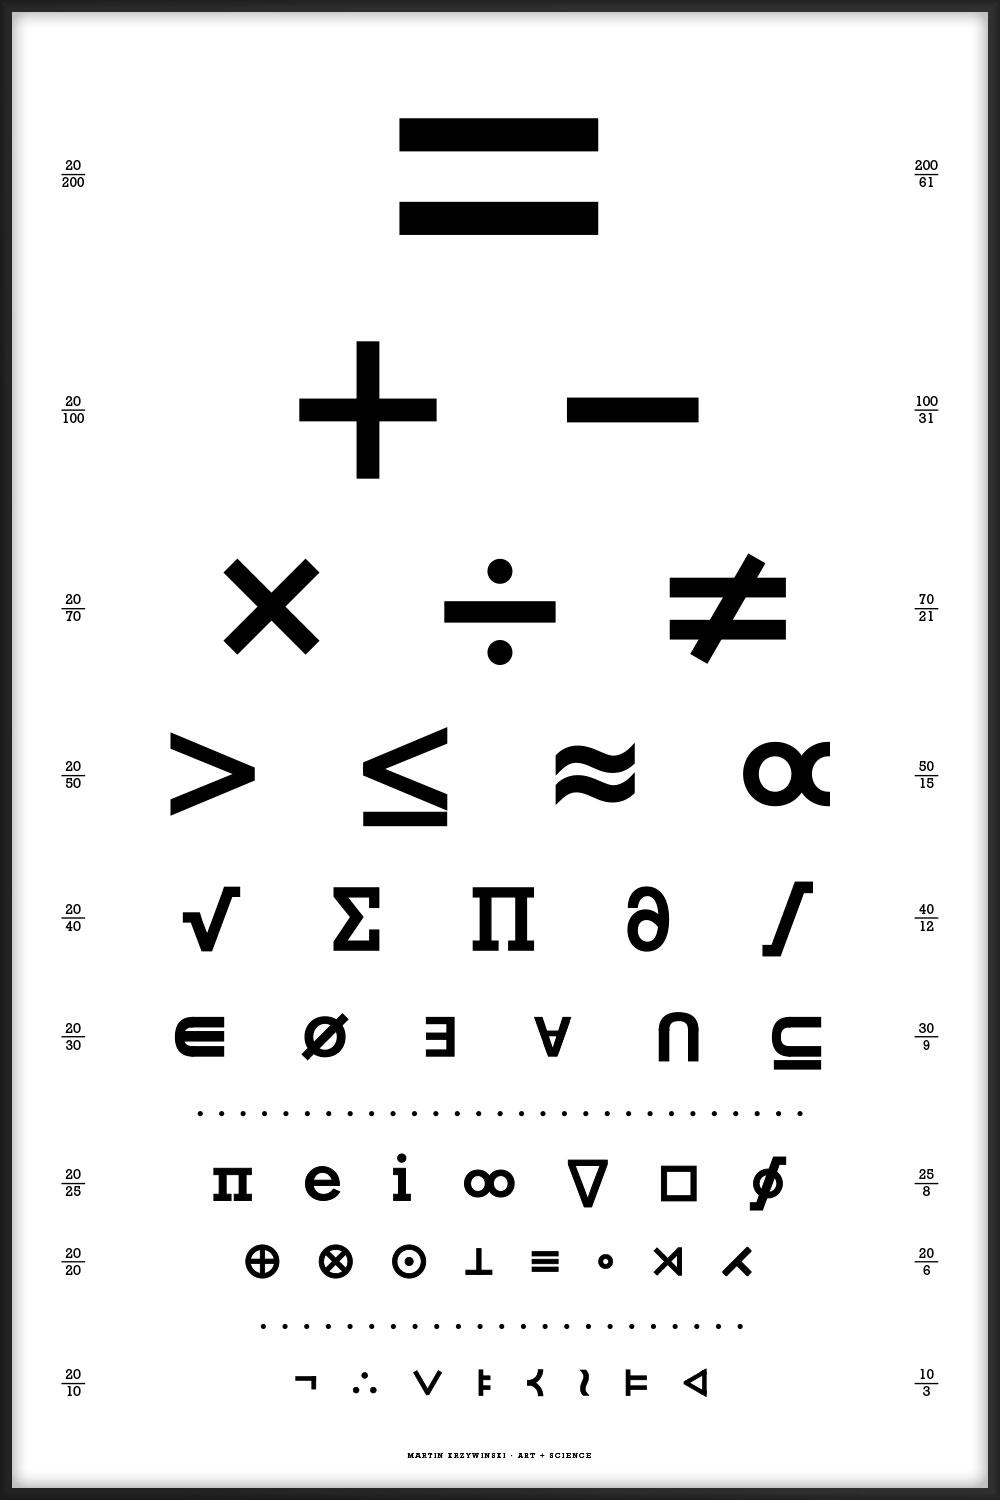
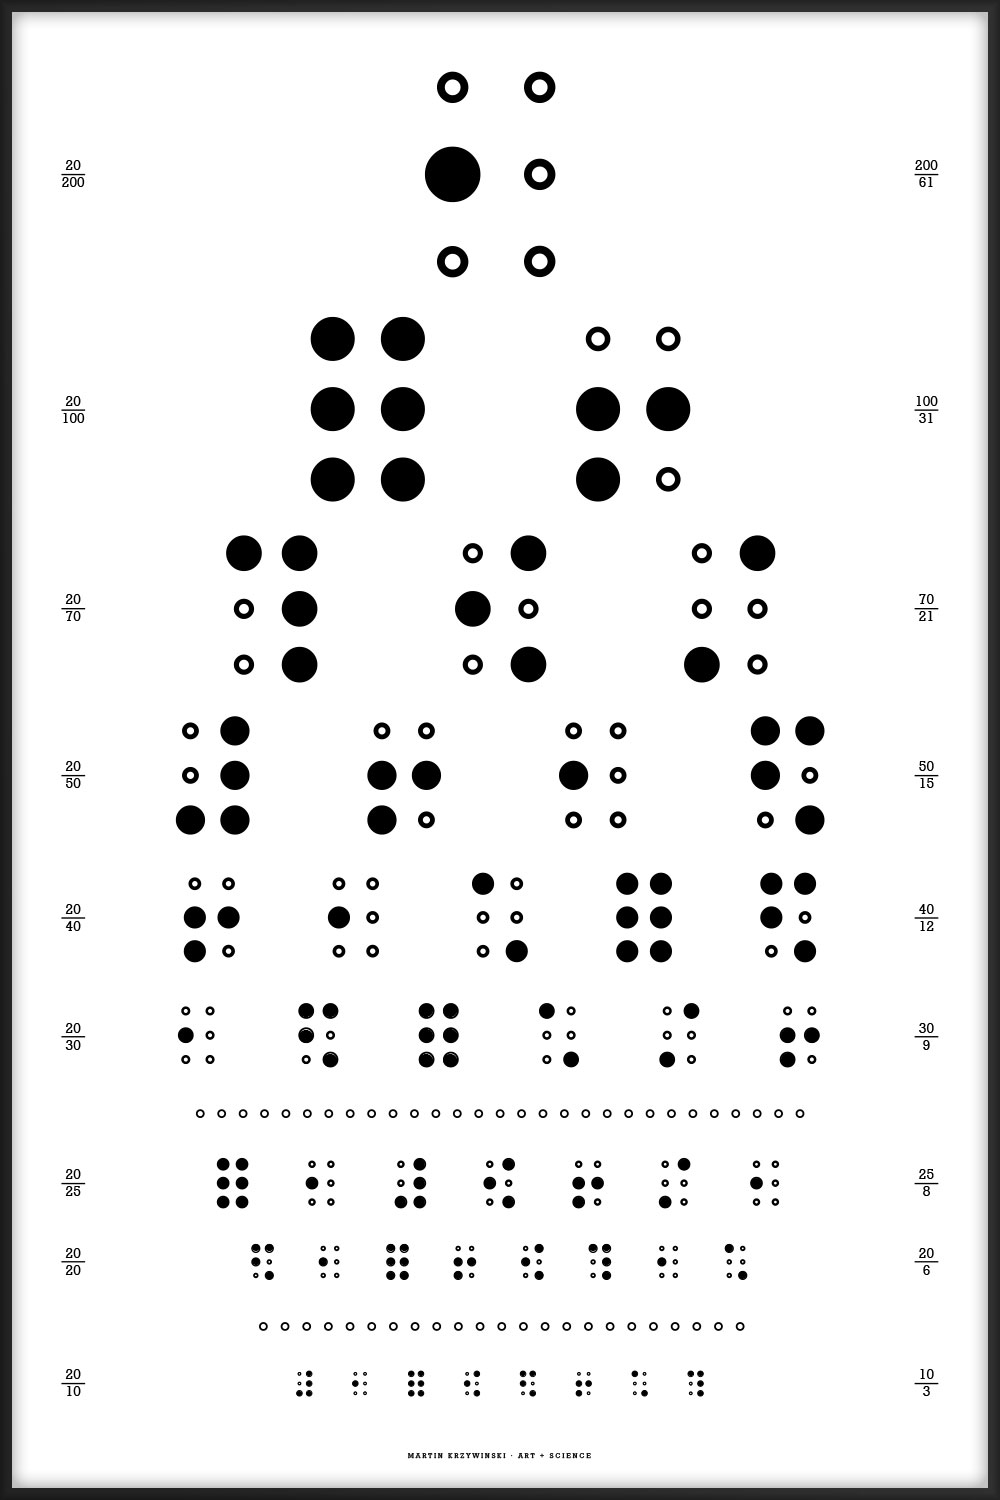
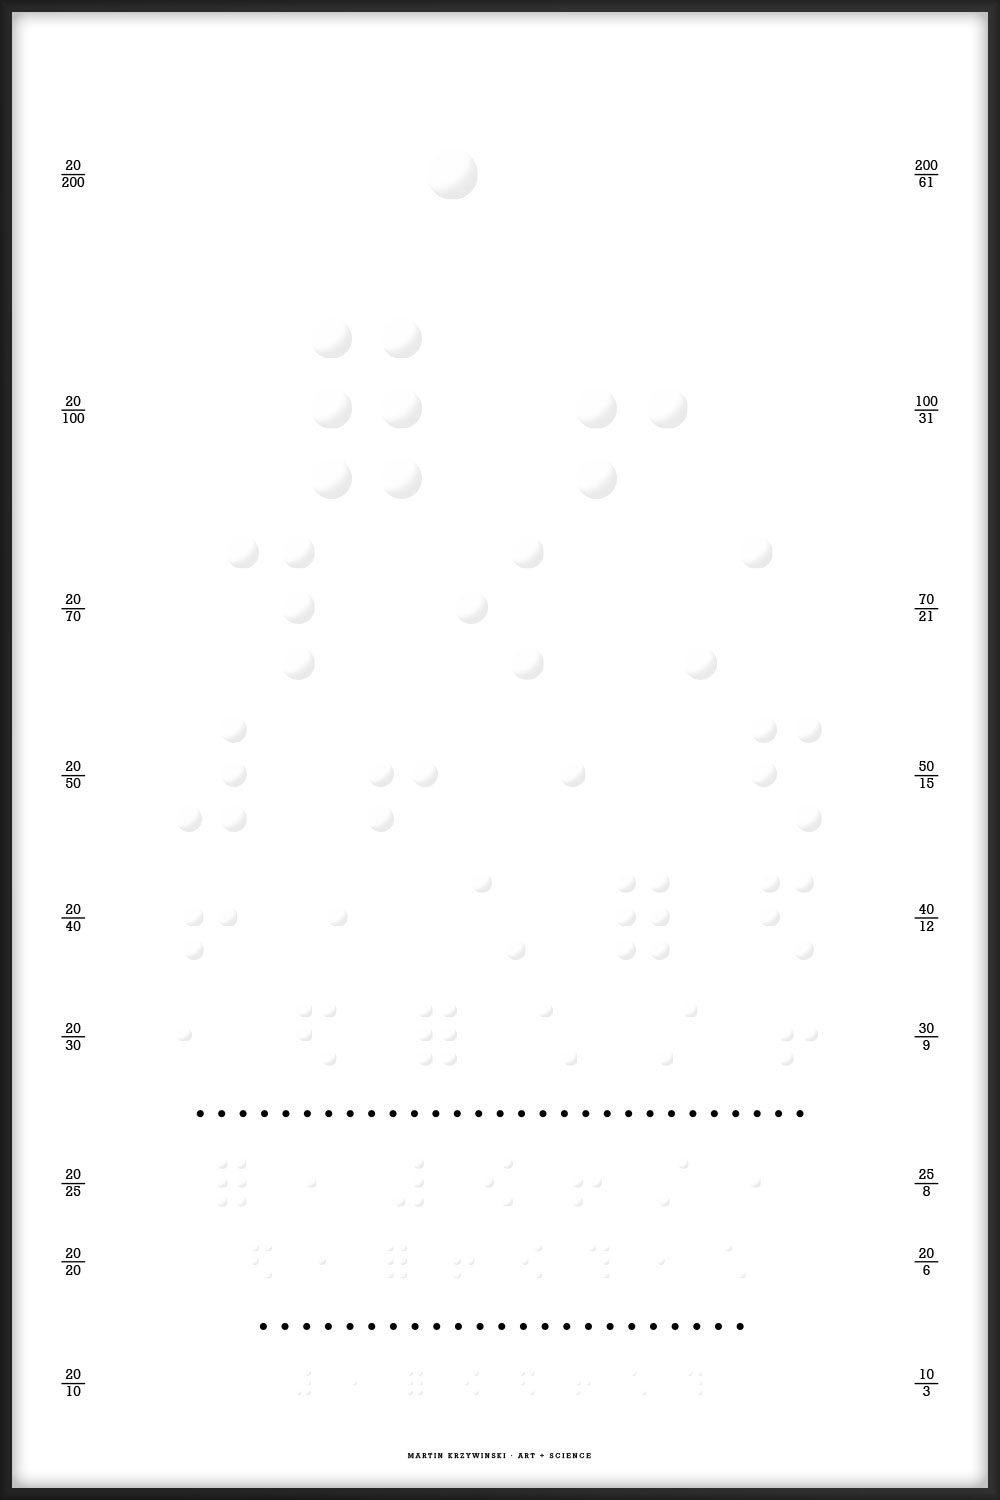
These typographical posters are designed after the style of the Snellen Chart, which is one of the kinds of eye charts used to measure visual acuity.
If you love looking, seeing and the universe, these posters are for you. They are available for purchase.
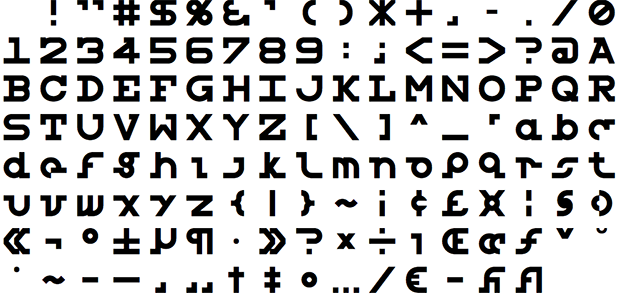
Symbols on such charts are known as optotypes. Fonts by Andrew Howlett exist whose glyphs conform to the properties of optotypes: Snellen font and Sloan font. However, some of the characters in the Snellen font file are a little oddly shaped—I provide my redesign of the Snellen font in which the glyphs are more consistent (see below). Lowercase characters are not available.
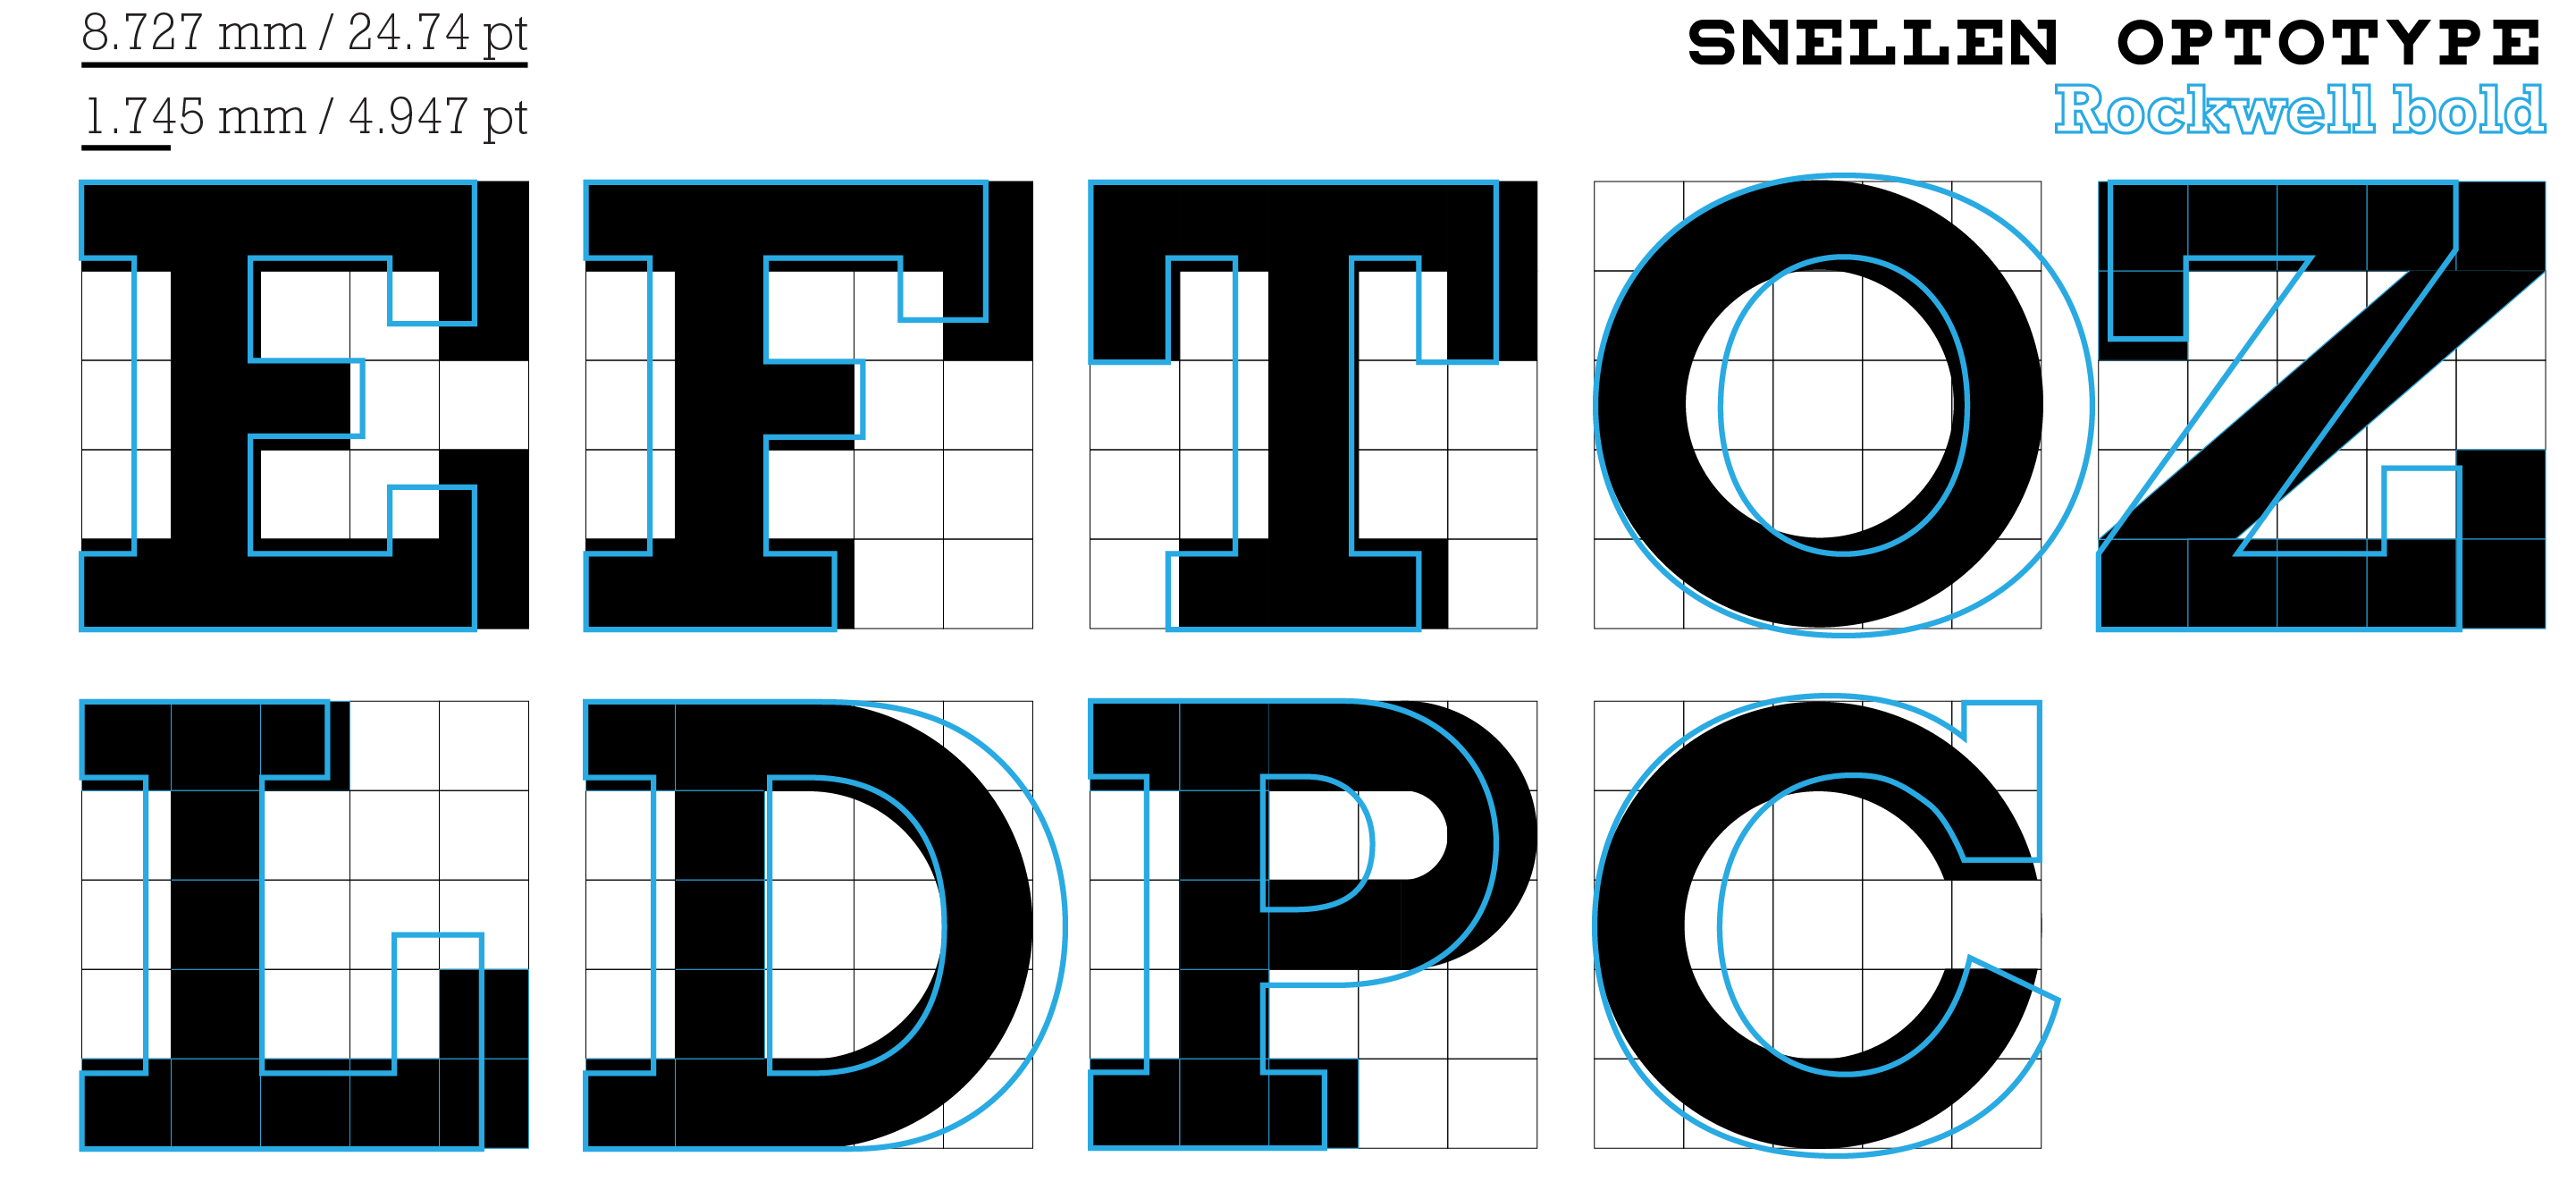
For the posters here, I've used either my redesigned Snellen font or Monotype's Rockwell, with minor stroke and kerning adjustments in places. Some symbols, such as on the math chart, were designed by hand.
The numbers on the left side of the posters (e.g. 20/30) are a measure of visual acuity. The numbers on the right provide information about what is shown on the line (e.g. abundance of elements).
The charts are designed to be viewed at a distance of 6 meters (20 feet). At this distance, ability to resolve a letter tha subtends 5 minute of arc corersponds to 6/6 (or 20/20) visual acuity. This corresponds to a letter size of $$\frac{2\pi}{360} \times \frac{5}{60} \times 6 = 8.727 \, \text{mm} = 24.74 \, \text{pt}$$
The Snellen optotypes are designed on a 5 × 5 grid and have a fascinating history. For design, Rockwell and Lubalin Graph can be used to approximate Snellen, though these fonts lack the grid structure of the optotypes.
 buy artwork
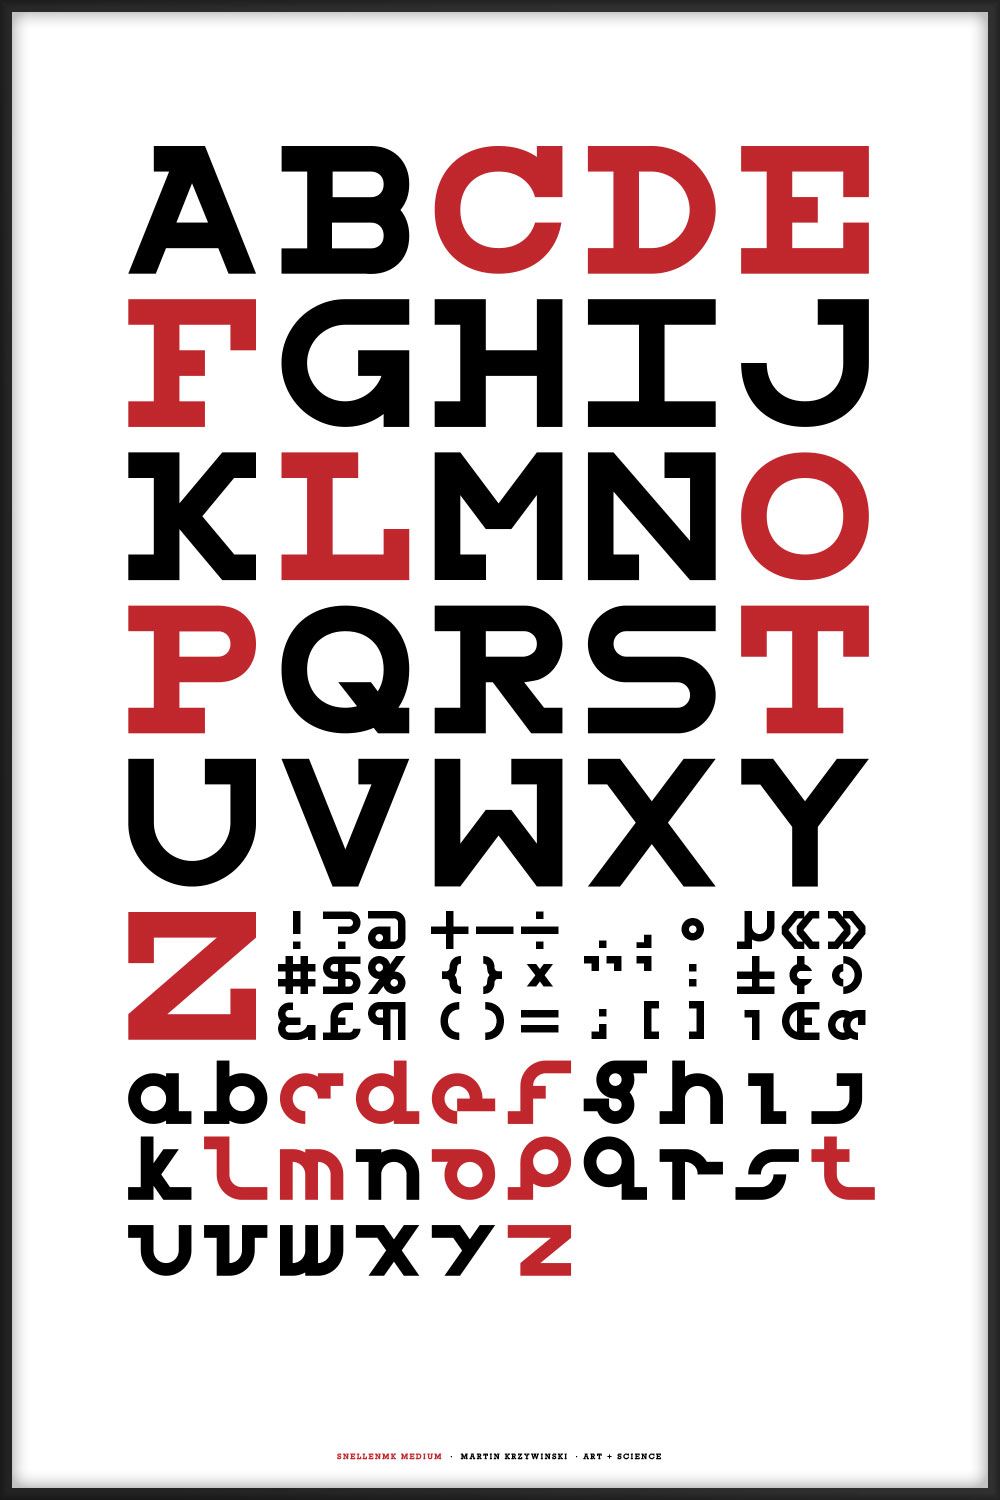
My redesign of Andrew Howlett's Snellen optotype font. Read about redesign process—which reinterprets some of the characters and adds lowercase.
You can download both versions of the font.
 buy artwork
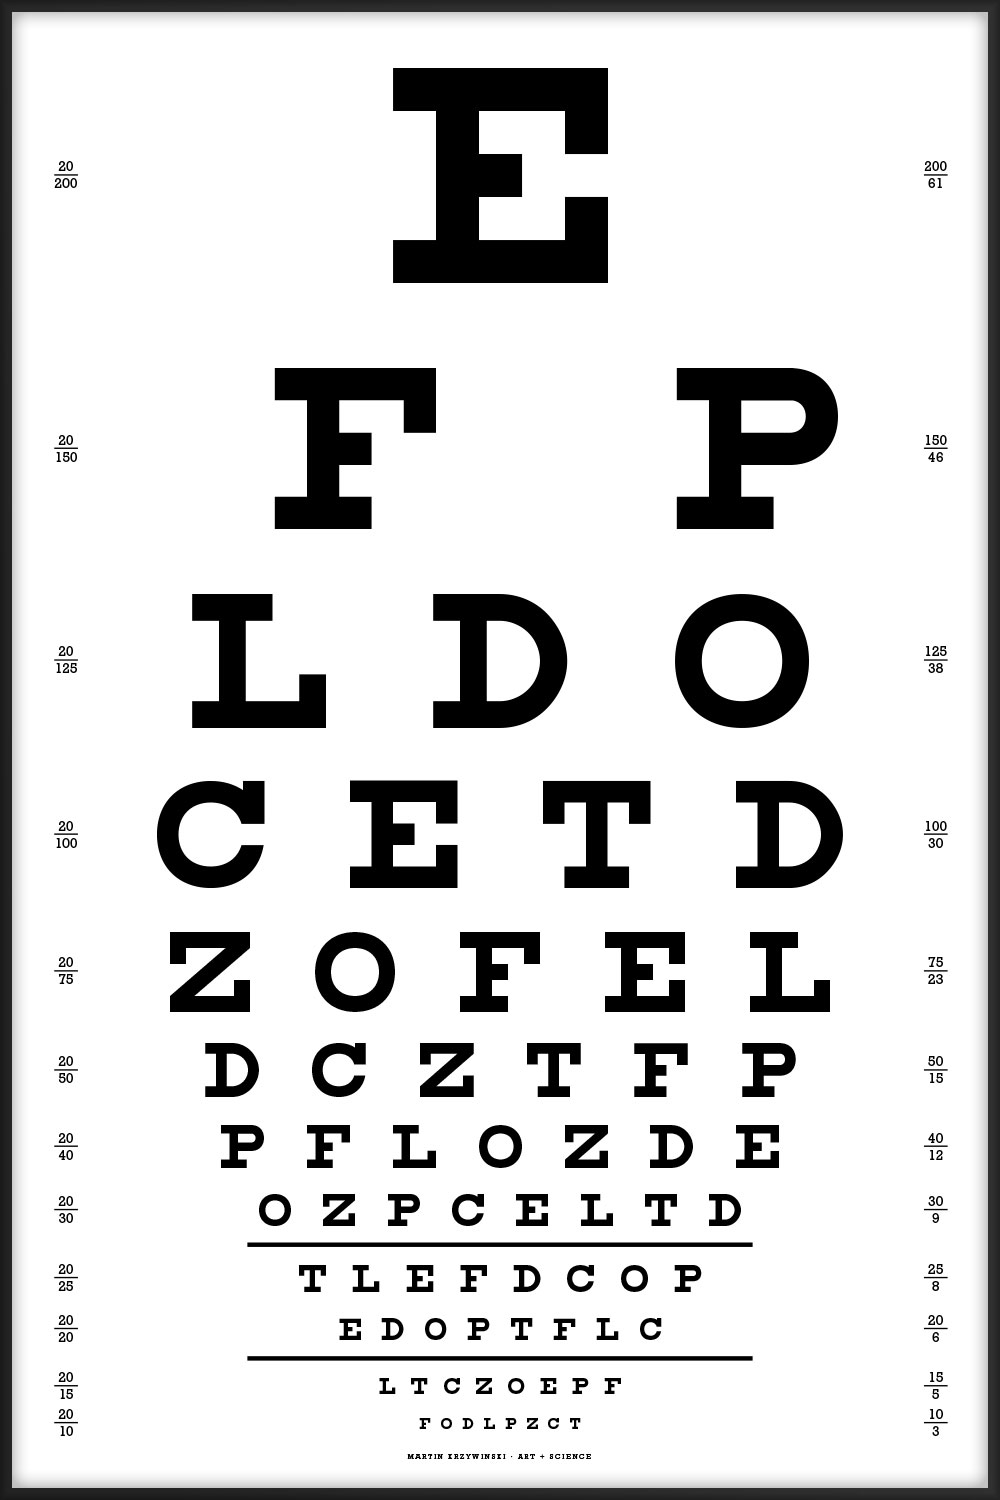
These Snellen charts include acuity lines from 20/200 to 20/10.
The charts should be printed at a physical size of 16" × 24" (1150 pt × 1725 pt. At this size, the characters on the 20/20 line subtend 5 minutes of arc when viewed at 6 meters (20 feet), which is the technical specification of the Snellen chart.
When the charts are printed at this size, the two horizontal lines below the 20/30 and 20/20 lines are exactly 8" (576 pt) long. These length markers are my own addition.
If the chart is printed at any other size, the viewing distance changes. To compute the correct viewing distance, `d`, measure the length of these lines, `L` (in inches) and use $$ d = 6 \times L / 8 $$
For example, if I print this chart to fit onto an 8.5" × 11" page, these lines are 3.47". Thus, my smaller chart should be viewed from `6 \times 3.47 / 8 = 2.60 \, \text{m}` (8.53 ft).
Numbers on the left provide visual acuity in feet. Numbers on the right show the denominator of the acuity in feet and its equivalent in meters, rounded to the nearest integer.
The order of the 61 characters on the charts has been limit uniformity and avoid easily perceived patterns—especially in the case of the genetic sequence Snellen. These restrictions (e.g. limit in the number of repeated n-grams) apply across linebreaks.
This is the canonical Snellen chart, using the 9 original characters.
E FP LDO CETD ZOFEL DCZTFP PFLOZDE OZPCELTD TLEFDCOP EDOPTFLC LTCZOEPF FODLPZCT
- no more than 8 instances of any character and no fewer than 6
- no double characters (e.g. PP does not occur)
- no more than 2 repeats of any 2-gram (e.g. LT ... LT ... LT does not occur)
- all 3-grams are unique (e.g. LDO does not repeat)
- no identical adjacent characters across lines within a distance of one positions.
- for a given line, the characters at the same position in the previous 6 lines are all different.
 buy artwork
 buy artwork
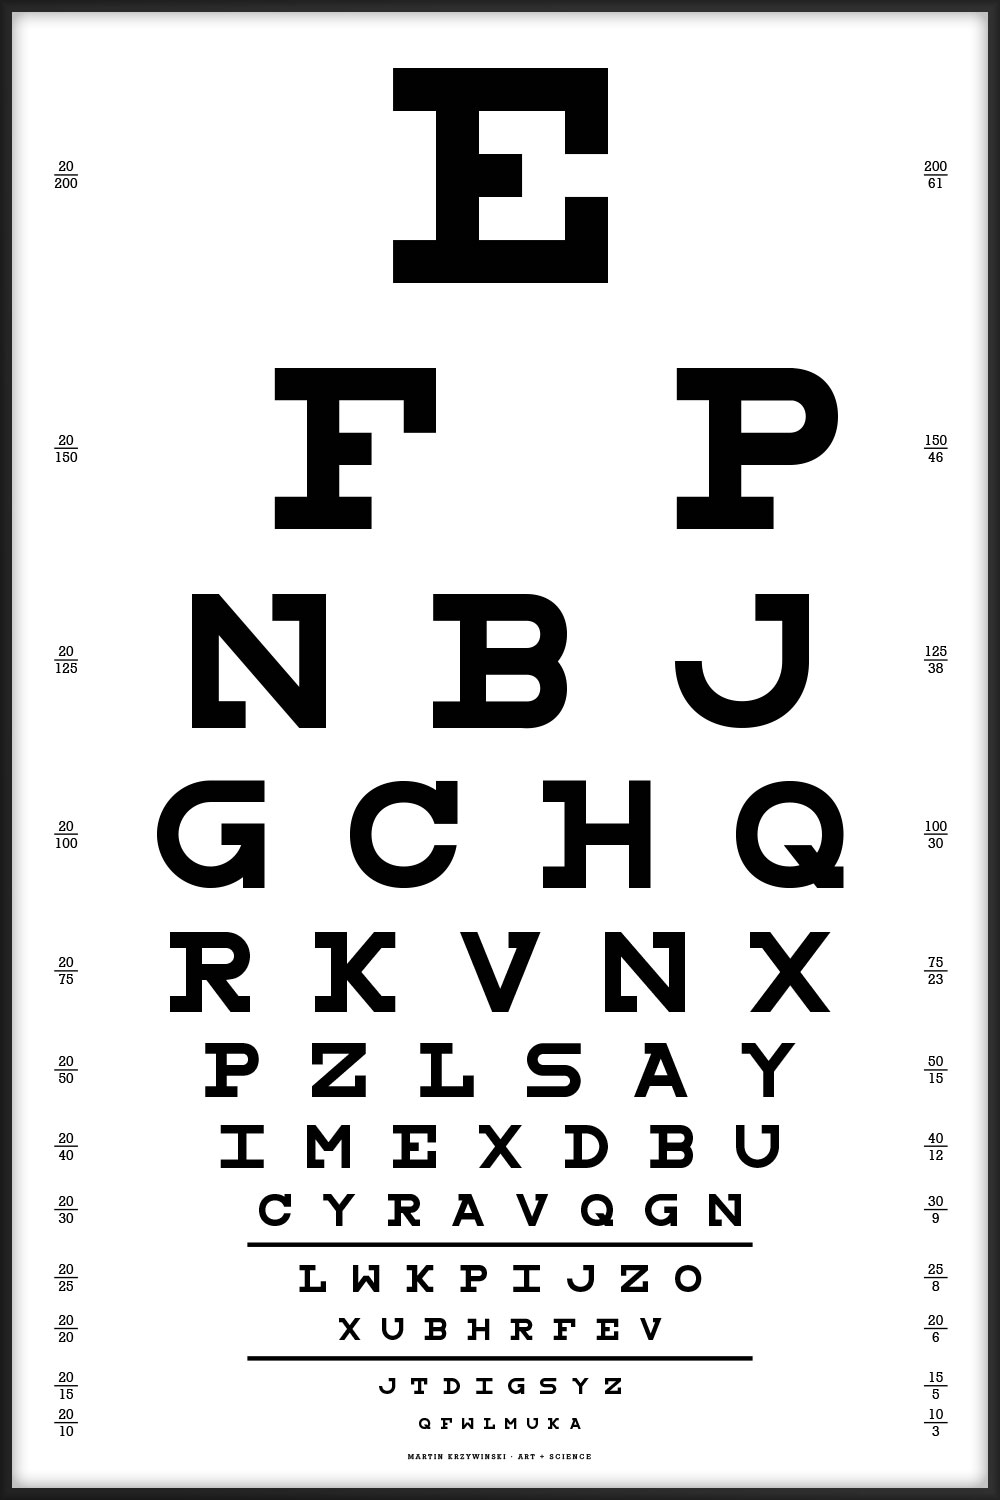
This chart uses all the letters of the alphabet and is typset using my Snellen font redesign.
- all letters of the alphabet are used
- no more than 3 instances of any character
- no double characters (e.g. PP does not occur)
- all n-grams (n = 2, 3, ...) are unique
- on a given line, all characters are unique
- no identical adjacent characters across lines within a distance of 8 positions.
- for a given line, the characters at the same position in all other lines are all different.
E FP NBJ GCHQ RKVNX PZLSAY IMEXDBU CYRAVQGH LWKPIJZO XUBHRFEV JTDIGSYZ QFWLMUKA
 buy artwork
 buy artwork
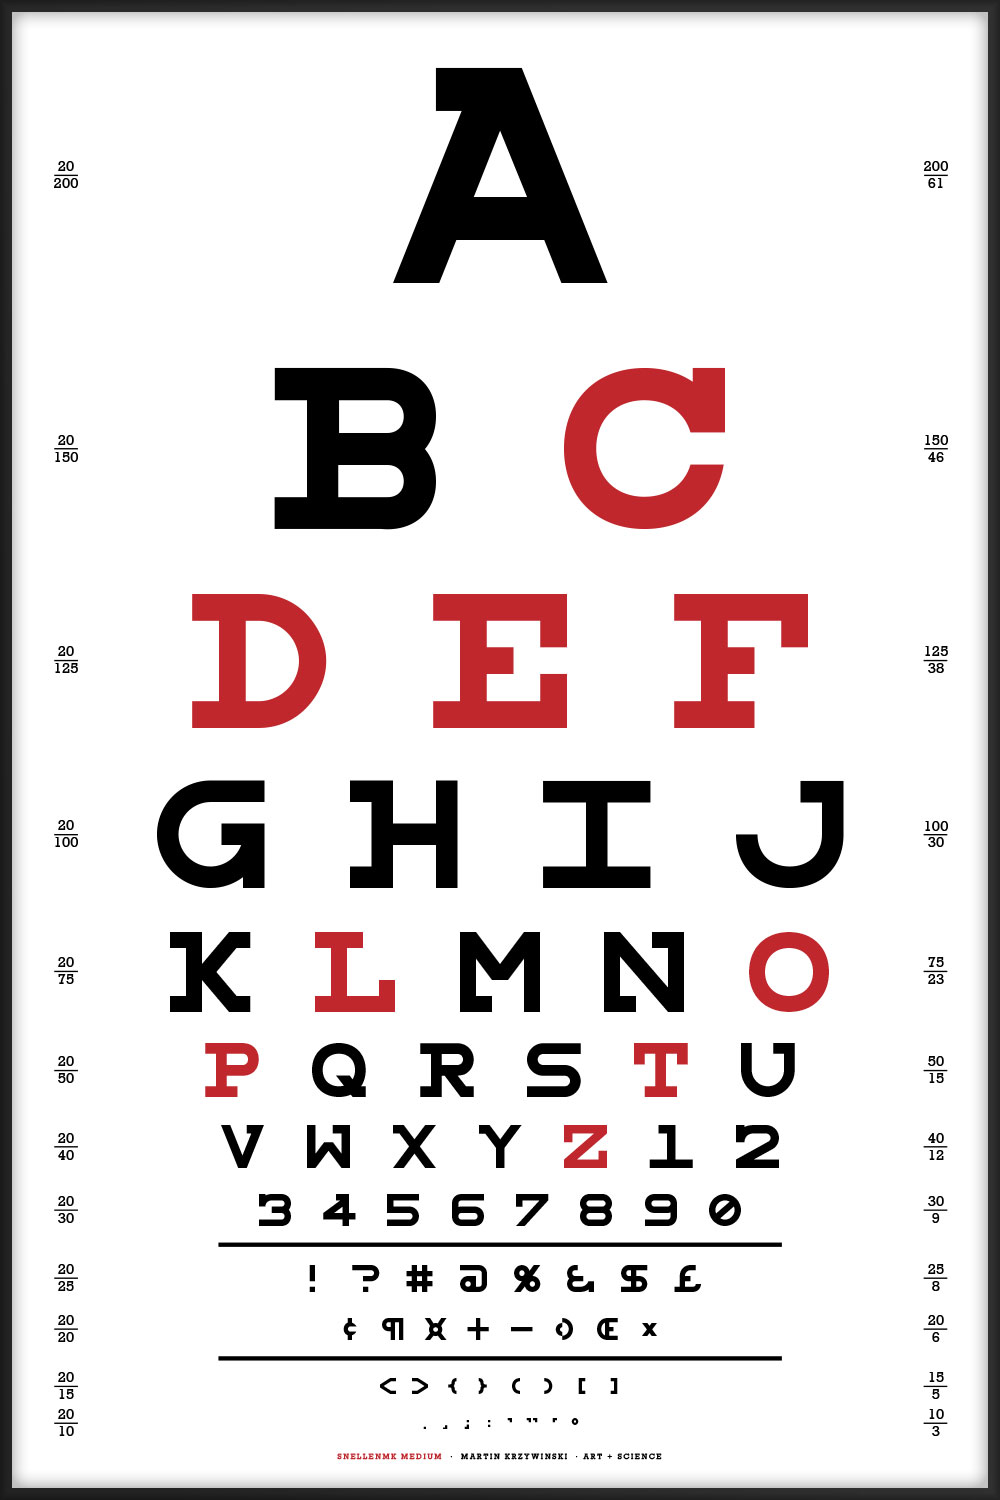
This chart uses all the letters of the alphabet and is typset using my Snellen font redesign.
 buy artwork
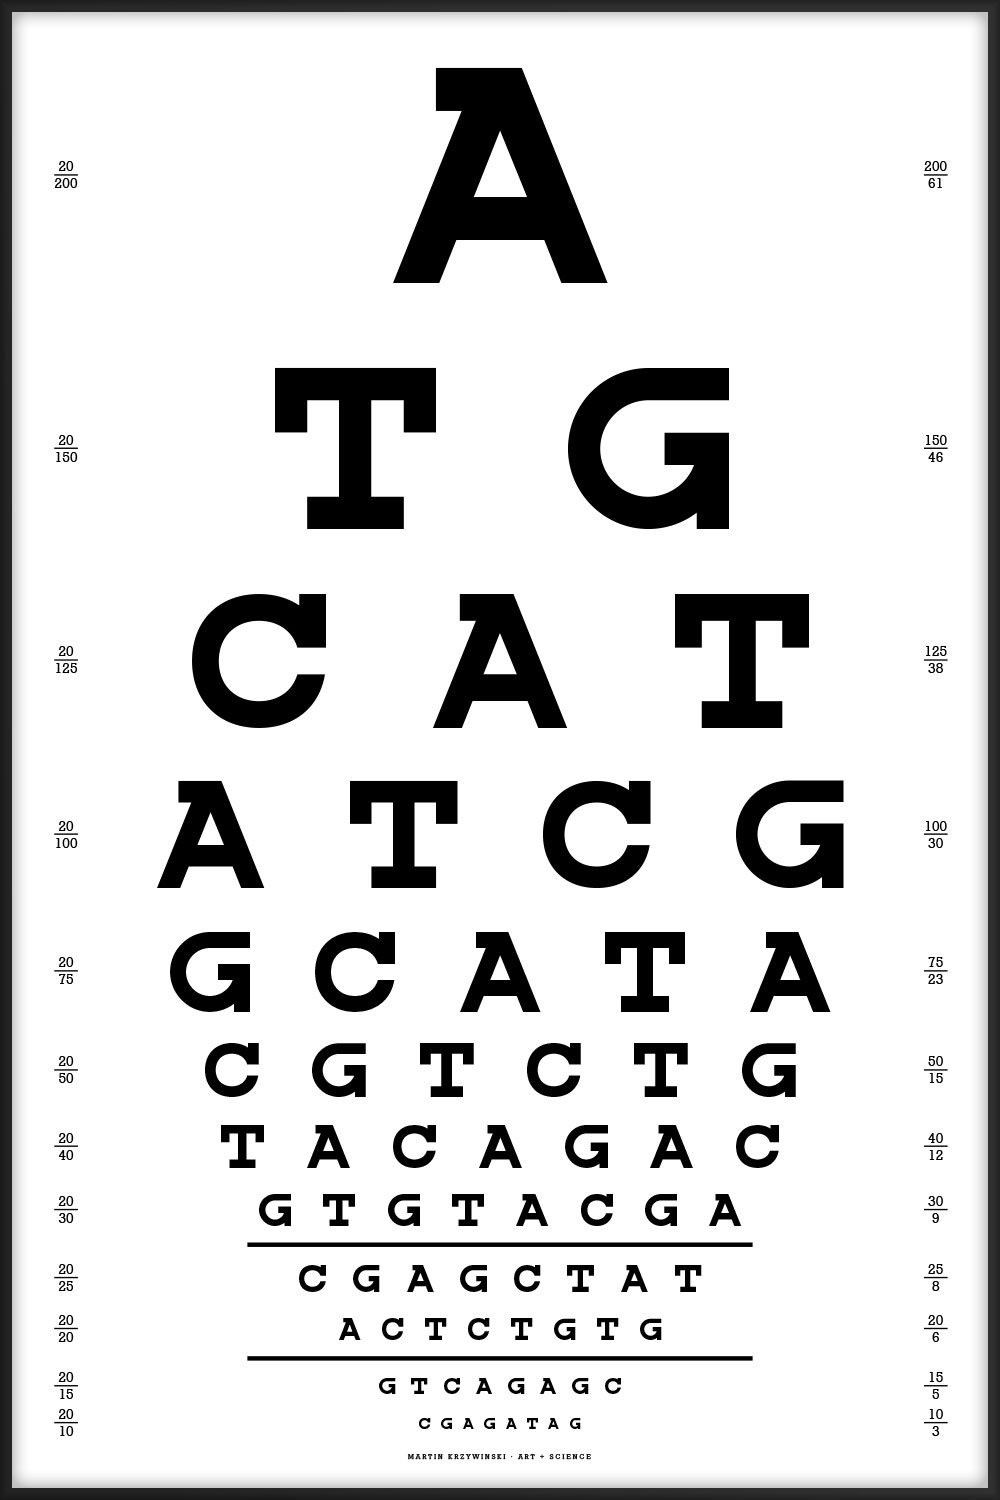
Since I work in a genome center, the one below is the one we'd use. Thanks to Dr. Nüket Bilgen for suggesting that the chart start with ATG (start codon) and end with one of the stop codons (TAG, TGA, but not TAA since no two adjoining characters can be the same).
- no more than 19 instances of any character and no fewer than 15
- no double characters (e.g. AA does not occur)
- no more than 7 repeats of any 2-gram
- no more than 4 repeats of any 3-gram
- no more than 2 repeats of any 4-gram or 5-gram
- for a given line, the characters at the same position in the previous 2 lines are different
- chart starts with start codon ATG
- chart ends with stop codon TAG, which appears only once; the other two stop codons (TGA, TAA) do not appear on the chart
A TG CAT ATCG GCATA CGTCTG TACAGAC GTGTACGA CGAGCTAT ACTCTGTG GTCAGAGC CGAGATAG
 buy artwork
The best alignments of this chart's sequence are to fungus (Leptosphaeria maculans lepidii, 35/42, 83%) and a tapeworm (Diphyllobothrium latum, 24/26, 92%). Thanks to Lorraine May for this observation!
Charts ahoy!
Z KE CHG XVRM YTWUS JQFINB EZAOXLD NHKVCUGF SWRMIAZP DBTOJYXE FZHLNUKA IVGMYCWR
 buy artwork
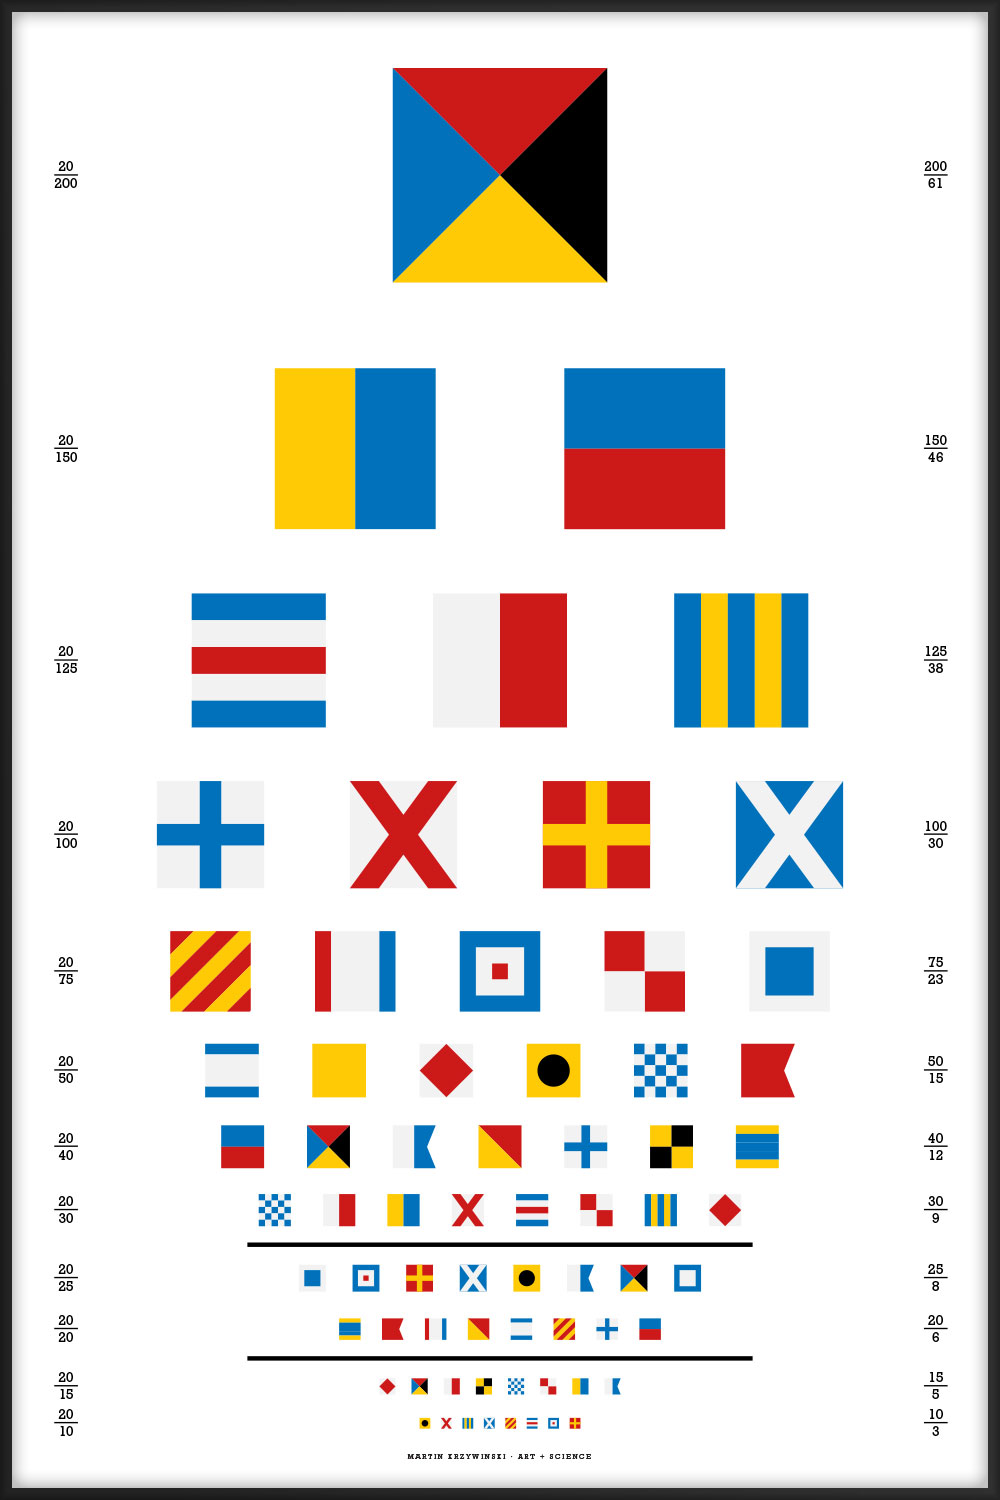
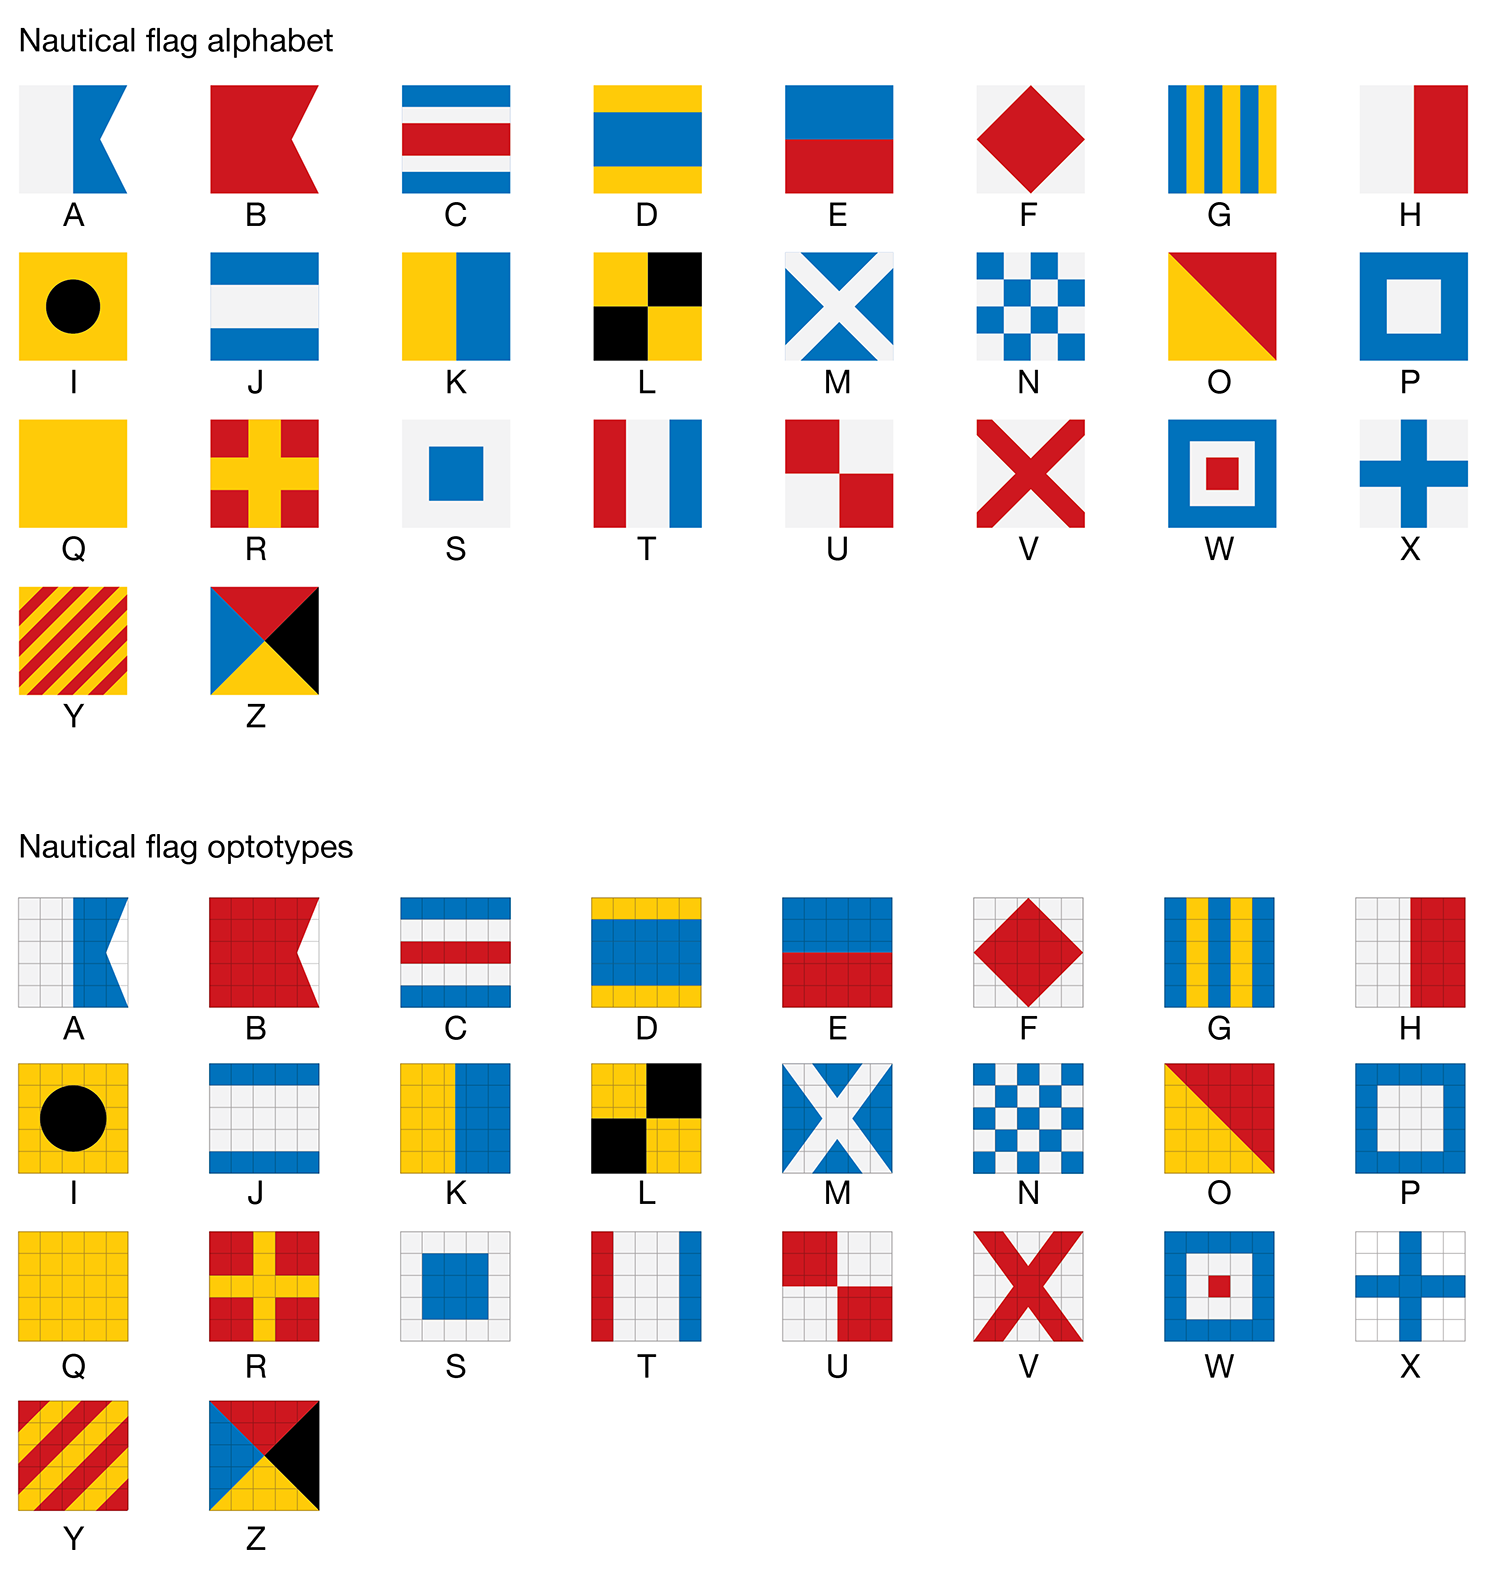
The flag alphabet has been designed to match, as closely as possible, to the style of the Snellen optotypes. In some cases this required that the geometry of the flag had to be adjusted—this may upset the purists and cause havoc on the waterways.
Proportions of colors has been adjusted in some flags to fit symmetrically into the 5 × 5 optotype grid. The checker of N is now a 5 × 5 grid. The number of stripes in Y has been reduced—the width of each stripe is now 20% of the width of the flag. Proportions in C, D, J, R, S, T, W and X have been adjusted so that color strips are a multiple of 20% of the width of the flag. The cross in M and V matches the X used in the Snellen font.
 buy artwork
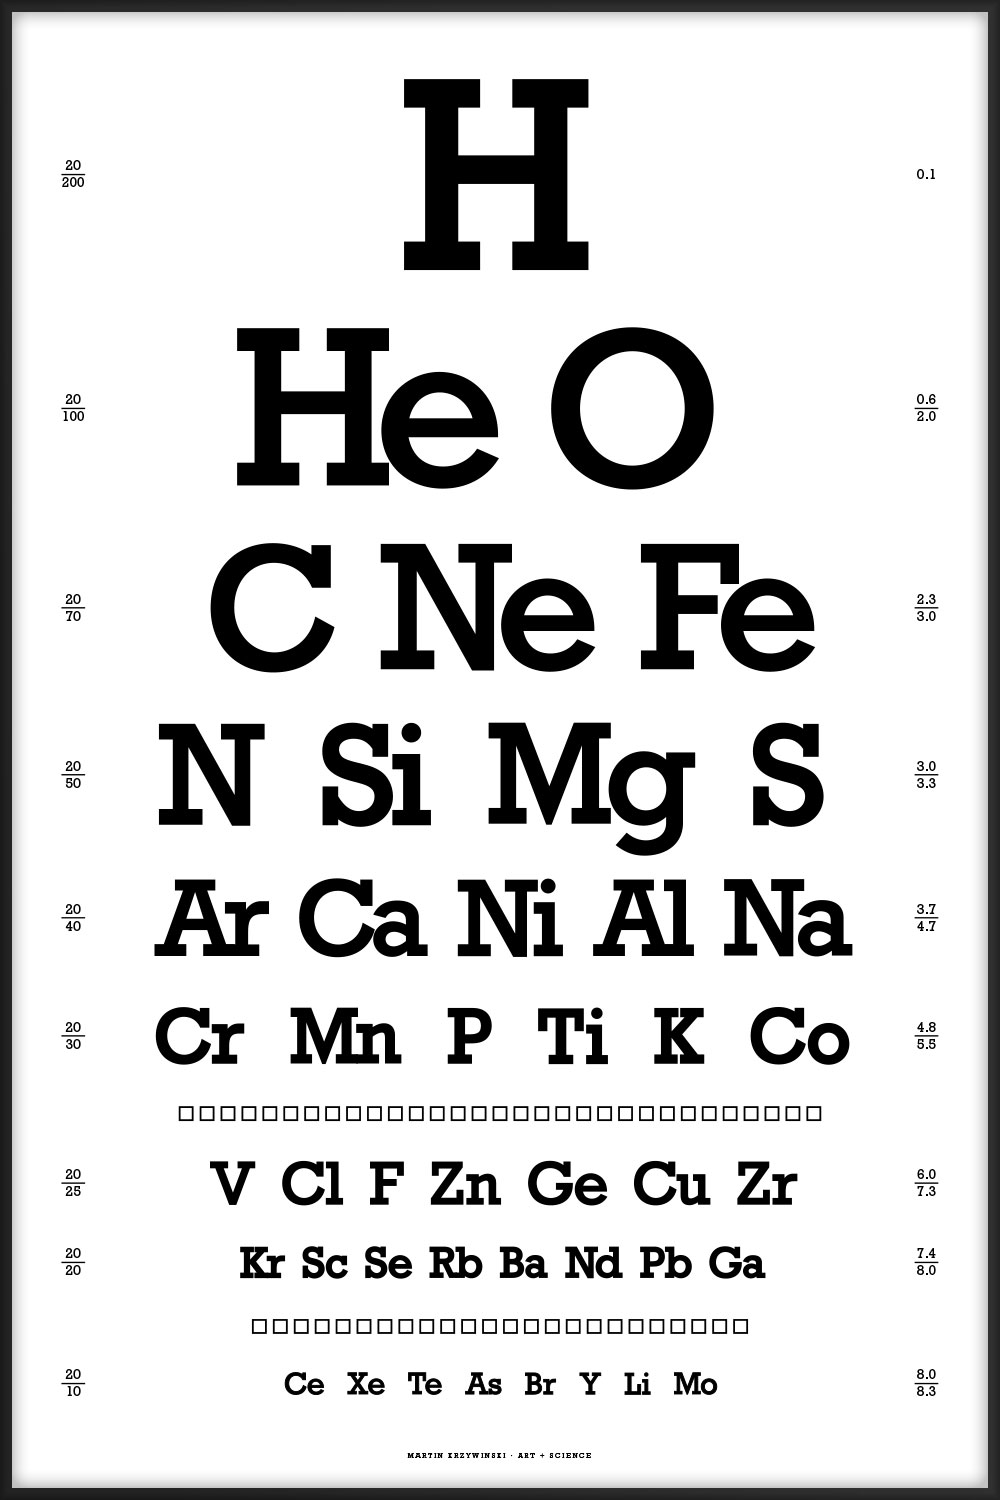
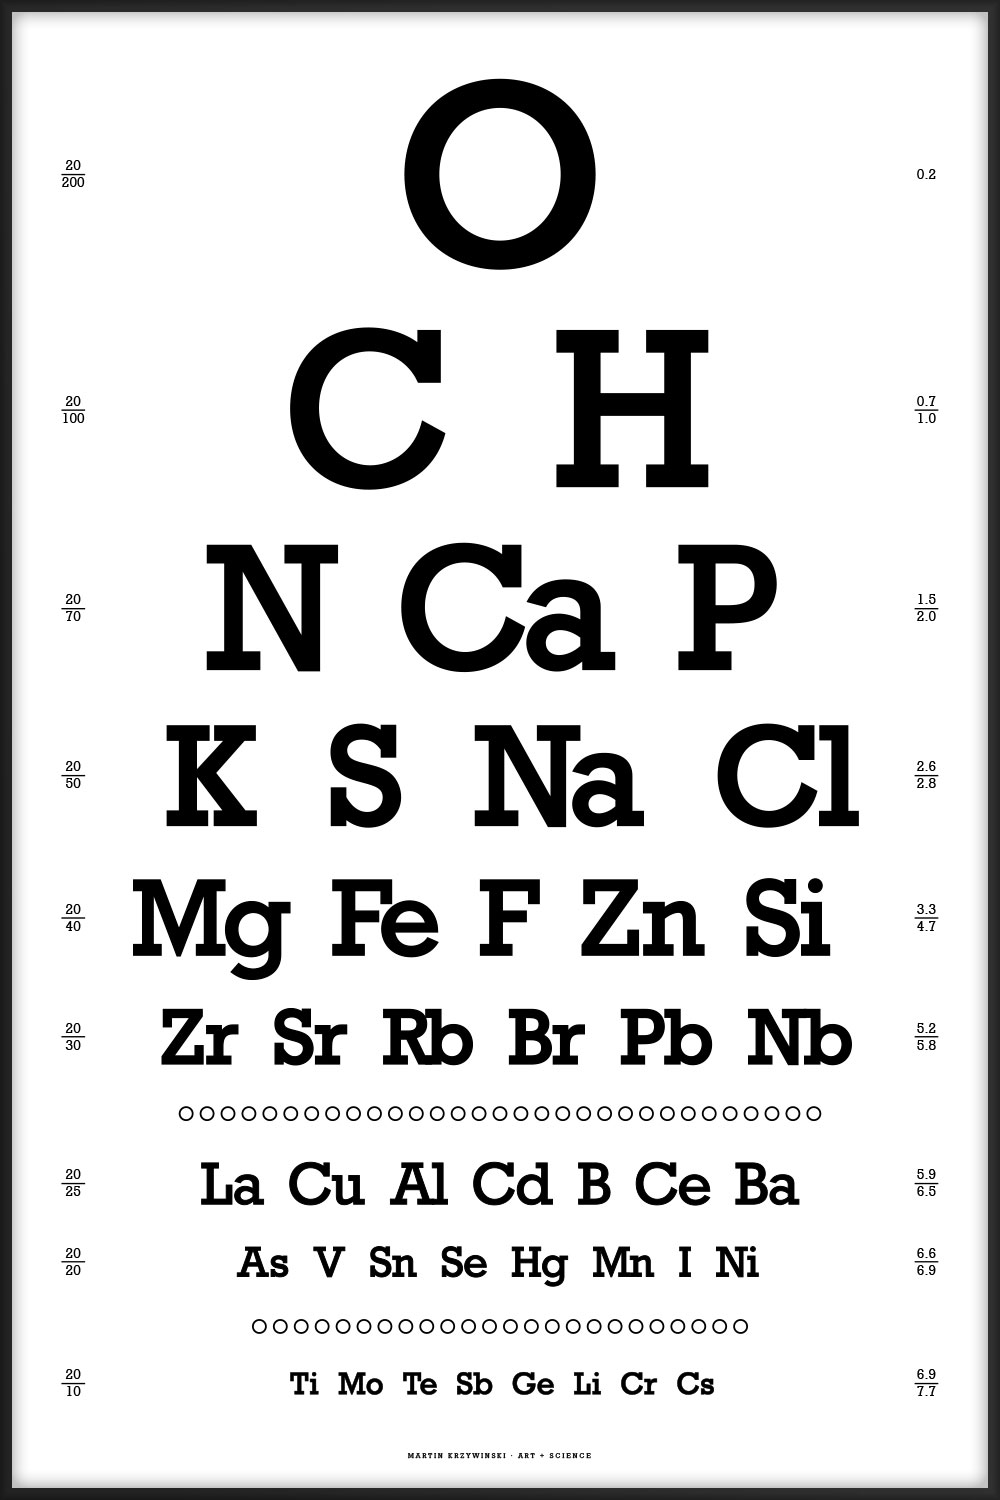
Elements are sorted in order of abundance. The numbers on the left show the max and min `-log_{10}` abundance of the elements listed on a given line. For example, 3.0/3.3 for the "N Si Mg S" line in the abundance of elements in the universe indicates that abundance of N is 0.001 and of S is 0.0005.
You can download my tidy plain-text table of abundance of elements in the universe (original source, 83 elements) and table of abundance of elements in the body (original source, 60 elements). These have been parsed from the original sources and give the `-log_{10}` abundance for various elements.
 buy artwork

44 of the most interesting physical constants ranging from the very large (Planck temperature `T_p = 1.4 \times 10^{32} \mathrm{K}`) to the very small (cosmological constant `\Lambda = 1.19 \times 10^{-52} \mathrm{m}^{-2}`). You can download the table of constants and their values.
44 intriguing and perhaps mysterious mathematical symbols ranging from common equality `=` to the esoteric normal subgroup `\triangleleft`.
The chart is the visual form of a rhetorical question. The letter layout here is the same as in the canonical Snellen chart, which is limited to the 10 Sloan letters C, D, E, F, L, N, O, P, T, Z.
Propensity score weighting
The needs of the many outweigh the needs of the few. —Mr. Spock (Star Trek II)
This month, we explore a related and powerful technique to address bias: propensity score weighting (PSW), which applies weights to each subject instead of matching (or discarding) them.
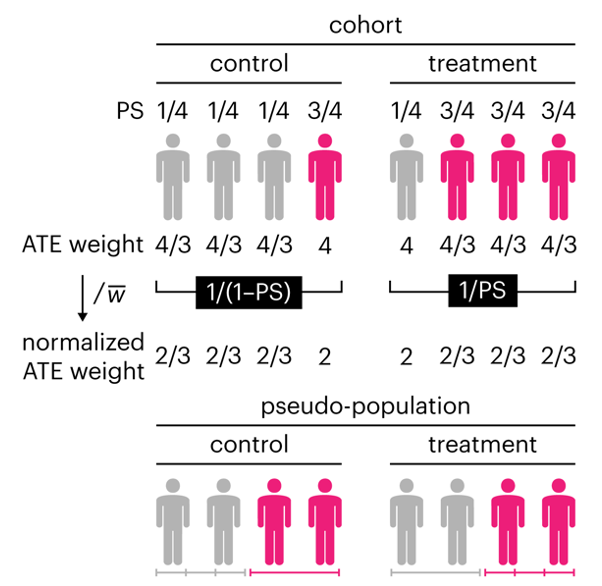
Kurz, C.F., Krzywinski, M. & Altman, N. (2025) Points of significance: Propensity score weighting. Nat. Methods 22:1–3.
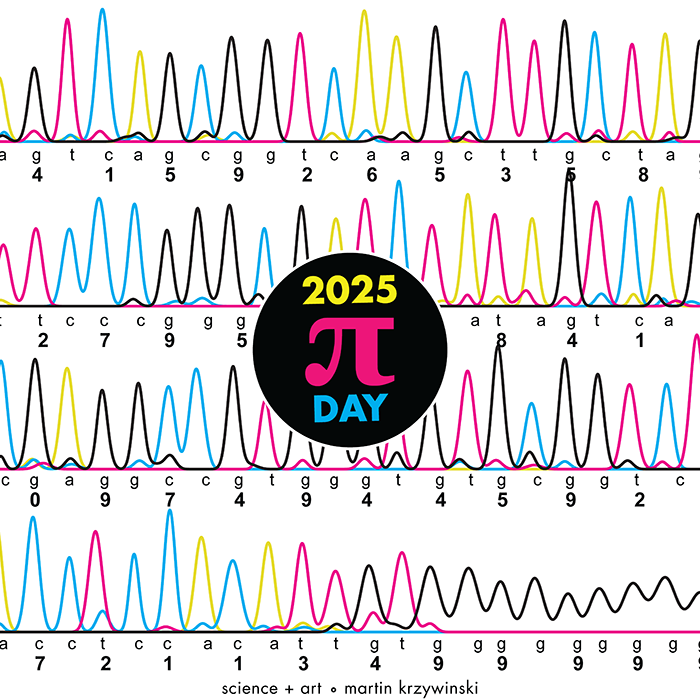
Happy 2025 π Day—
TTCAGT: a sequence of digits
Celebrate π Day (March 14th) and sequence digits like its 1999. Let's call some peaks.
Crafting 10 Years of Statistics Explanations: Points of Significance
I don’t have good luck in the match points. —Rafael Nadal, Spanish tennis player
Points of Significance is an ongoing series of short articles about statistics in Nature Methods that started in 2013. Its aim is to provide clear explanations of essential concepts in statistics for a nonspecialist audience. The articles favor heuristic explanations and make extensive use of simulated examples and graphical explanations, while maintaining mathematical rigor.
Topics range from basic, but often misunderstood, such as uncertainty and P-values, to relatively advanced, but often neglected, such as the error-in-variables problem and the curse of dimensionality. More recent articles have focused on timely topics such as modeling of epidemics, machine learning, and neural networks.
In this article, we discuss the evolution of topics and details behind some of the story arcs, our approach to crafting statistical explanations and narratives, and our use of figures and numerical simulations as props for building understanding.
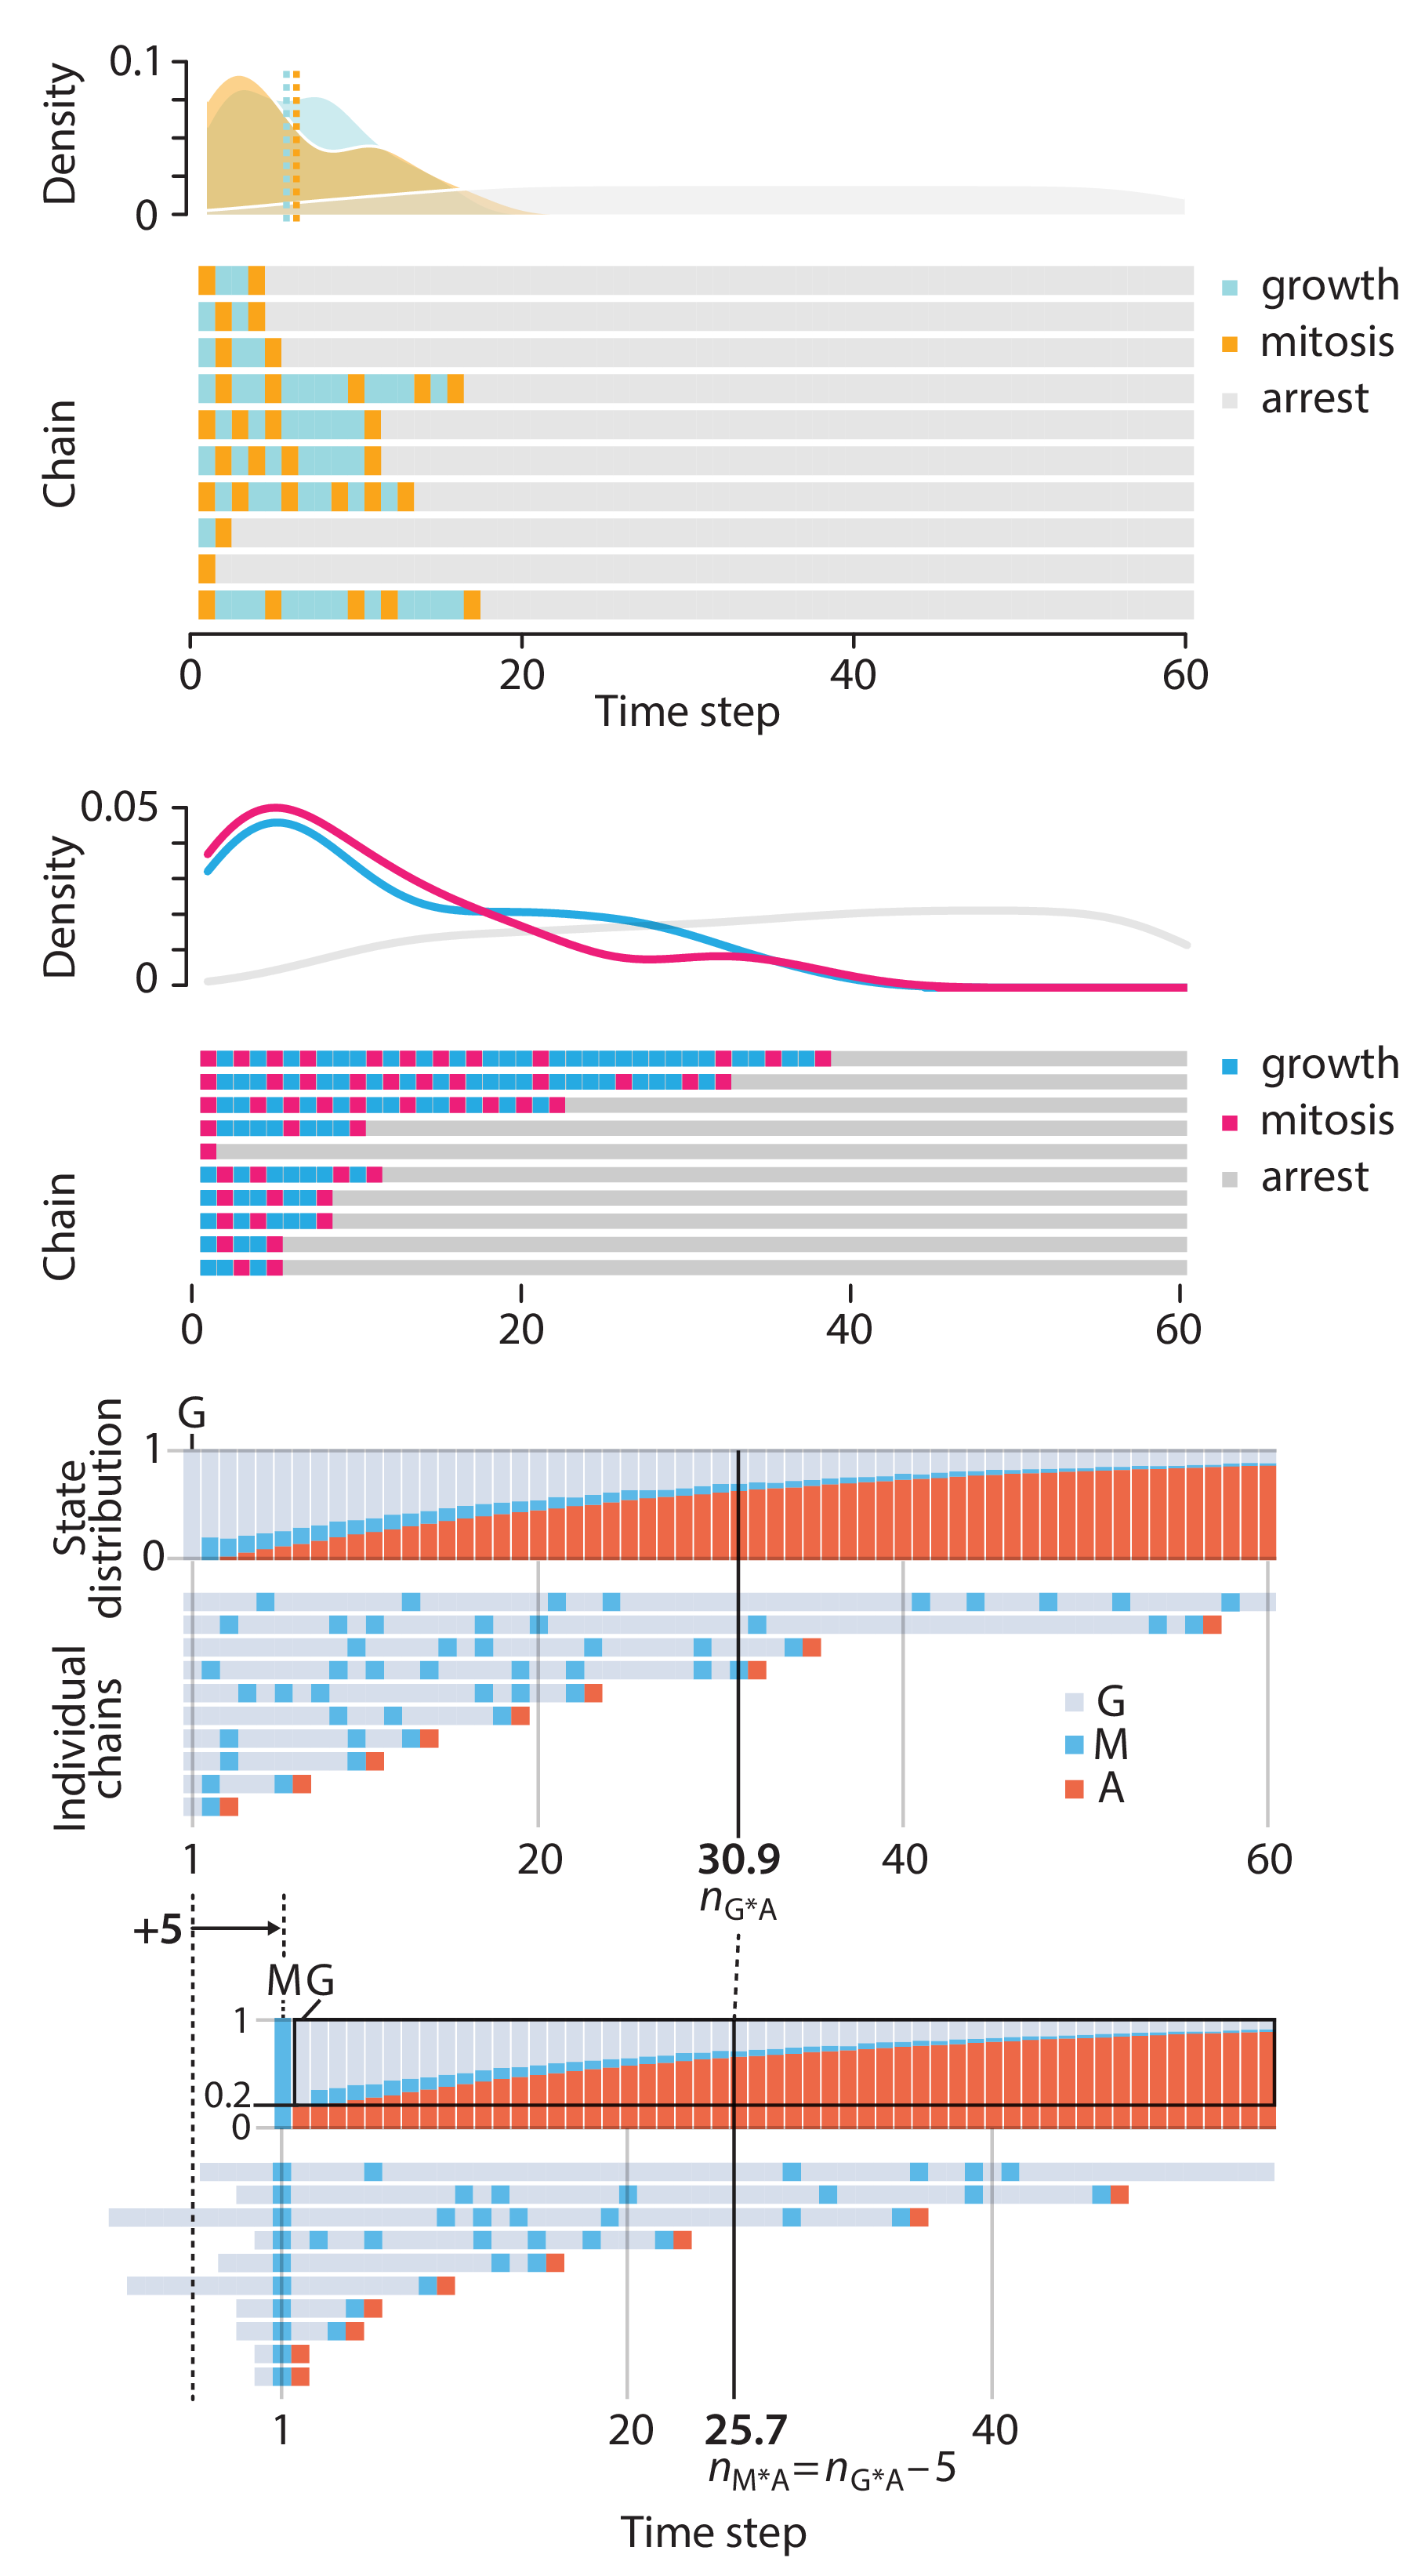
Altman, N. & Krzywinski, M. (2025) Crafting 10 Years of Statistics Explanations: Points of Significance. Annual Review of Statistics and Its Application 12:69–87.
Propensity score matching
I don’t have good luck in the match points. —Rafael Nadal, Spanish tennis player
In many experimental designs, we need to keep in mind the possibility of confounding variables, which may give rise to bias in the estimate of the treatment effect.

If the control and experimental groups aren't matched (or, roughly, similar enough), this bias can arise.
Sometimes this can be dealt with by randomizing, which on average can balance this effect out. When randomization is not possible, propensity score matching is an excellent strategy to match control and experimental groups.
Kurz, C.F., Krzywinski, M. & Altman, N. (2024) Points of significance: Propensity score matching. Nat. Methods 21:1770–1772.
Understanding p-values and significance
P-values combined with estimates of effect size are used to assess the importance of experimental results. However, their interpretation can be invalidated by selection bias when testing multiple hypotheses, fitting multiple models or even informally selecting results that seem interesting after observing the data.
We offer an introduction to principled uses of p-values (targeted at the non-specialist) and identify questionable practices to be avoided.
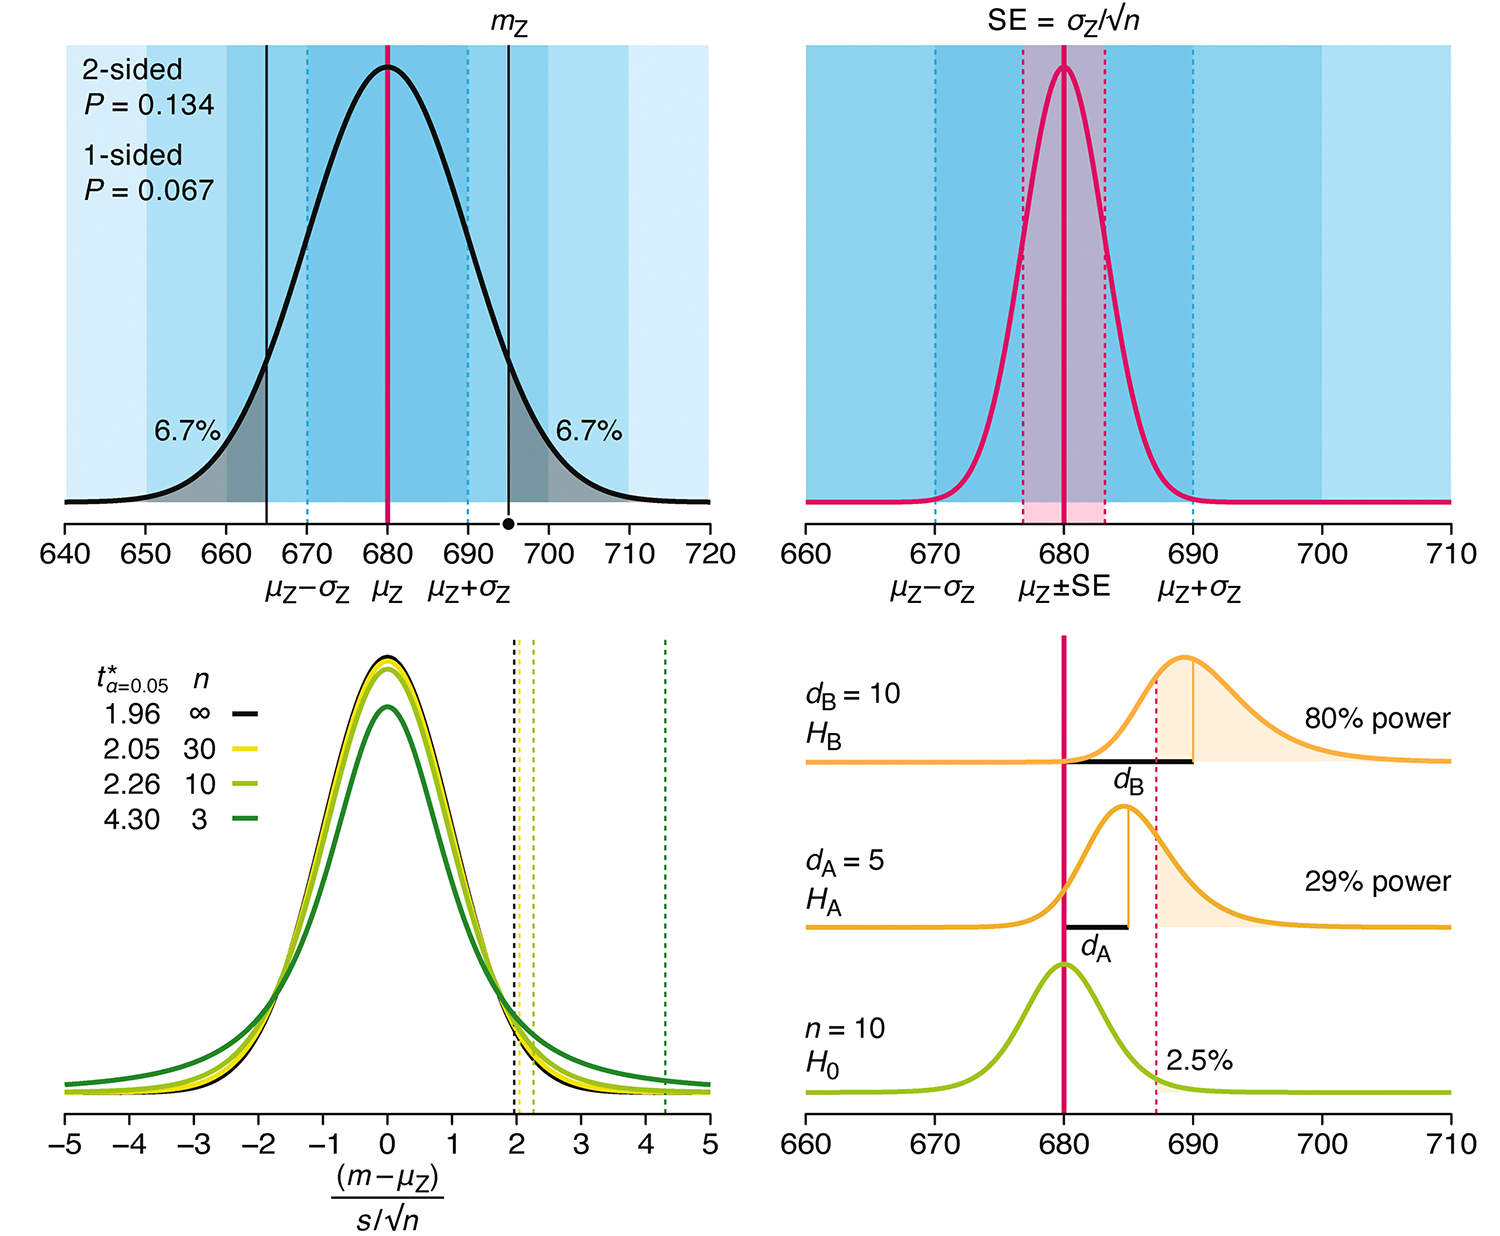
Altman, N. & Krzywinski, M. (2024) Understanding p-values and significance. Laboratory Animals 58:443–446.


