statistics
+ data
Nature Methods: Points of Significance
Generated on 10-Sep-2026 (11 days ago).
Metrics are provided by Altmetric.
Access values larger than 10,000 are rounded off to nearest 1,000 by Altmetric.
| article |
accesses |
daily |
%nm |
%all |
citations |
altmetric |
| Error bars |
236,000 |
50 |
98
|
99
|
282 |
247 |
| Significance, P values and t-tests |
234,000 |
50 |
90
|
98
|
168 |
85 |
| Principal component analysis |
217,000 |
65 |
86
|
96
|
1,428 |
76 |
| Visualizing samples with box plots |
217,000 |
47 |
88
|
98
|
539 |
82 |
| Association, correlation and causation |
212,000 |
53 |
98
|
99
|
368 |
190 |
| Replication |
144,000 |
33 |
63
|
95
|
212 |
30 |
| Statistics versus machine learning |
141,000 |
46 |
97
|
99
|
1,475 |
346 |
| P values and the search for significance |
137,000 |
39 |
90
|
98
|
109 |
128 |
| Importance of being uncertain |
127,000 |
27 |
79
|
97
|
93 |
52 |
| Power and sample size |
116,000 |
25 |
80
|
97
|
213 |
63 |
| The SEIRS model for infectious disease dynamics |
87,000 |
38 |
98
|
99
|
230 |
363 |
| Nonparametric tests |
68,000 |
15 |
58
|
89
|
101 |
14 |
| Comparing samples—part I |
67,000 |
15 |
64
|
92
|
71 |
21 |
| Analysis of variance and blocking |
66,000 |
15 |
60
|
91
|
75 |
18 |
| Two-factor designs |
63,000 |
15 |
34
|
51
|
36 |
3 |
| Bayes' theorem |
62,000 |
15 |
69
|
94
|
108 |
33 |
| Simple linear regression |
59,000 |
15 |
77
|
94
|
162 |
35 |
| Sources of variation |
59,000 |
14 |
48
|
88
|
33 |
12 |
| Comparing samples—part II |
58,000 |
13 |
48
|
86
|
82 |
11 |
| Split plot design |
57,000 |
14 |
40
|
77
|
72 |
7 |
| Classification and regression trees |
52,000 |
16 |
45
|
80
|
389 |
9 |
| Multiple linear regression |
52,000 |
13 |
80
|
96
|
166 |
43 |
| Sampling distributions and the bootstrap |
52,000 |
13 |
65
|
93
|
169 |
23 |
| Designing comparative experiments |
52,000 |
12 |
52
|
81
|
21 |
8 |
| Bayesian statistics |
51,000 |
12 |
51
|
88
|
37 |
14 |
| Interpreting P values |
50,000 |
14 |
70
|
95
|
80 |
48 |
| Bayesian networks |
45,000 |
11 |
39
|
73
|
73 |
6 |
| Model selection and overfitting |
44,000 |
12 |
75
|
95
|
676 |
42 |
| Classification evaluation |
44,000 |
12 |
67
|
94
|
414 |
40 |
| Clustering |
38,000 |
11 |
52
|
90
|
156 |
21 |
| Optimal experimental design |
31,000 |
10 |
51
|
90
|
123 |
21 |
| Analyzing outliers: influential or nuisance? |
29,000 |
8 |
29
|
65
|
115 |
4 |
| The curse(s) of dimensionality |
27,000 |
9 |
60
|
92
|
498 |
26 |
| Machine learning: supervised methods |
25,000 |
8 |
60
|
93
|
342 |
29 |
| Logistic regression |
25,000 |
7 |
66
|
92
|
129 |
26 |
| Modeling infectious epidemics |
24,000 |
10 |
86
|
97
|
105 |
114 |
| Regression diagnostics |
24,000 |
6 |
46
|
72
|
81 |
6 |
| Ensemble methods: bagging and random forests |
21,000 |
6 |
40
|
85
|
316 |
13 |
| Machine learning: a primer |
20,000 |
6 |
86
|
97
|
261 |
71 |
| Tabular data |
14,000 |
4 |
23
|
49
|
8 |
3 |
| Regularization |
14,000 |
4 |
57
|
88
|
46 |
17 |
| Two-level factorial experiments |
13,000 |
5 |
12
|
24
|
20 |
1 |
| Markov models—Markov chains |
10,000 |
4 |
36
|
89
|
36 |
19 |
| Predicting with confidence and tolerance |
9,065 |
3 |
23
|
46
|
10 |
3 |
| The standardization fallacy |
8,450 |
4 |
41
|
89
|
55 |
17 |
| Markov models — hidden Markov models |
7,329 |
3 |
28
|
77
|
37 |
8 |
| Convolutional neural networks |
7,077 |
6 |
18
|
73
|
103 |
6 |
| The class imbalance problem |
5,574 |
3 |
31
|
85
|
138 |
12 |
| Quantile regression |
5,427 |
2 |
35
|
84
|
115 |
12 |
| Survival analysis—time-to-event data and censoring |
5,288 |
4 |
20
|
70
|
32 |
5 |
| Markov models — training and evaluation of hidden Markov models |
4,867 |
2 |
44
|
83
|
11 |
10 |
| Analyzing outliers: robust methods to the rescue |
4,255 |
2 |
25
|
50
|
35 |
3 |
| Neural networks primer |
4,059 |
3 |
21
|
69
|
11 |
4 |
| Propensity score matching |
4,048 |
6 |
5
|
31
|
36 |
1 |
| Propensity score weighting |
2,876 |
5 |
18
|
71
|
10 |
5 |
| Graphical assessment of tests and classifiers |
2,639 |
1 |
25
|
80
|
11 |
9 |
| Regression modeling of time-to-event data with censoring |
2,543 |
2 |
16
|
72
|
6 |
5 |
| Comparing classifier performance with baselines |
2,424 |
3 |
24
|
76
|
13 |
7 |
| Errors in predictor variables |
1,955 |
2 |
1
|
14
|
7 |
1 |
| Testing for rare conditions |
1,862 |
1 |
15
|
60
|
4 |
4 |
| Double robustness |
1,484 |
11 |
1
|
1
|
0 |
1 |
| Symmetric alternatives to the ordinary least squares regression |
1,347 |
3 |
37
|
78
|
1 |
7 |
| Consequences of missing data |
440 |
63 |
|
|
0 |
|
| Uncertainty and the management of epidemics |
0 |
0 |
|
|
0 |
|
| Nested designs |
0 |
0 |
|
|
0 |
|
|
3,267,009 |
946 |
48 |
76 |
10,753 |
%NM percentile rank (avg 48) for the article of tracked articles of a similar age in Nature Methods.
%ALL percentile rank (avg 76) for the article of tracked articles of a similar age in all journals.
Total accesses 3,267,009.
Total citations 10,753.
news
+ thoughts
Fri 04-09-2026
Either I've been missing something or nothing has been going on. —Karen Elizabeth Gordon
Missing data are everywhere. Subjects may decline to participate in a survey or fail to answer sensitive questions. A cell culture might fail due to contamination. Instrument failures or mishandling of a sample may lead to missing observations. But why are missing data a problem?
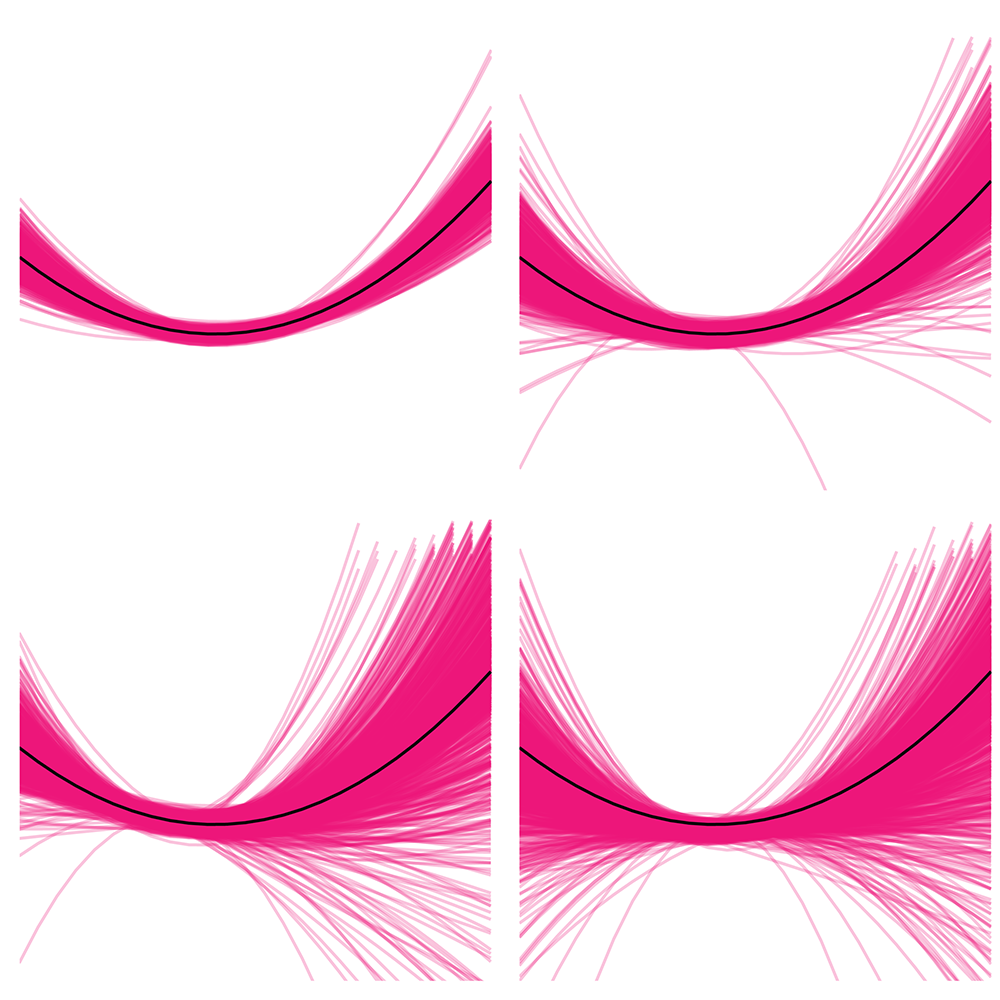
▲ Nature Methods Points of Significance column: Consequences of missing data.
(
read)
This month, we begin a series of articles about practical and statistical aspects of missing data. We'll see that missing data can increase variability and introduce bias and we will ask whether anything can be done to mitigate these consequences. It turns out that, in the case where we know nothing about the missing subjects, no mitigation is possible. We must accept higher variability and, if we have a suspicion that the missing subjects arenât completely random, possible bias as well.
Tanujit Dey, T., Lipsitz, S.R., Fitzmaurice, G., Krzywinski, M. & Altman, N. (2026) Points of significance: Consequences of missing data. Nat. Methods 23:1661–1663.
Mon 04-05-2026
It is not certain that everything is uncertain. —Blaise Pascal
We have already explored how we can mitigate bias caused by confounding variables in observational studies using propensity score (PS) matching (PSM) and propensity score weighting (PSW). However, any statistical model is only as good as its assumptions and, if it is specified incorrectly, it can itself produce biased estimates of the treatment effect.
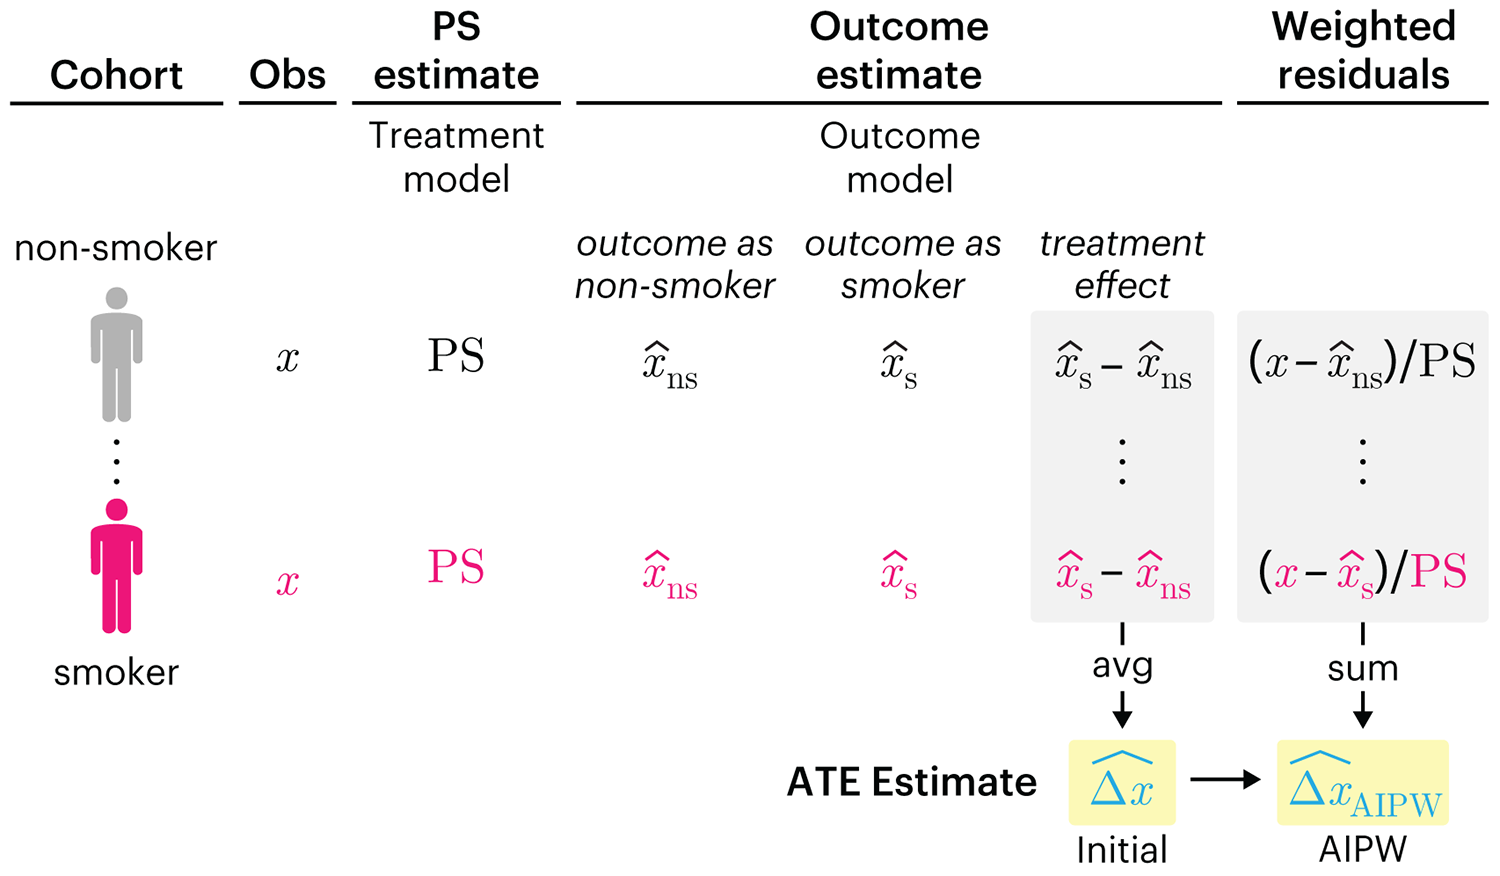
▲ Nature Methods Points of Significance column: Double Robustness.
(
read)
This month, we explore double robustness, a powerful statistical concept that provides a valuable “safety net” against the risk of an incorrect model. It offers two opportunities, instead of just one, to obtain a valid estimate of the treatment effect â making it possible to draw credible causal inferences from observational data without having to depend on a single set of modeling assumptions.
Kurz, C.F., Krzywinski, M. & Altman, N. (2026) Points of significance: Double Robustness. Nat. Methods 23:868–869.
Thu 23-04-2026
My cover design on the 7 April 2026 Nature Biotechnology issue shows the dendrogram that represents a cluster of uniquely expressed (or downregulated) genes in human naive stem cells induced from such cells. Within each dendrogram block, the genomic barcode sequence (sampled from Supplementary Table 1) is depicted with a Code 39 barcode. The highlighted barcode is one of those used for cell isolation.
Ishiguro S. et al. A multi-kingdom genetic barcoding system for precise clone isolation (2026) Nature Biotechnology 44:616–629.

▲ My Nature Biotechnology phylogenetic tree cover (volume 44, issue 4, 7 April 2026).
(
more)
Browse my gallery of cover designs.

▲ A catalogue of my journal and magazine cover designs.
(
more)
Fri 13-03-2026
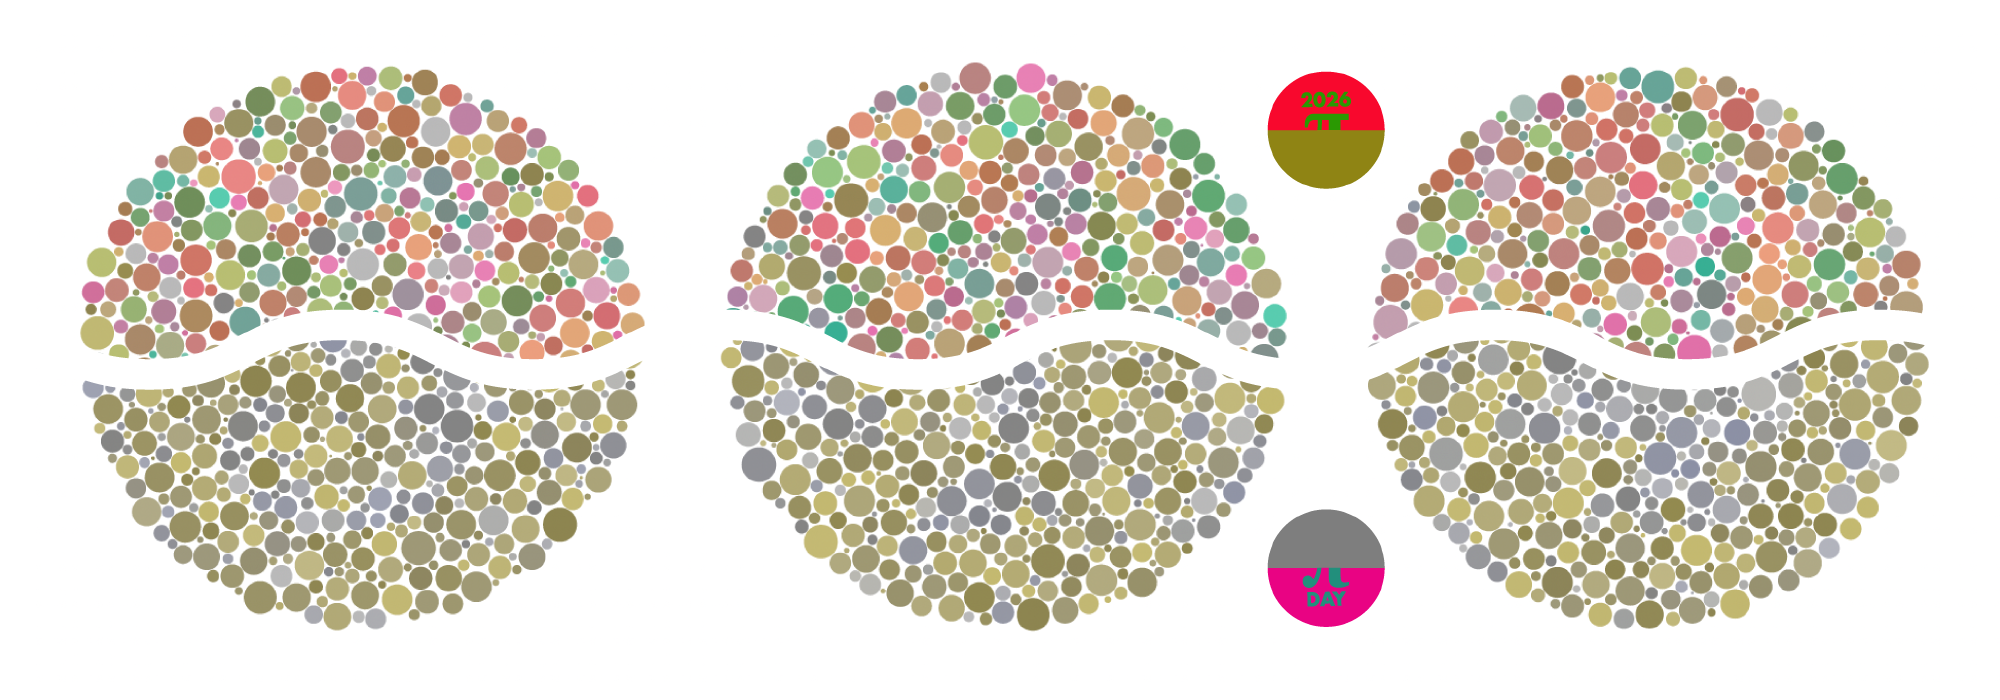
Celebrate Ï Day (March 14th) and enjoy the art — but only if you're part of the 5%.
Go ahead, see what you can't see.

▲ 2026 Ï DAY | Art for the 5%. Shown in the style of Ishihara color test plates, the art is visible only to those with colour blindness.
(
details)