statistics
+ data
Nature Methods: Points of Significance
Generated on 27-Nov-2024 (149 days ago).
Metrics are provided by Altmetric.
Access values larger than 10,000 are rounded off to nearest 1,000 by Altmetric.
| article |
accesses |
daily |
%nm |
%all |
cit (ws) |
cit (cross) |
altmetric |
| Significance, P values and t-tests |
227,000 |
56 |
90
|
98
|
112 |
93 |
89 |
| Error bars |
223,000 |
55 |
98
|
99
|
186 |
179 |
272 |
| Visualizing samples with box plots |
205,000 |
52 |
86
|
98
|
390 |
371 |
77 |
| Principal component analysis |
203,000 |
75 |
87
|
96
|
513 |
867 |
87 |
| Association, correlation and causation |
187,000 |
56 |
98
|
99
|
215 |
179 |
187 |
| Replication |
135,000 |
36 |
57
|
93
|
127 |
94 |
24 |
| P values and the search for significance |
134,000 |
46 |
93
|
98
|
64 |
71 |
151 |
| Statistics versus machine learning |
130,000 |
53 |
97
|
99
|
224 |
888 |
348 |
| Importance of being uncertain |
121,000 |
29 |
79
|
96
|
63 |
55 |
51 |
| Power and sample size |
110,000 |
27 |
74
|
97
|
138 |
126 |
54 |
| Nonparametric tests |
66,000 |
17 |
53
|
87
|
60 |
54 |
12 |
| Comparing samples—part I |
64,000 |
16 |
67
|
92
|
29 |
33 |
20 |
| Analysis of variance and blocking |
62,000 |
16 |
60
|
91
|
51 |
49 |
18 |
| Nested designs |
61,000 |
16 |
86
|
96
|
44 |
38 |
55 |
| Bayes' theorem |
59,000 |
17 |
72
|
94
|
67 |
53 |
36 |
| Two-factor designs |
59,000 |
16 |
34
|
51
|
28 |
27 |
3 |
| The SEIRS model for infectious disease dynamics |
58,000 |
35 |
98
|
99
|
117 |
127 |
356 |
| Comparing samples—part II |
55,000 |
14 |
48
|
87
|
54 |
48 |
12 |
| Simple linear regression |
54,000 |
16 |
74
|
93
|
78 |
83 |
28 |
| Split plot design |
54,000 |
15 |
40
|
78
|
52 |
46 |
7 |
| Sources of variation |
54,000 |
15 |
53
|
91
|
19 |
18 |
16 |
| Bayesian statistics |
49,000 |
14 |
55
|
89
|
21 |
17 |
16 |
| Designing comparative experiments |
49,000 |
13 |
51
|
82
|
13 |
14 |
8 |
| Sampling distributions and the bootstrap |
48,000 |
14 |
54
|
91
|
84 |
77 |
18 |
| Interpreting P values |
47,000 |
17 |
74
|
95
|
50 |
53 |
57 |
| Multiple linear regression |
47,000 |
14 |
80
|
95
|
88 |
80 |
42 |
| Classification and regression trees |
45,000 |
17 |
45
|
79
|
194 |
219 |
9 |
| Classification evaluation |
40,000 |
13 |
70
|
94
|
227 |
208 |
44 |
| Model selection and overfitting |
39,000 |
13 |
66
|
92
|
392 |
347 |
26 |
| Bayesian networks |
38,000 |
11 |
45
|
77
|
38 |
26 |
7 |
| Clustering |
34,000 |
12 |
50
|
89
|
86 |
99 |
21 |
| Optimal experimental design |
28,000 |
12 |
49
|
89
|
58 |
67 |
20 |
| Analyzing outliers: influential or nuisance? |
27,000 |
9 |
28
|
65
|
61 |
56 |
4 |
| Machine learning: supervised methods |
23,000 |
9 |
56
|
91
|
173 |
203 |
22 |
| Logistic regression |
22,000 |
7 |
67
|
92
|
77 |
67 |
25 |
| Regression diagnostics |
22,000 |
7 |
46
|
72
|
53 |
48 |
6 |
| The curse(s) of dimensionality |
21,000 |
9 |
58
|
88
|
207 |
228 |
20 |
| Ensemble methods: bagging and random forests |
19,000 |
7 |
35
|
78
|
147 |
162 |
9 |
| Modeling infectious epidemics |
18,000 |
11 |
85
|
97
|
54 |
67 |
115 |
| Machine learning: a primer |
17,000 |
7 |
89
|
97
|
103 |
112 |
74 |
| Tabular data |
14,000 |
5 |
28
|
64
|
3 |
2 |
4 |
| Regularization |
13,000 |
4 |
53
|
86
|
34 |
27 |
14 |
| Two-level factorial experiments |
11,000 |
5 |
12
|
24
|
11 |
11 |
1 |
| Predicting with confidence and tolerance |
8,183 |
4 |
24
|
59
|
6 |
6 |
4 |
| Markov models—Markov chains |
7,993 |
4 |
41
|
90
|
18 |
19 |
24 |
| Markov models — hidden Markov models |
6,183 |
3 |
26
|
79
|
19 |
24 |
10 |
| The standardization fallacy |
5,278 |
4 |
47
|
92
|
30 |
32 |
28 |
| Convolutional neural networks |
5,268 |
11 |
15
|
69
|
17 |
20 |
5 |
| Quantile regression |
4,398 |
2 |
36
|
78
|
39 |
73 |
9 |
| Markov models — training and evaluation of hidden Markov models |
4,285 |
2 |
40
|
84
|
5 |
5 |
12 |
| The class imbalance problem |
4,267 |
4 |
20
|
73
|
42 |
51 |
7 |
| Survival analysis—time-to-event data and censoring |
3,974 |
5 |
17
|
68
|
12 |
11 |
4 |
| Uncertainty and the management of epidemics |
3,671 |
2 |
21
|
70
|
6 |
9 |
7 |
| Analyzing outliers: robust methods to the rescue |
3,665 |
2 |
25
|
50
|
20 |
18 |
3 |
| Neural networks primer |
3,210 |
5 |
16
|
67
|
4 |
5 |
4 |
| Graphical assessment of tests and classifiers |
2,245 |
2 |
26
|
82
|
8 |
6 |
11 |
| Regression modeling of time-to-event data with censoring |
2,052 |
3 |
12
|
71
|
4 |
5 |
5 |
| Comparing classifier performance with baselines |
1,701 |
7 |
28
|
76
|
0 |
0 |
7 |
| Testing for rare conditions |
1,553 |
1 |
15
|
60
|
3 |
3 |
4 |
| Errors in predictor variables |
1,345 |
4 |
3
|
30
|
1 |
1 |
1 |
| Propensity score matching |
1,102 |
15 |
16
|
57
|
0 |
0 |
2 |
|
3,062,373 |
988 |
52 |
82 |
5,039 |
5,977 |
%NM percentile rank (avg 52) for the article of tracked articles of a similar age in Nature Methods.
%ALL percentile rank (avg 82) for the article of tracked articles of a similar age in all journals.
Total accesses 3,062,373.
Total citations 6,281 = sum(maxi(webscience,crossref)).
news
+ thoughts
Mon 17-03-2025
The needs of the many outweigh the needs of the few. —Mr. Spock (Star Trek II)
This month, we explore a related and powerful technique to address bias: propensity score weighting (PSW), which applies weights to each subject instead of matching (or discarding) them.

▲ Nature Methods Points of Significance column: Propensity score weighting.
(
read)
Kurz, C.F., Krzywinski, M. & Altman, N. (2025) Points of significance: Propensity score weighting. Nat. Methods 22:1–3.
Thu 13-03-2025
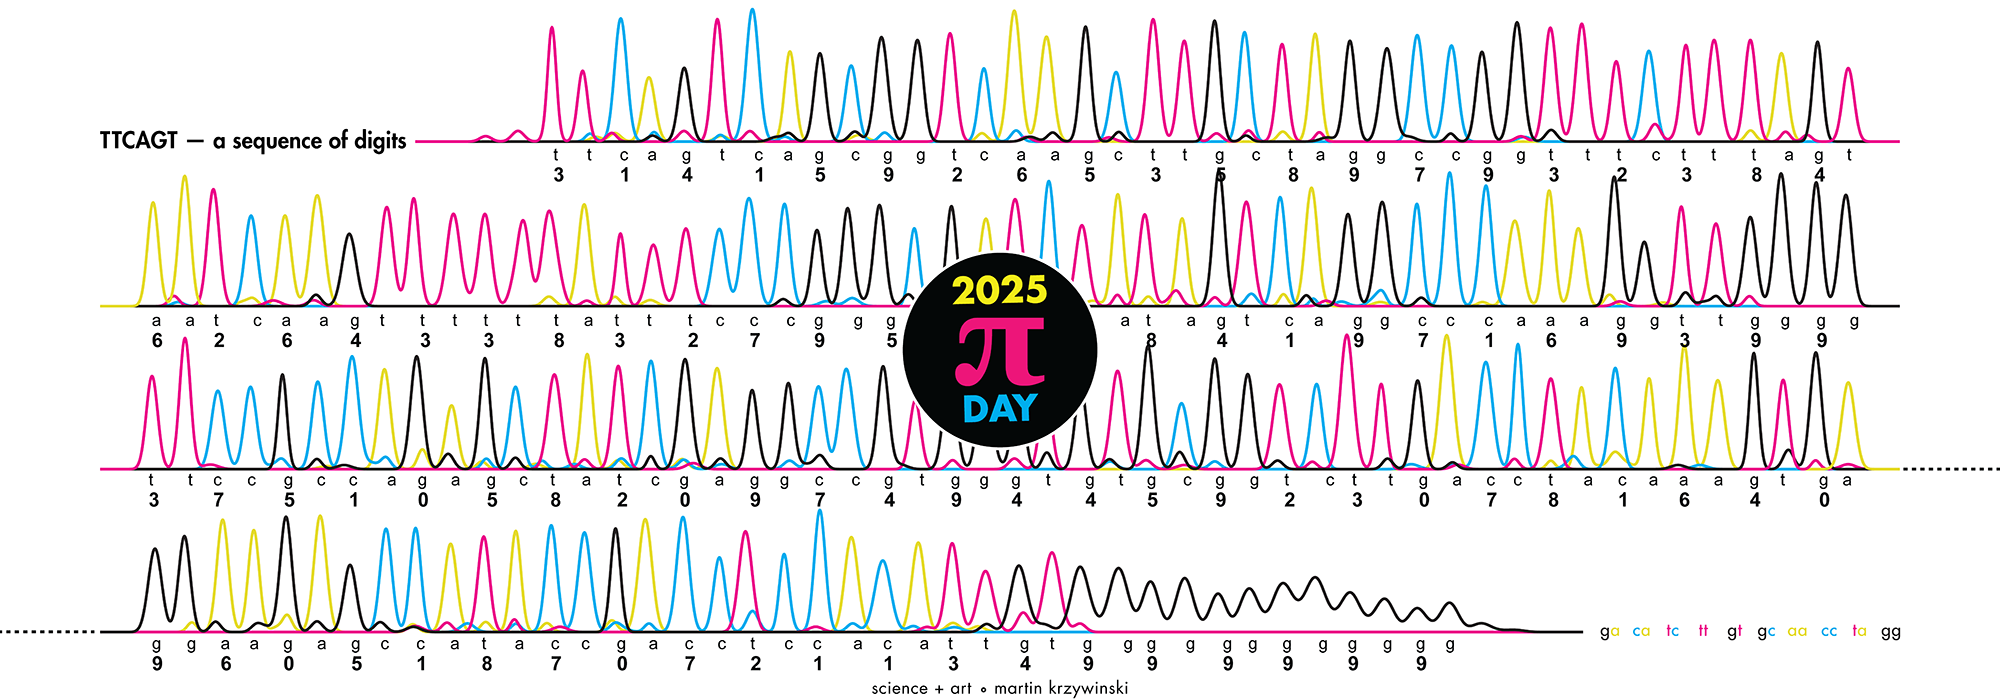
Celebrate Ï Day (March 14th) and sequence digits like its 1999. Let's call some peaks.

▲ 2025 Ï DAY | TTCAGT: a sequence of digits. The digits of Ï are encoded into DNA sequence and visualized with Sanger sequencing.
(
details)
Sun 09-03-2025
I donât have good luck in the match points. —Rafael Nadal, Spanish tennis player
Points of Significance is an ongoing series of short articles about statistics in Nature Methods that started in 2013. Its aim is to provide clear explanations of essential concepts in statistics for a nonspecialist audience. The articles favor heuristic explanations and make extensive use of simulated examples and graphical explanations, while maintaining mathematical rigor.
Topics range from basic, but often misunderstood, such as uncertainty and P-values, to relatively advanced, but often neglected, such as the error-in-variables problem and the curse of dimensionality. More recent articles have focused on timely topics such as modeling of epidemics, machine learning, and neural networks.
In this article, we discuss the evolution of topics and details behind some of the story arcs, our approach to crafting statistical explanations and narratives, and our use of figures and numerical simulations as props for building understanding.

▲ Crafting 10 Years of Statistics Explanations: Points of Significance.
(
read)
Altman, N. & Krzywinski, M. (2025) Crafting 10 Years of Statistics Explanations: Points of Significance. Annual Review of Statistics and Its Application 12:69–87.
Mon 16-09-2024
I donât have good luck in the match points. —Rafael Nadal, Spanish tennis player
In many experimental designs, we need to keep in mind the possibility of confounding variables, which may give rise to bias in the estimate of the treatment effect.

▲ Nature Methods Points of Significance column: Propensity score matching.
(
read)
If the control and experimental groups aren't matched (or, roughly, similar enough), this bias can arise.
Sometimes this can be dealt with by randomizing, which on average can balance this effect out. When randomization is not possible, propensity score matching is an excellent strategy to match control and experimental groups.
Kurz, C.F., Krzywinski, M. & Altman, N. (2024) Points of significance: Propensity score matching. Nat. Methods 21:1770–1772.