Sky Constellation Shapes and Resources
null
from an undefined
place,
undefined
create (a place)
an account
of us
— Viorica Hrincu
Having recently drawn a few skycharts (Superclusters & Voids, Sanctuary Project), I was frustrated by the lack of parsable resources for the Constellations. Not being able to find a plain-text parsable definition of the constellation figures proved impossible, I created my own.
Quotes on this page are from my conversation with the folks at Sky & Telescope and IAU.
contents
You might be surprised to learn (I certainly was) that while the International Astronomial Union has a working group on stars names (WGSN), nobody is actually in charge of defining a canonical set of constellation shapes. I know — the horror, the horror.
While the IAU constellation boundaries, constellation names, and star
names have 'official' IAU values/names, the lines connecting the stars
are subject to the artist.
—Eric Mamajek
(chair, IAU WG Star Names)
While the IAU maintains a page of constellation maps, these maps were actually produced at Sky & Telescope magazine by Roger Sinnott, who put out the excellent Pocket Sky Atlas.
“The constellation figures on the IAU set of charts came from
Sky & Telescope, where they were designed by Alan MacRobert and have
been used in the magazine since the early 1990s. They aren't official
in any sense, but Alan did give them a lot of careful thought.”
— Roger Sinnott (Sky & Telescope)
The constellation shapes themselves were designed for Sky & Telescope by Alan MacRobert. Alan was influenced by shapes drawn by H.A. Rey in his book Stars: A New Way to See Them but in many cases adjusted them to preserve earlier traditions.
“I'm gratified at how the astronomical world has been
gravitating to our constellation figures over the years, starting
with the IAU. I put a great deal of thought into them.”
— Alan MacRobert (Sky & Telescope)
A figure for a constellation may connect to one or more neighbouring figures. For example, the figure of Carina connects to Puppis and Vela.

Some connections terminate short of their endpoint — these gaps were intentionally included by Alan in his original designs. The gaps are indicated by a flag in the figure records and a unit vector along the line is included on either end to help you draw the line short of its end.
In the case of Carina (above), you can see that its connections to the stars of Vela and Puppis have a gap.
Two other examples (of many) are Hydra and Orion.

“There are other cases, too, when our lines do not quite connect to
stars. For example, in the long serpentine figure of Hydra, we
intentionally left short gaps around α and β Crateris. That's
because those stars officially belong to Crater, rather than Hydra,
even though they take part in the geometrical figures of both.”
— Roger Sinnott (Sky &
Telescope)

“Alan [added gaps] quite consciously, to give the simple
geometric figure a shape more like a man with two legs (i.e., like
Orion, the Hunter, in mythology). And as a hunter, Orion has a raised
arm (the single line from α Orionis to μ and
the ξ–ν pair) wielding a heavy club (outlined
by ξ–ν–χ1–χ2).
Among the charts there are several other cases of a line going to the
rough midpoint of two close stars, because the observer thinks of them
as a pair rather than two distinct stars.”
— [Roger
Sinnott](https://skyandtelescope.org/about-us/roger-w-sinnott/) (Sky &
Telescope)
Connections of figures do not intersect except for the edge case of Carina and Volans. The α–β connection of Carina crosses Volans and intersects its α–β and α–ε connections.
This resolved by introducing a gap in the Carina α–β line.

“I forgot to mention one more situation where a gap occurs in
the [figure] of a constellation, at least as implemented in our
S&T software. We did not want a line belonging to one constellation
to cross or intersect a line of another constellation. The best
example (maybe the only example) appears on the attached chart of
Volans.”
— Roger Sinnott (Sky & Telescope)
The α–β gap is not encoded in my file because its position depends on the projection.
“In our software, we took care of this and other gaps in lines
by adding fictitious stars to the database for the lines to end
on. These fictitious stars lie on the great circle between the two
real stars that define the line. This way, a graphic artist who
finalizes a chart does not have to remember to insert needed gaps
manually.”
— Roger Sinnott (Sky & Telescope)
I had a great exchange with Alan about the figures.
Here, he comments about his design philosophy.
Each [figure] is a compromise between competing priorities.
The lines must include the lines that the eye can't help but naturally
see. Two bright stars near each other must be connected because
that's what the eye does, no escaping it.
Figures should look like the thing named if reasonably possible. I
started with H. A. Rey's groundbreaking figures in his constellation
guide The Stars, a New Way to See Them (1952).
But Rey committed four sins.
1 — He occasionally fudged star positions
slightly to make his figures work better.
2 — He sometimes used stars too
faint for most modern skywatchers to see.
3 — He often connected stars
with line patterns too complicated for the eye to see easily, while
skipping the lines between brighter stars that the eye can't help but
see.
4 — And, he paid no attention to the constellations' deep heritage in how they have been oriented and depicted since Greco-Roman times. This
often makes them conflict with the representations that were the basis
of it all and that are seen throught astronomy literature.
I tried to make realistic stick figures that did match ancient
representations, as recorded in the Almagest star names ('foot,'
'knee', 'tail', etc.) and old depictions going back to the Farnese Globe.
— Alan MacRobert (Sky & Telescope)

The Virgo I eventually came up with, for instance, not only
matches her ancient arrangement but for the first time, as far as I
know, matches her activity: holding the ear of grain Spica in one hand
and sowing seeds on the springtime fields with her other hand.
I suspect that I rediscovered the original Virgo as seen by farmers
and herdsmen outdoors at night before the 'fine arts' took over
(starting with the artist hired to paint the constellations on a
ceiling in the palace of Philip of Macedon. A king doesn't want grubby
shepherds' stick figures, he wants Fine Art to show off. And so it
began.)
— Alan MacRobert (Sky & Telescope)

Similarly, I went with the Hercules who has 'Head of the Giant' as
his head star, 'Knee' as his knee star, and 'Club' as the top of his
club.
This makes Hercules hold out his lion skin in front of him,
echoing Orion also waving a club over his head and holding out a lion
skin in front of him. I doubt that was a coincidence.
— Alan MacRobert (Sky & Telescope)

And I made sure that Lupus is being stabbed in the
throat by Centaurus thrusting a spear.
— Alan MacRobert (Sky & Telescope)

But a few just had to be what everybody now sees.
Cassiopeia is a W no matter what — even though her stars, including
fainter ones connected in the ancient order by name from head to foot,
suggest an evocative profile outline of a grieving woman.
— Alan MacRobert (Sky & Telescope)

...and Sagittarius is a teapot, even though H. A. Ray's version is
more or less historically correct, bow and arrow and all as far as I
could tell.
— Alan MacRobert (Sky & Telescope)
This file contains all the information you need to draw basic star maps (with name and designation labels) and constellation figures. It is the most complete (and self-contained) sky constellation dataset of its kind — if you find something better, let me know!
To learn more, read the detailed explanation of this file.
Propensity score matching
I don’t have good luck in the match points. —Rafael Nadal, Spanish tennis player
In many experimental designs, we need to keep in mind the possibility of confounding variables, which may give rise to bias in the estimate of the treatment effect.

If the control and experimental groups aren't matched (or, roughly, similar enough), this bias can arise.
Sometimes this can be dealt with by randomizing, which on average can balance this effect out. When randomization is not possible, propensity score matching is an excellent strategy to match control and experimental groups.
Kurz, C.F., Krzywinski, M. & Altman, N. (2024) Points of significance: Propensity score matching. Nat. Methods 21:1770–1772.
Nasa to send our human genome discs to the Moon
We'd like to say a ‘cosmic hello’: mathematics, culture, palaeontology, art and science, and ... human genomes.


Comparing classifier performance with baselines
All animals are equal, but some animals are more equal than others. —George Orwell
This month, we will illustrate the importance of establishing a baseline performance level.
Baselines are typically generated independently for each dataset using very simple models. Their role is to set the minimum level of acceptable performance and help with comparing relative improvements in performance of other models.

Unfortunately, baselines are often overlooked and, in the presence of a class imbalance, must be established with care.
Megahed, F.M, Chen, Y-J., Jones-Farmer, A., Rigdon, S.E., Krzywinski, M. & Altman, N. (2024) Points of significance: Comparing classifier performance with baselines. Nat. Methods 21:546–548.
Happy 2024 π Day—
sunflowers ho!
Celebrate π Day (March 14th) and dig into the digit garden. Let's grow something.

How Analyzing Cosmic Nothing Might Explain Everything
Huge empty areas of the universe called voids could help solve the greatest mysteries in the cosmos.
My graphic accompanying How Analyzing Cosmic Nothing Might Explain Everything in the January 2024 issue of Scientific American depicts the entire Universe in a two-page spread — full of nothing.
The graphic uses the latest data from SDSS 12 and is an update to my Superclusters and Voids poster.
Michael Lemonick (editor) explains on the graphic:
“Regions of relatively empty space called cosmic voids are everywhere in the universe, and scientists believe studying their size, shape and spread across the cosmos could help them understand dark matter, dark energy and other big mysteries.
To use voids in this way, astronomers must map these regions in detail—a project that is just beginning.
Shown here are voids discovered by the Sloan Digital Sky Survey (SDSS), along with a selection of 16 previously named voids. Scientists expect voids to be evenly distributed throughout space—the lack of voids in some regions on the globe simply reflects SDSS’s sky coverage.”
voids
Sofia Contarini, Alice Pisani, Nico Hamaus, Federico Marulli Lauro Moscardini & Marco Baldi (2023) Cosmological Constraints from the BOSS DR12 Void Size Function Astrophysical Journal 953:46.
Nico Hamaus, Alice Pisani, Jin-Ah Choi, Guilhem Lavaux, Benjamin D. Wandelt & Jochen Weller (2020) Journal of Cosmology and Astroparticle Physics 2020:023.
Sloan Digital Sky Survey Data Release 12
constellation figures
Alan MacRobert (Sky & Telescope), Paulina Rowicka/Martin Krzywinski (revisions & Microscopium)
stars
Hoffleit & Warren Jr. (1991) The Bright Star Catalog, 5th Revised Edition (Preliminary Version).
cosmology
H0 = 67.4 km/(Mpc·s), Ωm = 0.315, Ωv = 0.685. Planck collaboration Planck 2018 results. VI. Cosmological parameters (2018).
Error in predictor variables
It is the mark of an educated mind to rest satisfied with the degree of precision that the nature of the subject admits and not to seek exactness where only an approximation is possible. —Aristotle
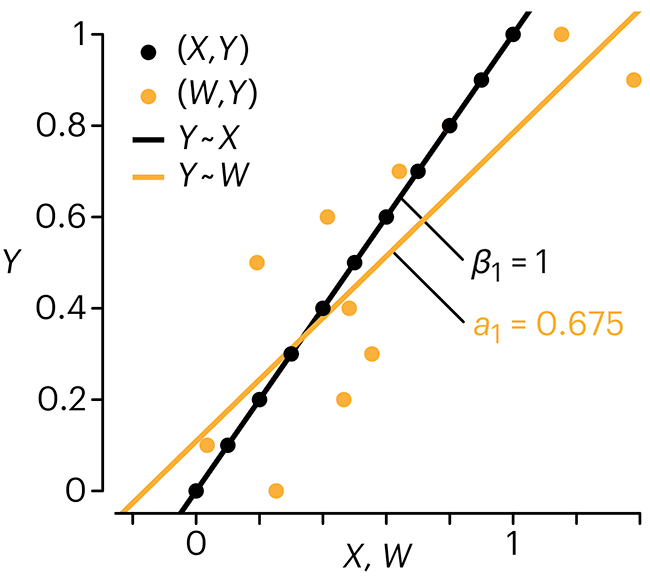
In regression, the predictors are (typically) assumed to have known values that are measured without error.
Practically, however, predictors are often measured with error. This has a profound (but predictable) effect on the estimates of relationships among variables – the so-called “error in variables” problem.

Error in measuring the predictors is often ignored. In this column, we discuss when ignoring this error is harmless and when it can lead to large bias that can leads us to miss important effects.
Altman, N. & Krzywinski, M. (2024) Points of significance: Error in predictor variables. Nat. Methods 21:4–6.
Background reading
Altman, N. & Krzywinski, M. (2015) Points of significance: Simple linear regression. Nat. Methods 12:999–1000.
Lever, J., Krzywinski, M. & Altman, N. (2016) Points of significance: Logistic regression. Nat. Methods 13:541–542 (2016).
Das, K., Krzywinski, M. & Altman, N. (2019) Points of significance: Quantile regression. Nat. Methods 16:451–452.


