


Sky Constellation Shapes and Resources
null
from an undefined
place,
undefined
create (a place)
an account
of us
— Viorica Hrincu
Having recently drawn a few skycharts (Superclusters & Voids, Sanctuary Project), I was frustrated by the lack of parsable resources for the Constellations. Not being able to find a plain-text parsable definition of the constellation figures proved impossible, I created my own.
Quotes on this page are from my conversation with the folks at Sky & Telescope and IAU.
contents
- 1 · Constellation figures
- 1.1 · Contents
- 1.1.1 · Bright Star Catalogue
- 1.1.2 · Constellation figure paths
- 1.1.3 · Constellation figure lines
- 1.1.4 · Constellation boundary lines
- 1.1.5 · Constellation boundary paths
- 1.2 · Changes
- 1.3 · Corrections
- 1.4 · Sky & Telescope magazine format
- 2 · Bitmap, SVG and PDF constellation shapes
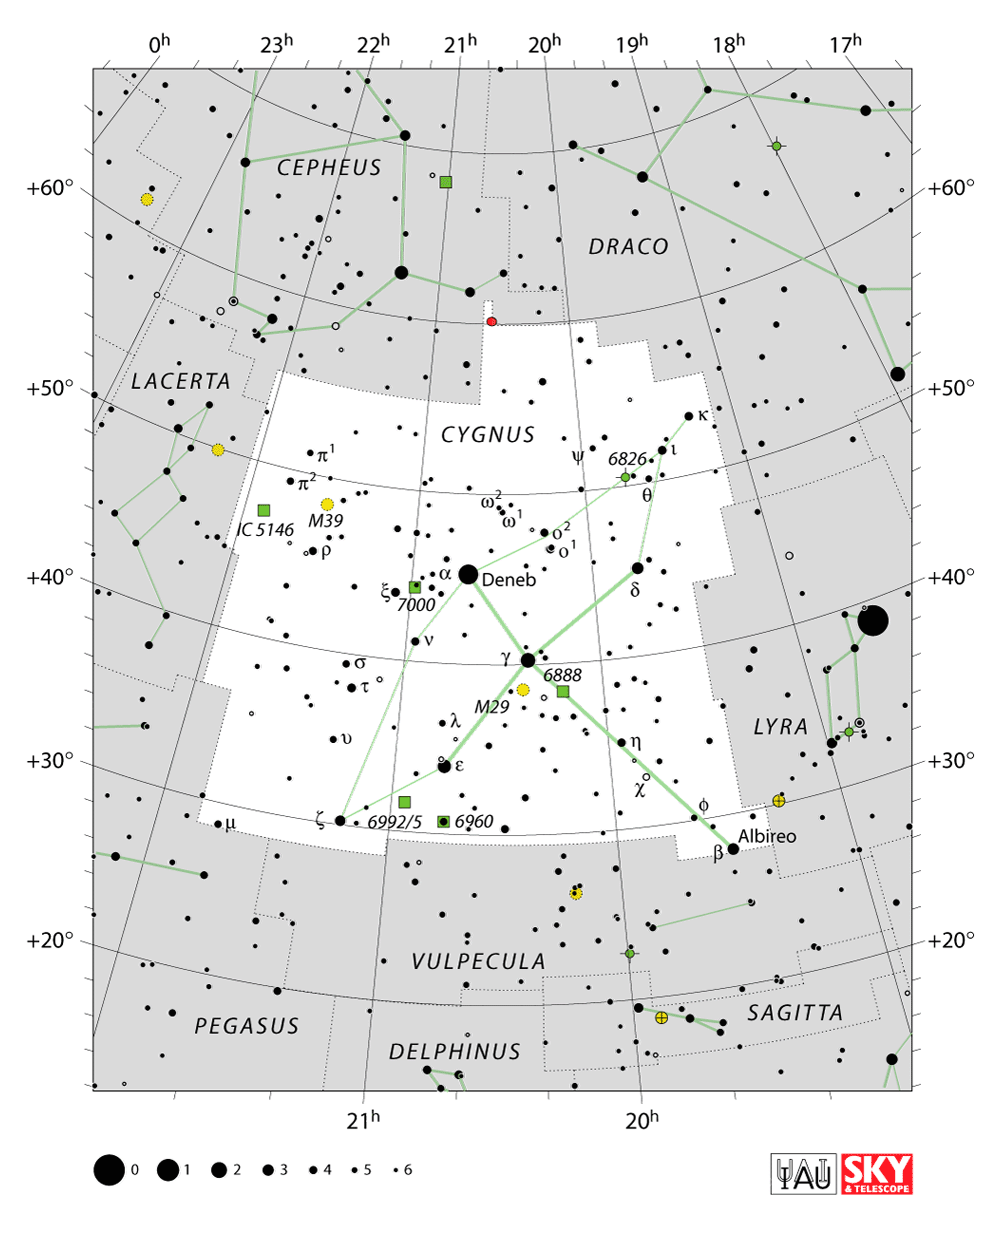
The figures are based on the set drawn by Alan MacRobert for Sky and Telescope. These figures are used in Sky & Telescope's Pocket Sky Atlas by Roger Sinnott and appear in the Wikipedia entries for each constellation as well as on pages by the International Astronomical Union (IAU).
This file contains all the information you need to draw basic star maps (with name and designation labels) and constellation figures.
The file contains a long header that explains the contents. It has been formatted to be friendly to UNIX-style command-line tools — grep away!
This is the most complete (and self-contained) sky constellation dataset of its kind.
All stars in the Yale Bright Star Catalogue are reported (9,114 entries, see below). Each star has an entry like this
where the fields are
The Yale Bright Star Catalogue has 9,110 star entries. There are four additional entries in my file: HR 9602, HR 4796/4796A, HR 5727/5728 and HR 8799/8799A.
These entries are the consequence of SIMBAD records having more than one HR index value.
Each of the 88 constellations has its figure summarized in a line like this
The line reports the figure as a set of comma-delimited connections, each represented by a start and end point, which are identified by the corresponding star's HR index and its Bayer (or Flamsteed) designation. The thickness (which can be 1, 2 or 3) of the connection line is the middle digit.
For each constellation, each figure line is reported individually.
where the fields are
Piece-wise linear constellation boundaries are reported in conbound_pair lines. These boundaries are taken from https://vizier.cds.unistra.fr/viz-bin/VizieR-3?-source=VI/49/bound_18.
For example, the boundaries for Crux are
where each line reports a boundary line between two (ra,dec) points. The fields are
Each conbound_pair line is followed by a conbound_path line that reports the representation of the line segment along a great circle. This makes for nicer paths on maps using projections such as azimuthal equidistant.
 + added constellation boundaries

 + now all stars in Yale BSC are reported

 + records for line points that do not connect fully to a star
   (there's a gap between the end of the line and a star) are modified
   with ra/dec offsets

 + records for line points that are midpoints between two stars are
   annotated with the HR index of both stars

 + added shape for Microscopium, which is a wishbone analogous to
   Telescopium with the bonus that they point at each other

 + modified shape for Telescopium to be a wishbone by adding
   connection between alpha and midpoint between delta 1 and 2.
 + magnitude of alpha Com fixed to 4.32 from 5.08, which is the V
   magnitude reported in SIMBAD.

 + fixed midpointa 31-o3 (in Cygnus, which was a little off, as can be
   seen on this map

   old  3    20.25019  42.5288 31-o3Cyg 7735,7751
   new  3.8  20.24253  42.7722 31-o3Cyg 7735,7751

   The stars have Simbad V magnitude 3.8 (31 Omi, o1) and
   3.98 (31 Cyg, omi2), so the brighter is used.

 + The second entry for delta Vela had a slightly different ra/de

    1.95  8.74506 144.7083 dlt 2Vel
    ...
    5.1   8.74469 144.7003 dlt 2Vel

   I could not find a reason for this -- tt may be that the second
   record refers to delta Vel B (delta Velorum is a triple star
   system: Aa Ab and B).  These stars are extremely close to each
   other so I've changed the second record to point to delta Vel A
   (same as first record).
The data source for the constellation shapes was provided to be by Roger Sinnott in an in-house format used by Sky & Telescope's sky charting software.
I worked from this file to create edits and correction and provide an updated version of this file here. Unless you're working with the S&T software, you're likely to find the file linked to above more useful.
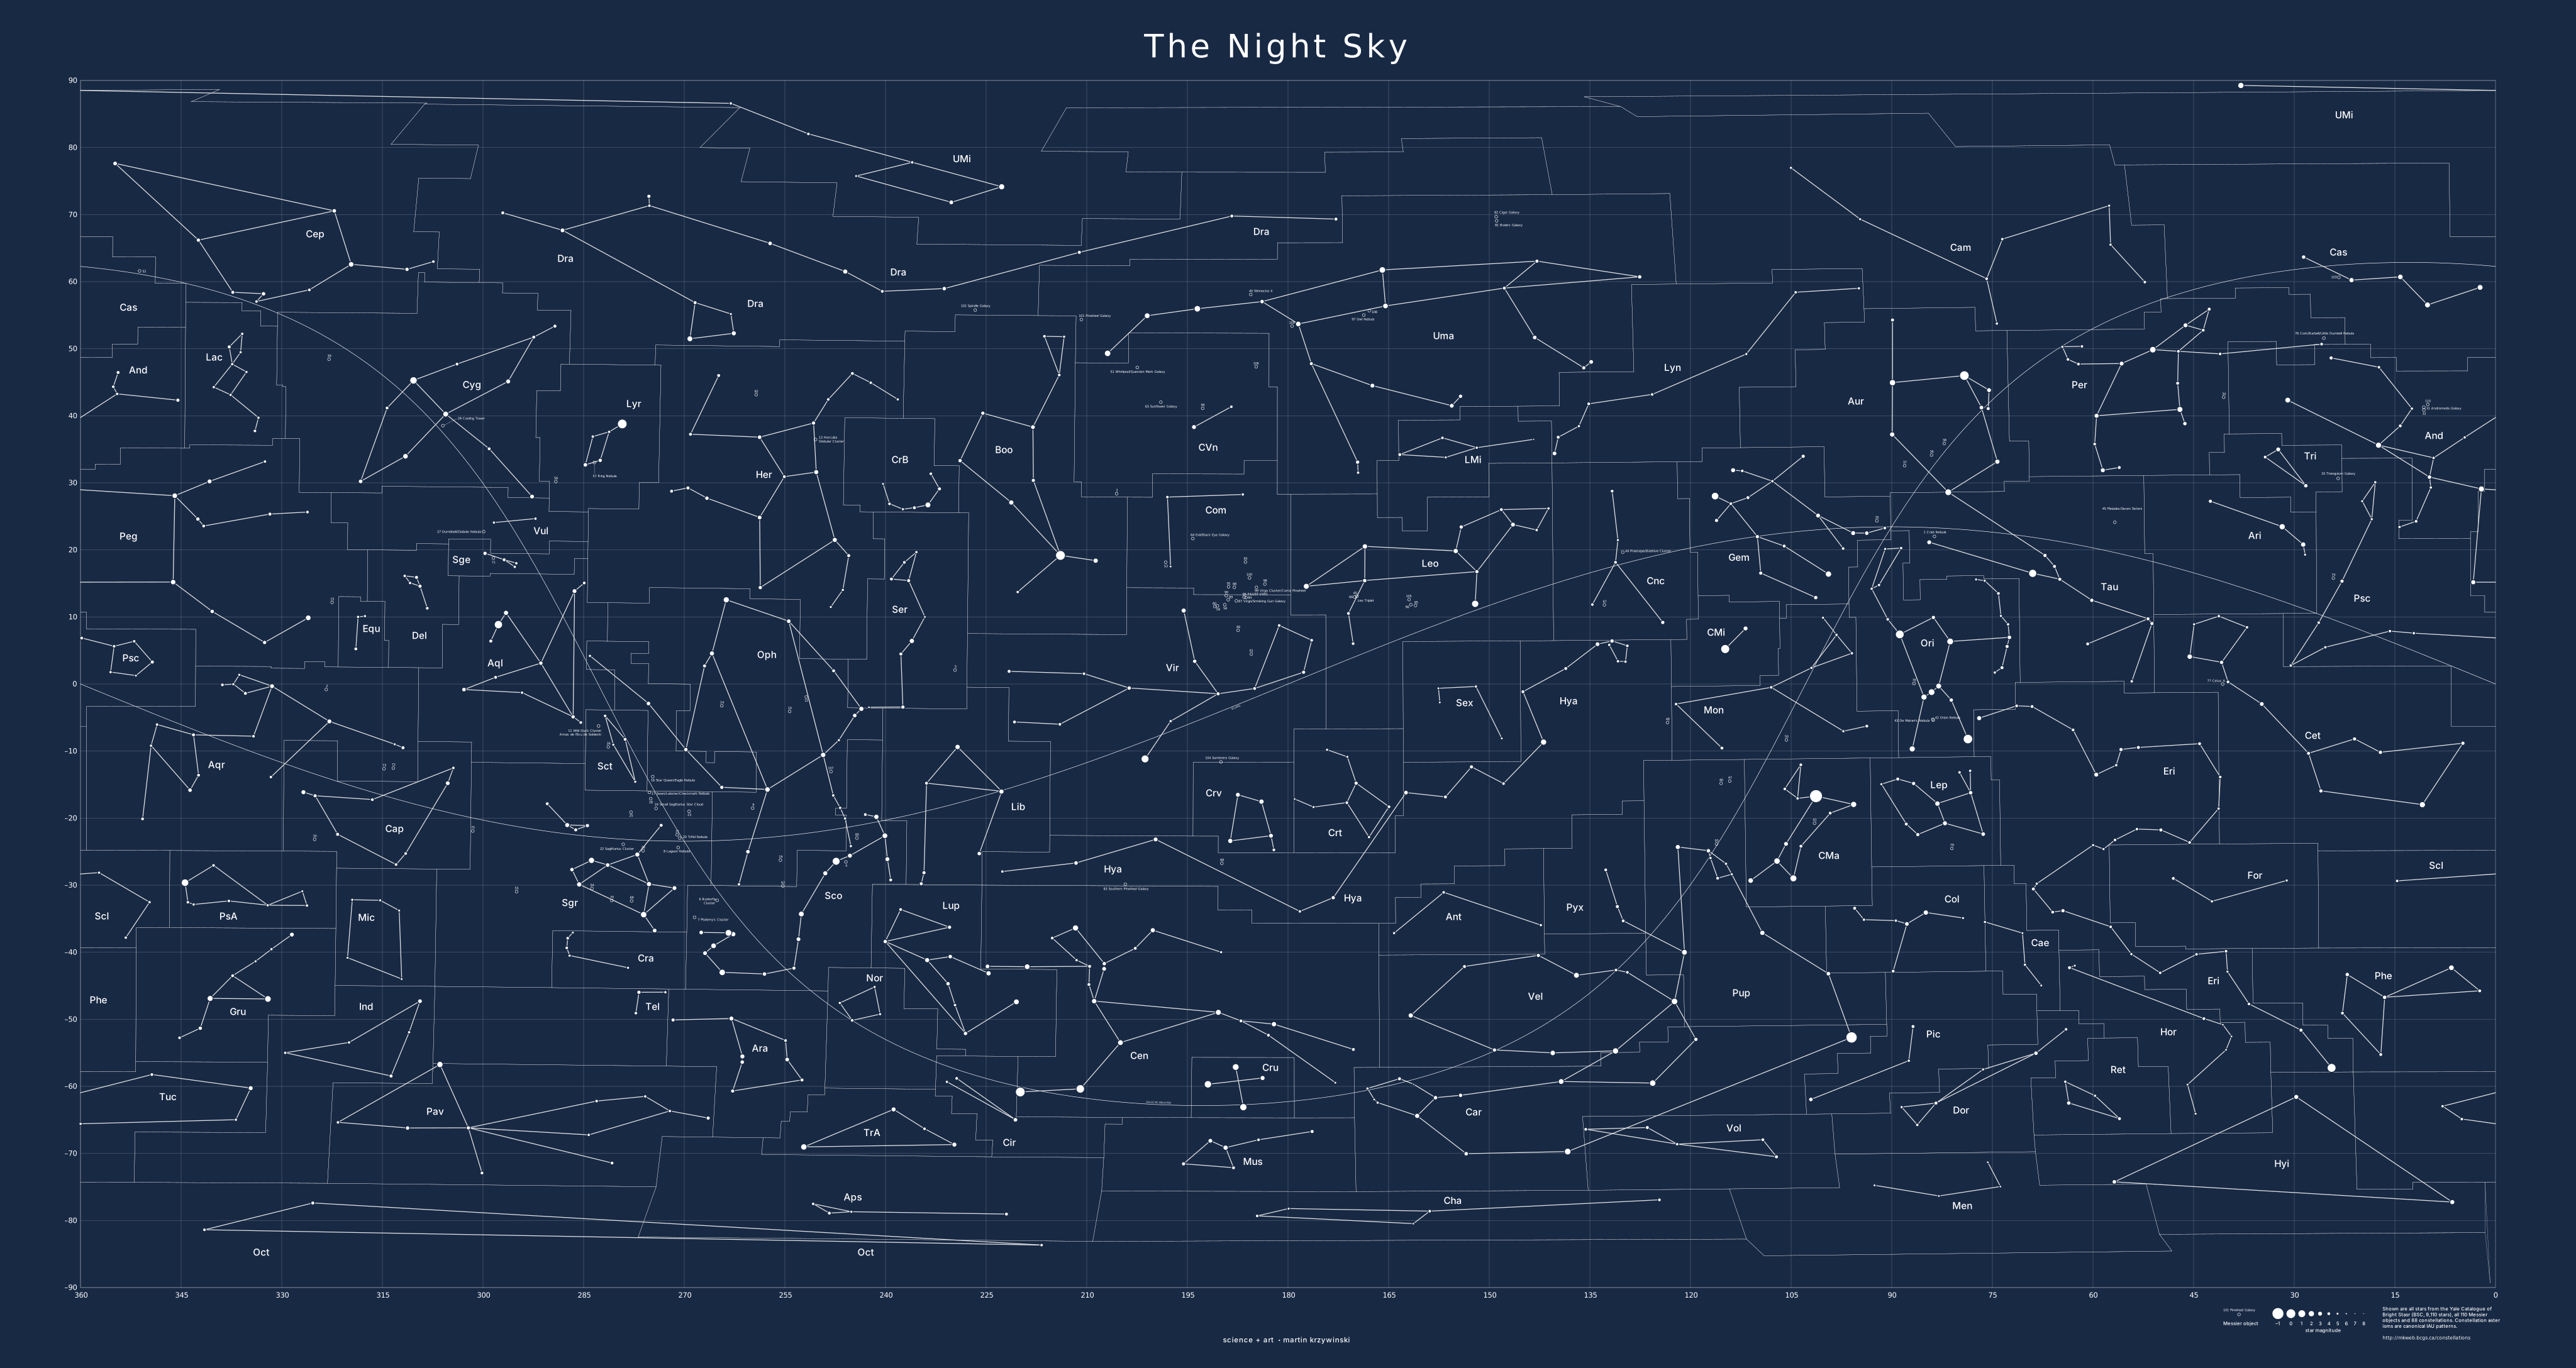
The shapes of all the constellations and the stars that define the asterisms shown in the image below. I also include all the 110 Messier objects with common names in this map (hollow circles).
The map also shows the galactic equator and the ecliptic. The vernal equinox, summer solstice, autumn equinox and winter solstice occur along the ecliptic at right ascension 0/360 (Pices), 270 (Sagittarius), 180 (Vigo) and 90 (Gemini/Taurus).
Whole-sky star charts are traditionally drawn with 360 right ascention on the left in decreasing order towards 0 on the right.

You can download this file as PNG, SVG or PDF.
If you're interested in more astronomical resources, check out my Universe Superclusters and Voids resource page.
Propensity score weighting
The needs of the many outweigh the needs of the few. —Mr. Spock (Star Trek II)
This month, we explore a related and powerful technique to address bias: propensity score weighting (PSW), which applies weights to each subject instead of matching (or discarding) them.
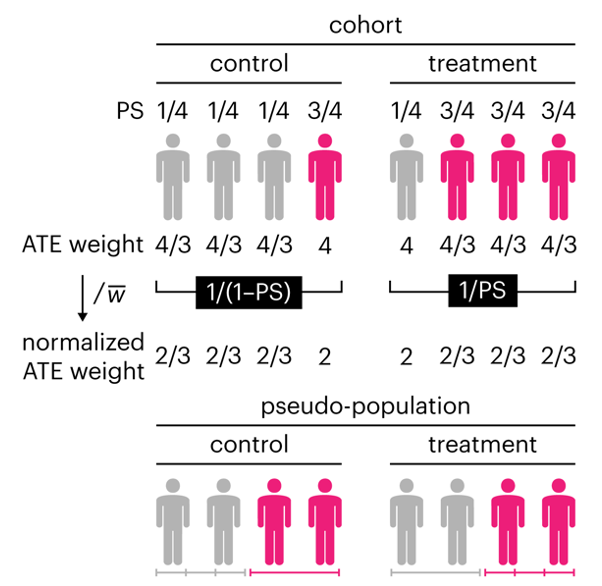
Kurz, C.F., Krzywinski, M. & Altman, N. (2025) Points of significance: Propensity score weighting. Nat. Methods 22:1–3.
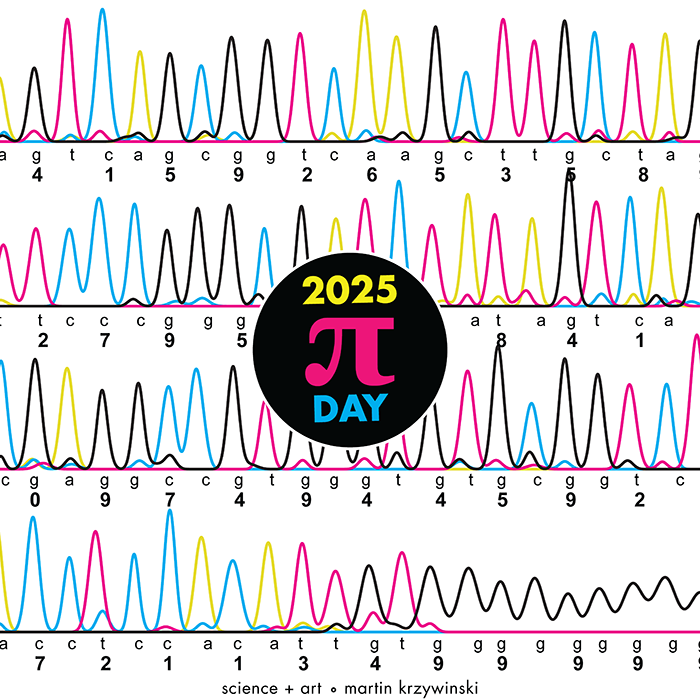
Happy 2025 π Day—
TTCAGT: a sequence of digits
Celebrate π Day (March 14th) and sequence digits like its 1999. Let's call some peaks.
Crafting 10 Years of Statistics Explanations: Points of Significance
I don’t have good luck in the match points. —Rafael Nadal, Spanish tennis player
Points of Significance is an ongoing series of short articles about statistics in Nature Methods that started in 2013. Its aim is to provide clear explanations of essential concepts in statistics for a nonspecialist audience. The articles favor heuristic explanations and make extensive use of simulated examples and graphical explanations, while maintaining mathematical rigor.
Topics range from basic, but often misunderstood, such as uncertainty and P-values, to relatively advanced, but often neglected, such as the error-in-variables problem and the curse of dimensionality. More recent articles have focused on timely topics such as modeling of epidemics, machine learning, and neural networks.
In this article, we discuss the evolution of topics and details behind some of the story arcs, our approach to crafting statistical explanations and narratives, and our use of figures and numerical simulations as props for building understanding.
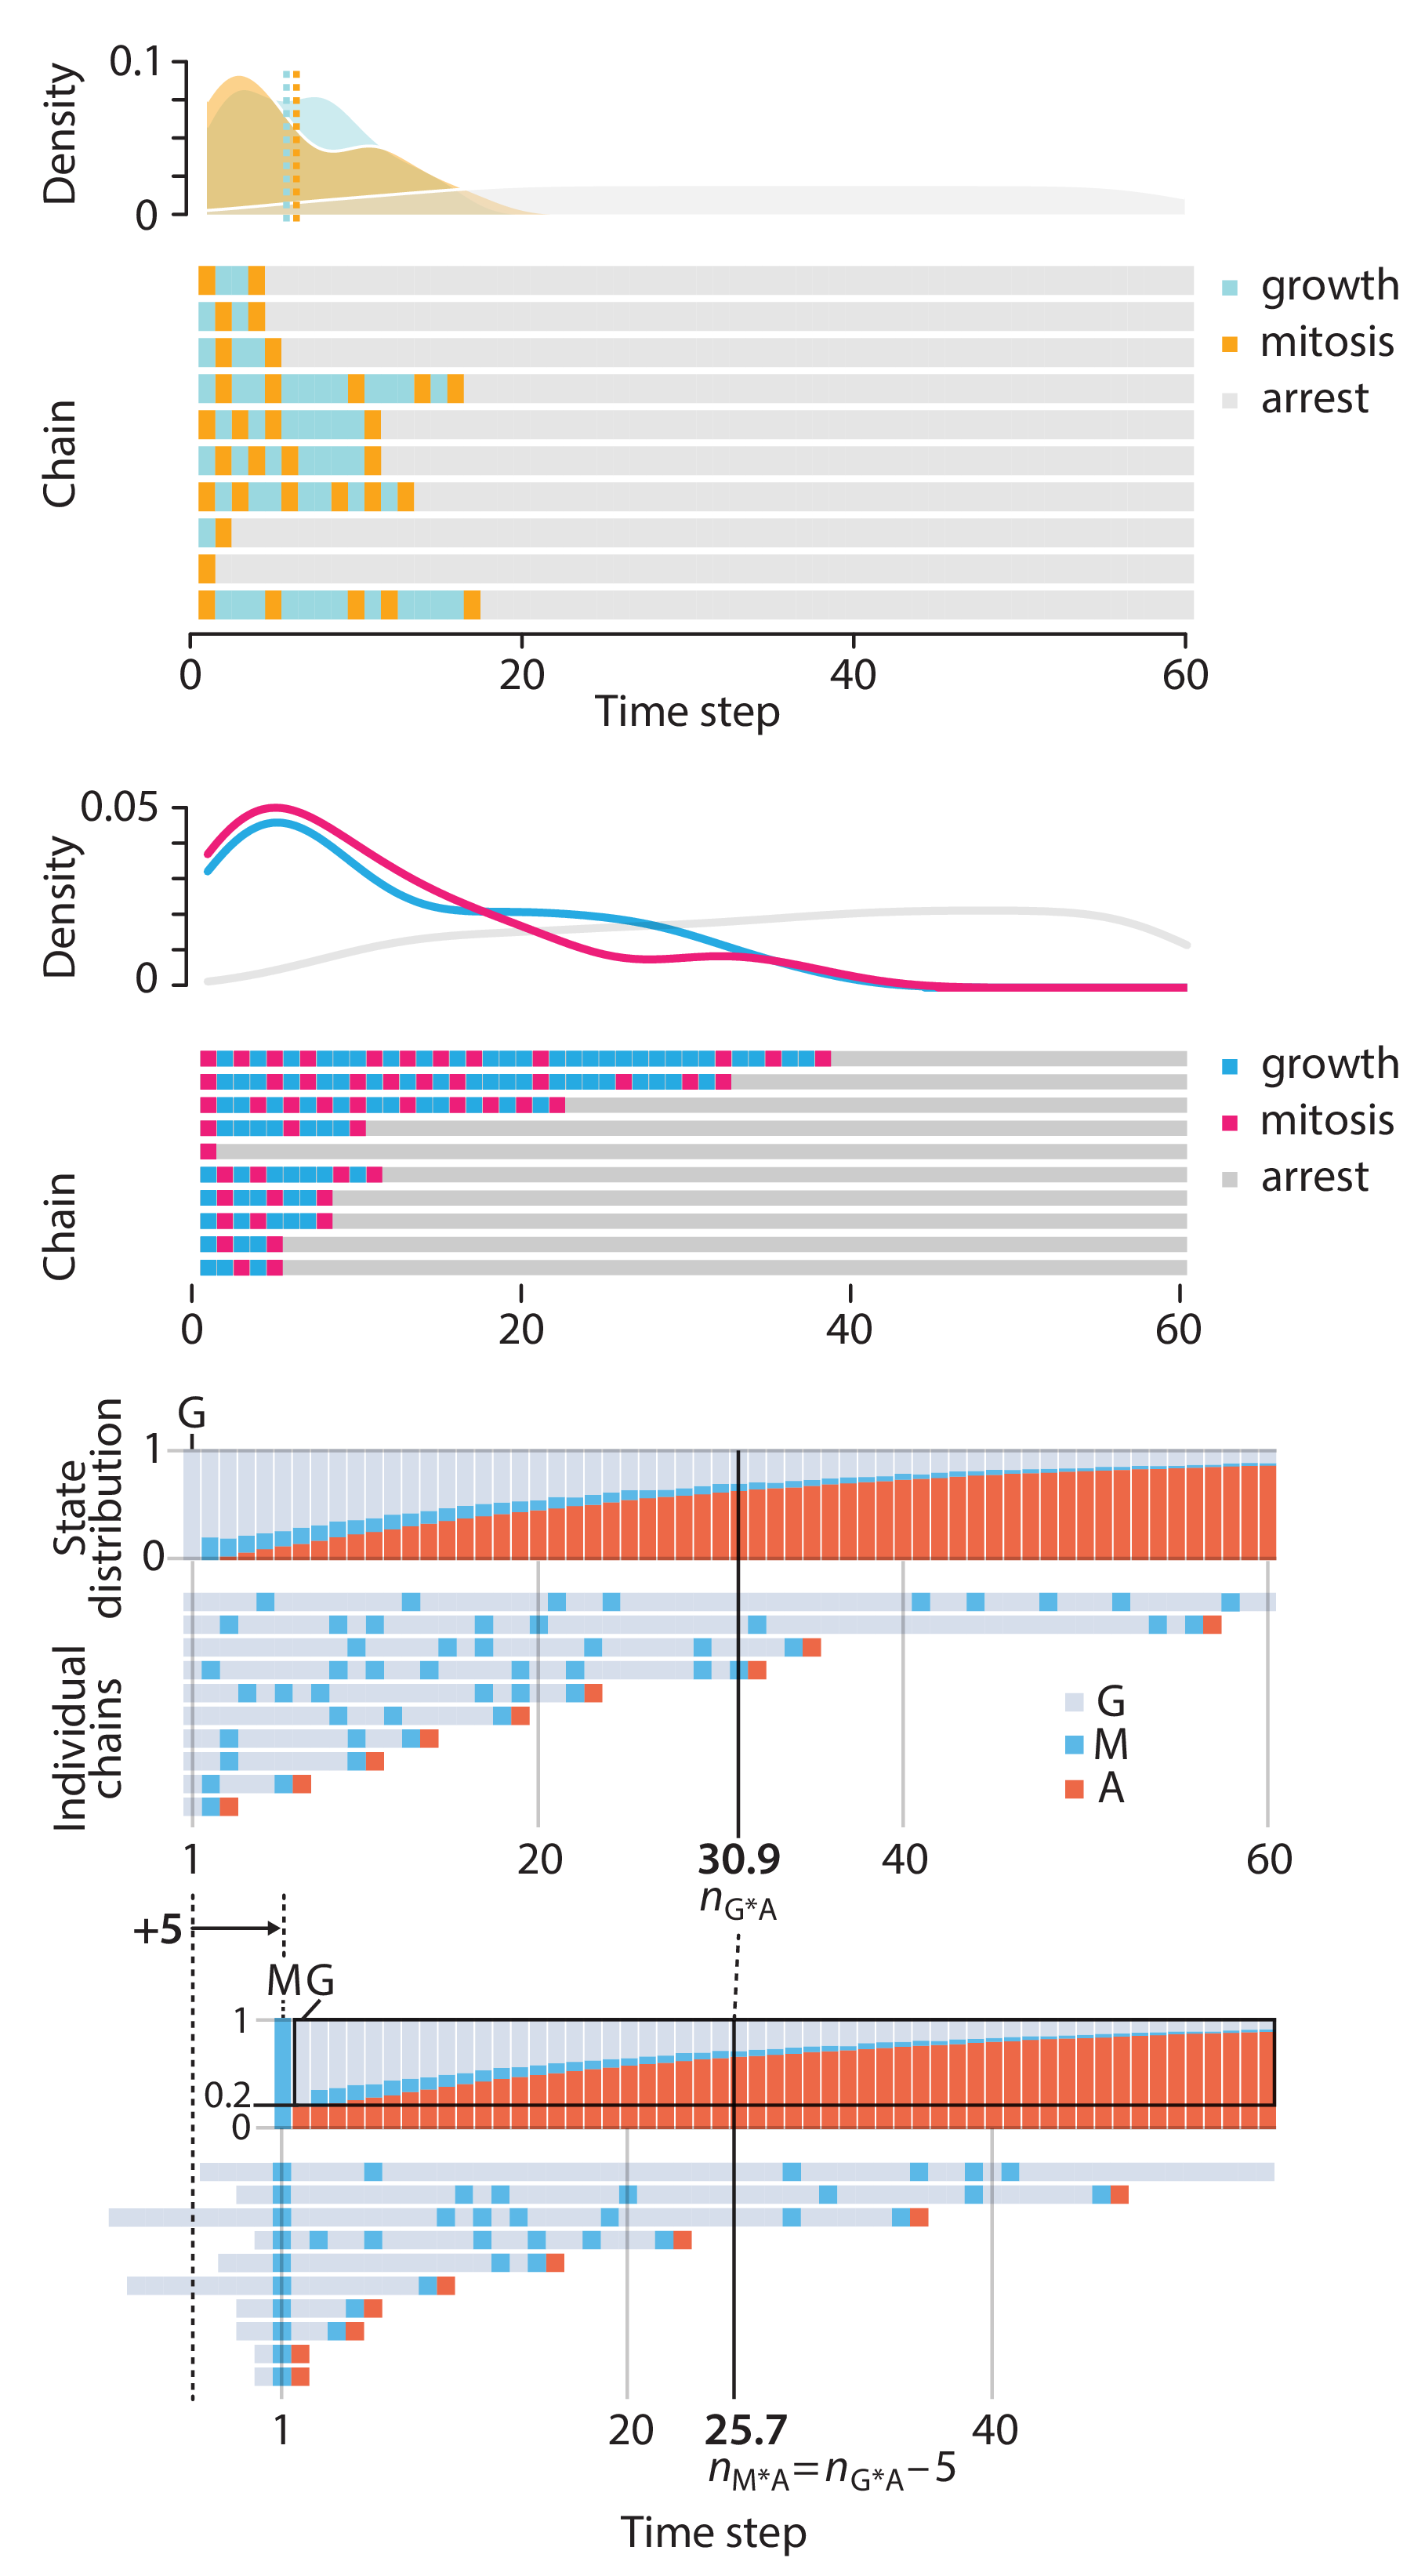
Altman, N. & Krzywinski, M. (2025) Crafting 10 Years of Statistics Explanations: Points of Significance. Annual Review of Statistics and Its Application 12:69–87.
Propensity score matching
I don’t have good luck in the match points. —Rafael Nadal, Spanish tennis player
In many experimental designs, we need to keep in mind the possibility of confounding variables, which may give rise to bias in the estimate of the treatment effect.
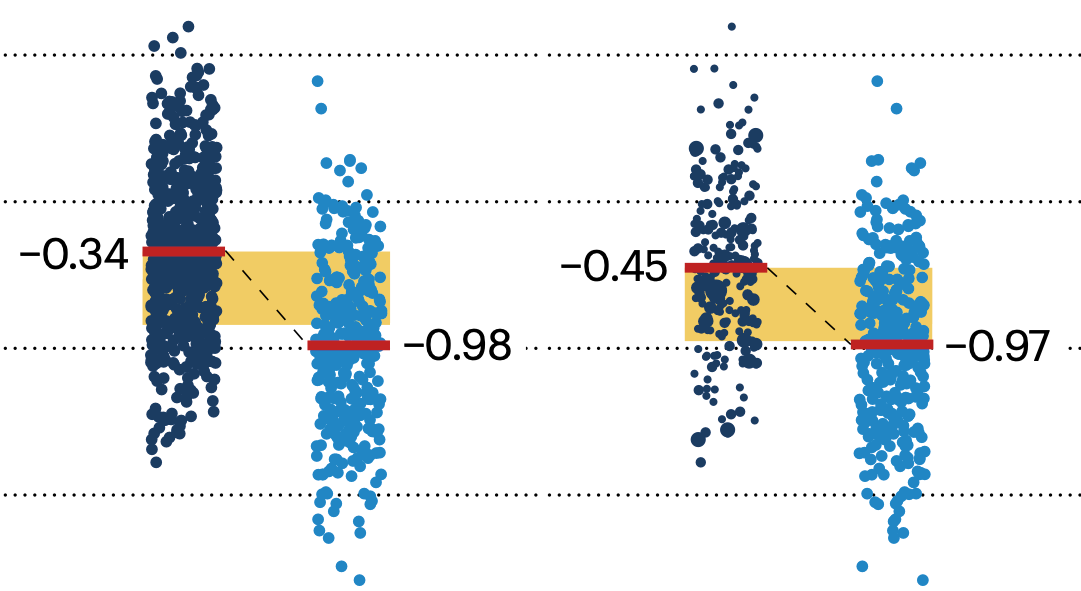
If the control and experimental groups aren't matched (or, roughly, similar enough), this bias can arise.
Sometimes this can be dealt with by randomizing, which on average can balance this effect out. When randomization is not possible, propensity score matching is an excellent strategy to match control and experimental groups.
Kurz, C.F., Krzywinski, M. & Altman, N. (2024) Points of significance: Propensity score matching. Nat. Methods 21:1770–1772.
Understanding p-values and significance
P-values combined with estimates of effect size are used to assess the importance of experimental results. However, their interpretation can be invalidated by selection bias when testing multiple hypotheses, fitting multiple models or even informally selecting results that seem interesting after observing the data.
We offer an introduction to principled uses of p-values (targeted at the non-specialist) and identify questionable practices to be avoided.
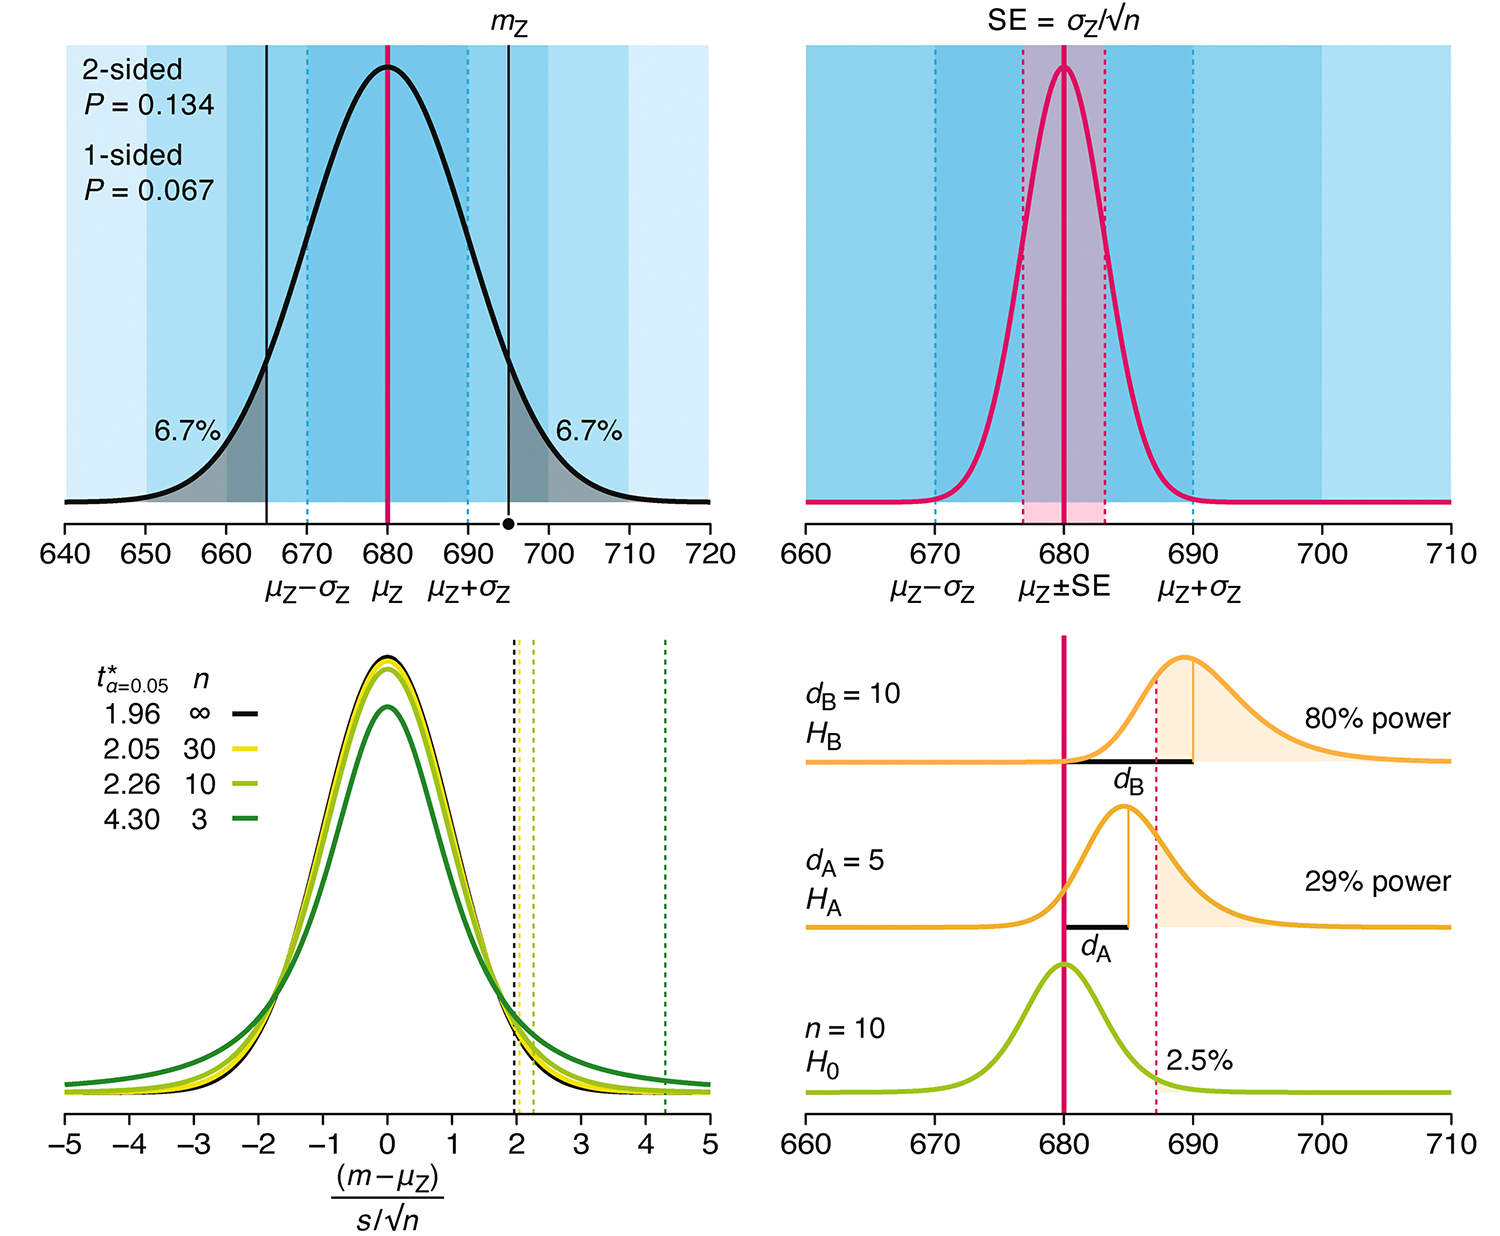
Altman, N. & Krzywinski, M. (2024) Understanding p-values and significance. Laboratory Animals 58:443–446.
Depicting variability and uncertainty using intervals and error bars
Variability is inherent in most biological systems due to differences among members of the population. Two types of variation are commonly observed in studies: differences among samples and the “error” in estimating a population parameter (e.g. mean) from a sample. While these concepts are fundamentally very different, the associated variation is often expressed using similar notation—an interval that represents a range of values with a lower and upper bound.
In this article we discuss how common intervals are used (and misused).
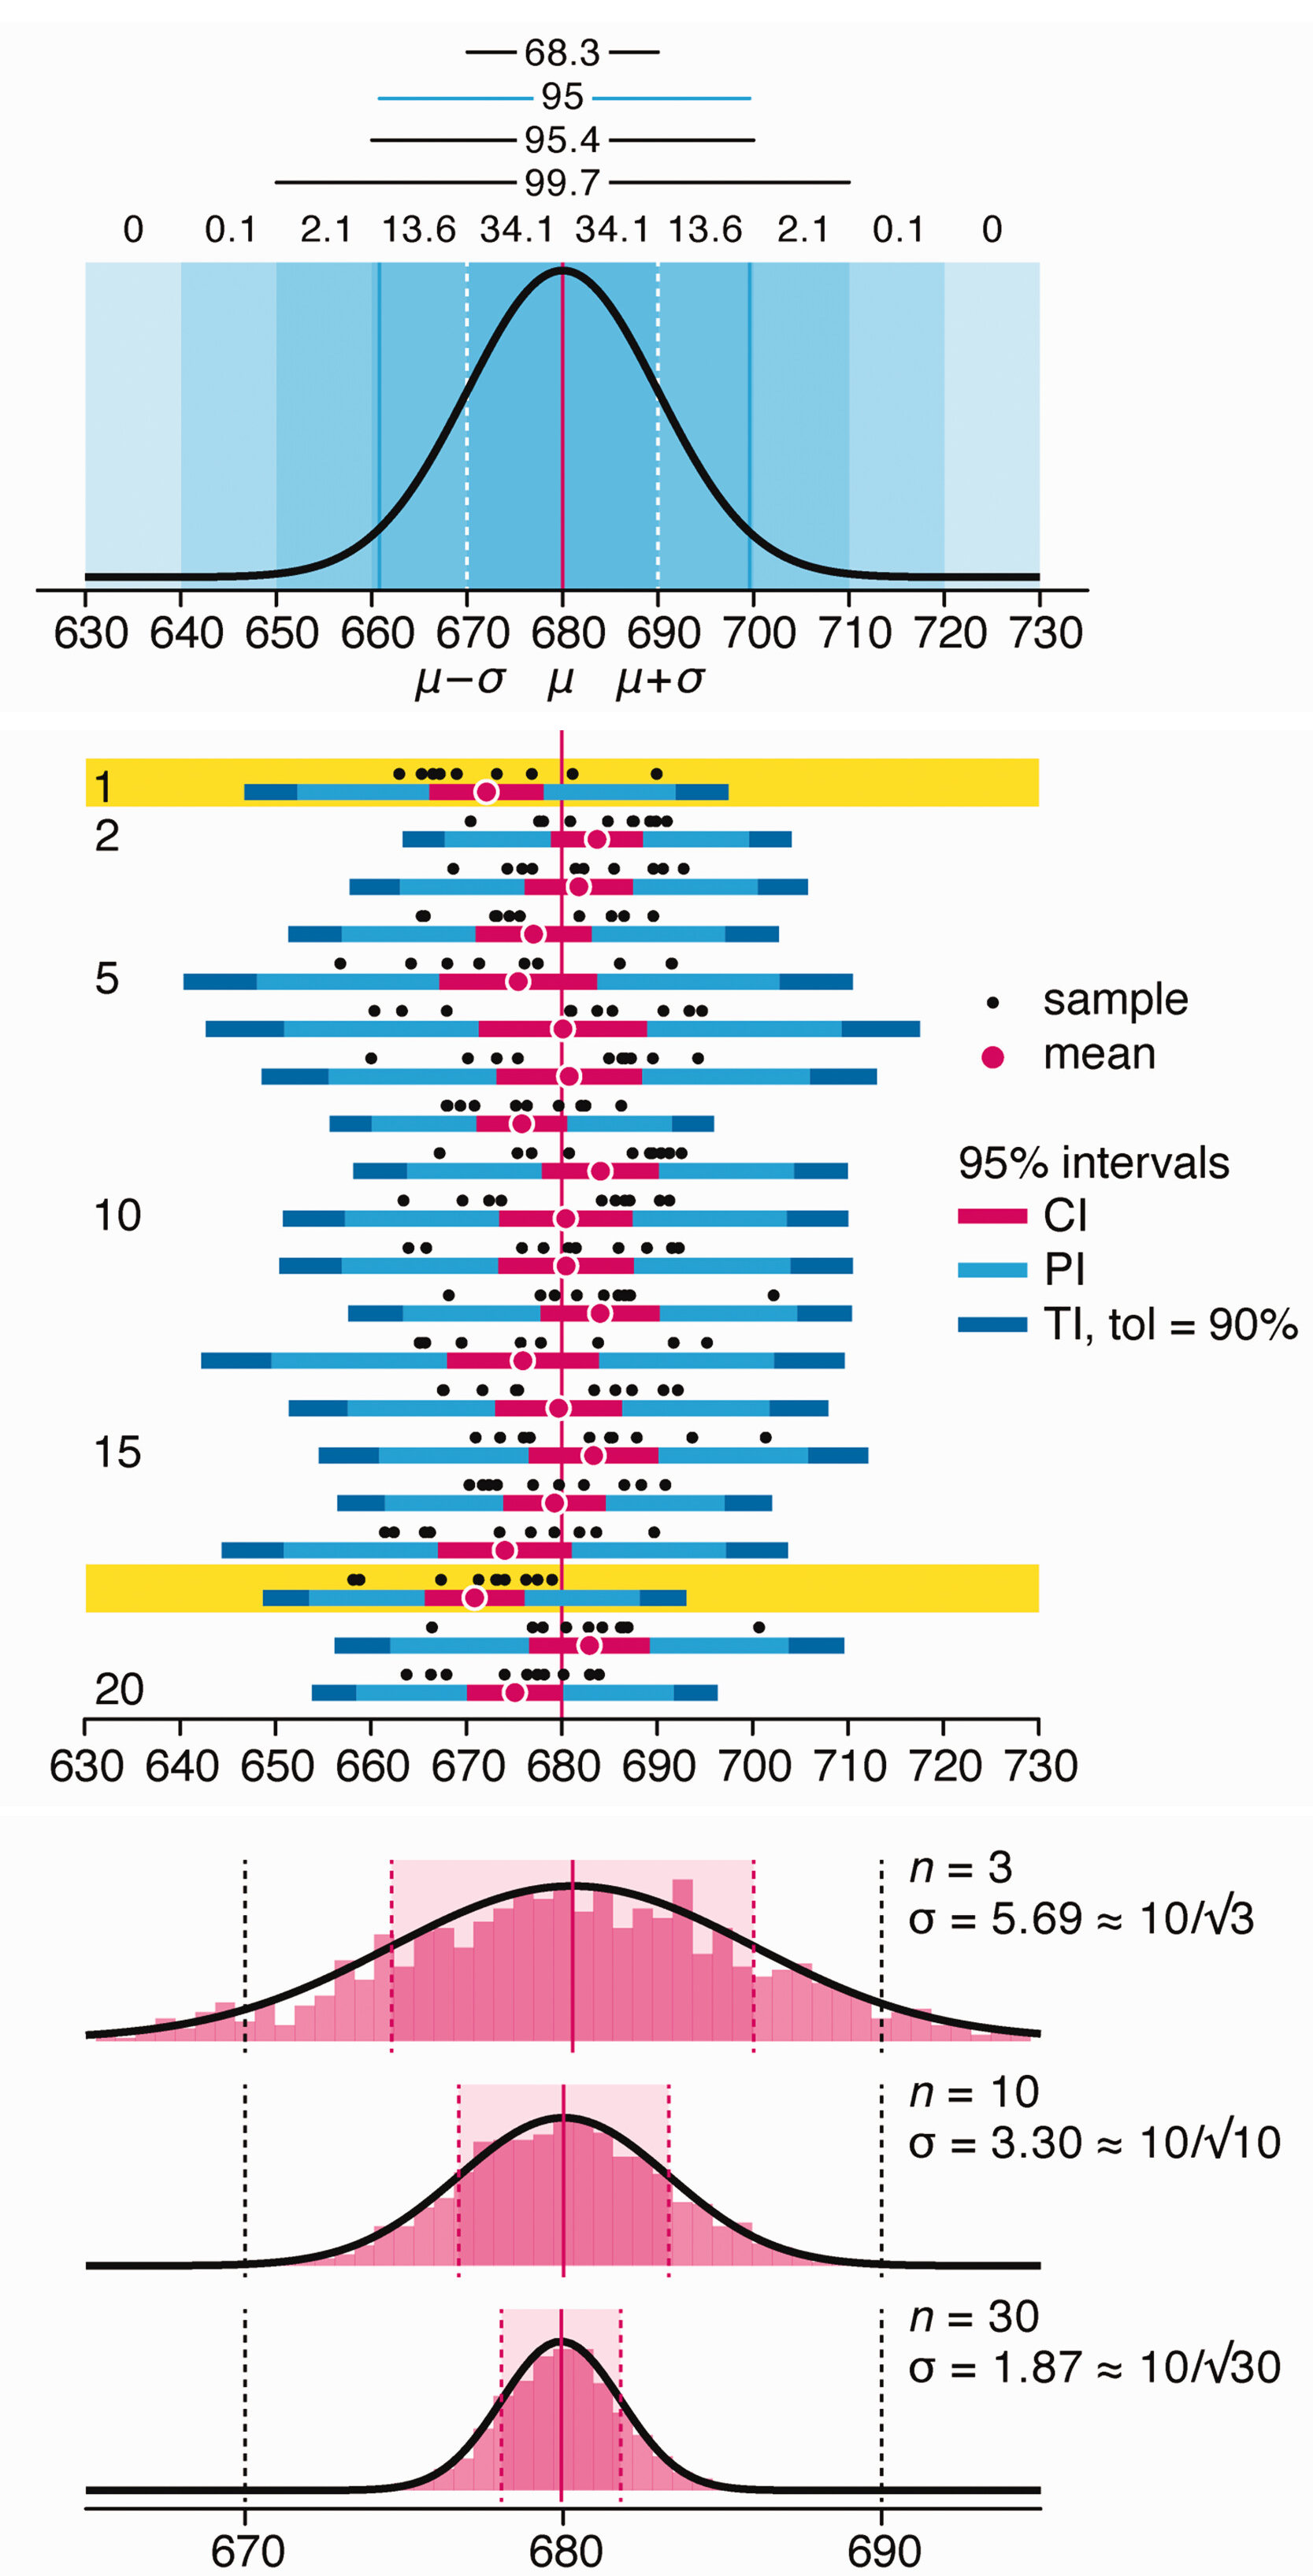
Altman, N. & Krzywinski, M. (2024) Depicting variability and uncertainty using intervals and error bars. Laboratory Animals 58:453–456.