


null
from an undefined
place,
undefined
create (a place)
an account
of us
— Viorica Hrincu
Sometimes when you stare at the void, the void sends you a poem.
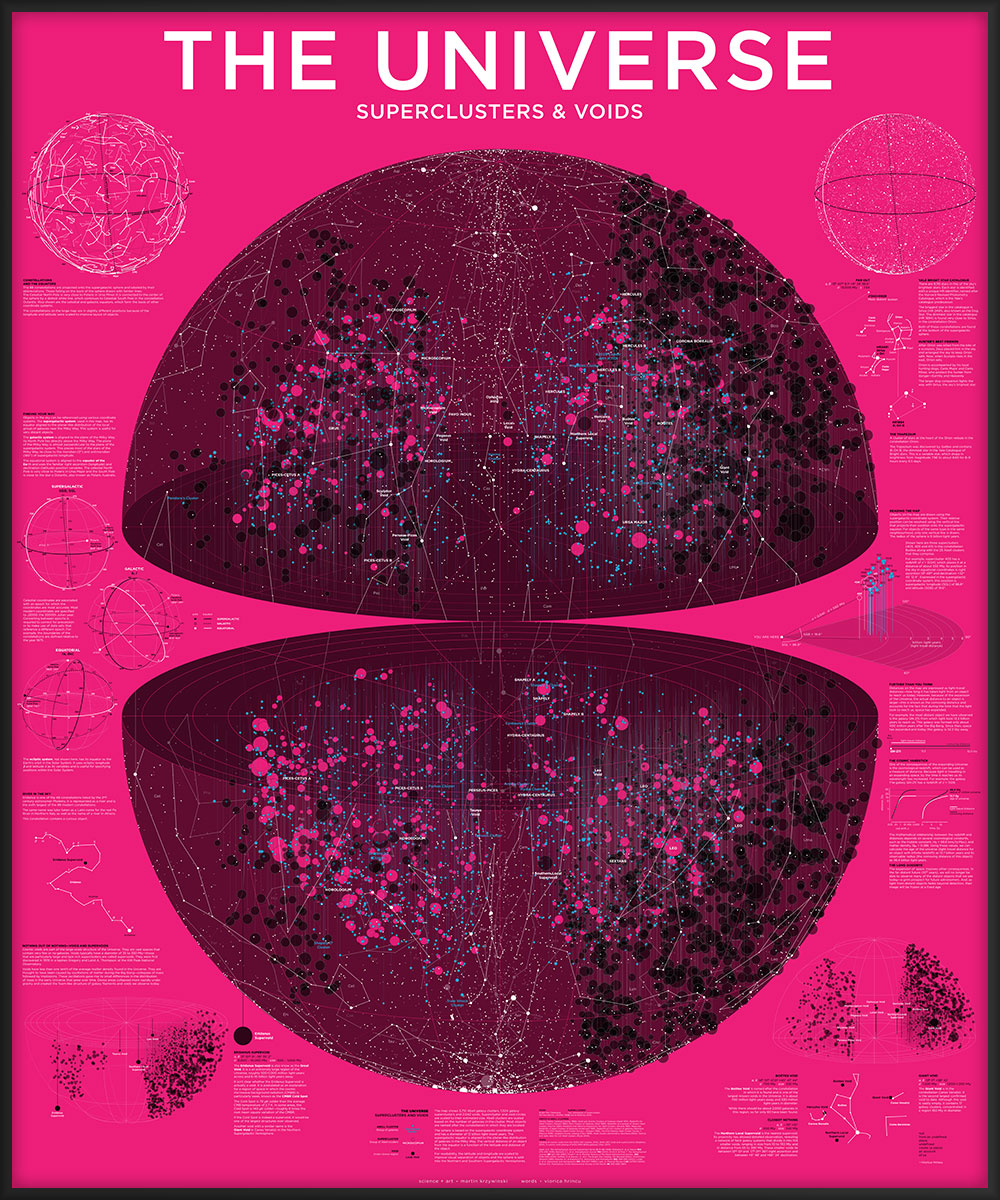
Universe—Superclusters and Voids
The average density of the universe is about `10 \times 10^{-30} \text{ g/cm}^3` or about 6 protons per cubic meter. This should put some perspective in what we mean when we speak about voids as "underdense regions".
references
contents
Before you delve into the background material for the map, calm the nerves and awaken the imagination with these space-themed tunes.
Perfect to listen to while perusing the map ... or the terrain.
2 Wicky by Hooverphonic (Live at Koningin Elisabethzaal 2012)
Space walk by Lemon Jelly
Exploration by Karminsky Experience Inc.
100 Billion Stars by Lux
Journey through the Boötes Void by Scott Lawlor
Ok, now let's get to it.
The individual catalogues of objects (stars, clusters, superclusters, voids) shown on the map are available as a parsed single file.
      n TYPE
  ----- ------------
      2 quasar
   1024 supercluster
   2555 void
   5250 abell
   9096 hr
  18707 zwicky
Each element is represented by a single line and all objects start with the same fields:
TYPE ID CONSTELLATION NAME
  radec RA DEC
  lb GALACTIC_LONG GALACTGIC_LAT
  sglb SUPERGALACTIC_LONG SUPERGALACTIC_LAT
  z REDSHIFT d DISTANCE(Mly)
For some objects the NAME is blank ("-").
In addition to these fields, each object type has additional information.
Abell cluters have the number of galaxies in them (N) and the IDs of the superclusters to which they belong listed.
abell ... count N mscc/sscc ID1,ID2,...
Superclusters have the number of galaxies in them (N), their size (SIZE) and the two constellation of the supercluster's Abell's clusters (same as CONSTELLATION if the supercluster's Abell clusters are all in the same constellation).
supercluster ... count N size SIZE(Mly) con_compound CON_COMPOUND
Voids have their size void ... size SIZE
The stars, taken from the Yale Catalogue of Bright Stars, do not have a distance or redshift but have a magnitude
hr ... mag MAGNITUDE
These are the individual catalogues from Vizier used in the map and to create the single parsed file above.
V/50 Bright Star Catalogue, 5th Revised Ed., Hoffleit+, 1991
VII/110A Rich Clusters of Galaxies, Abell+, 1989
VII/4A Abell and Zwicky Clusters of Galaxies, Abell+, 1974
VII/56 Redshifts for Abell Clusters, Sarazin+, 1982
J/APJ/365/66 Redshifts of a sample of distant Abell clusters, Huchra+, 1990
VII/165A Measured Redshifts of Abell Clusters of Galaxies, Andernach, 1991
VII/177 Redshifts and Velocity Dispersions for Abell Clusters, Struble+, 1991
J/APJS/96/343 Redshifts of rich clusters of galaxies, Quintana+, 1995
J/A+A/310/8 The ESO Nearby Abell Cluster Survey I., Katgert+, 1996
J/A+A/310/31 The ESO Nearby Abell Cluster Survey. II., Mazure+, 1996
J/APJS/126/1 Abell clusters photometry, Quintana+, 2000
J/AJ/126/119 Optical and radio data for rich Abell clusters, Rizza+, 2003
VII/190 Zwicky Galaxy Catalog, Zwicky+, 1968
J/PASP/111/438 Updated Zwicky catalog (UZC), Falco+, 1999
J/MNRAS/445/4073 Two catalogues of superclusters, Chow-Martinez+, 2014
J/APJ/744/82 Catalog of cosmic voids from the SDSS-DR7, Varela+, 2012
J/MNRAS/440/1248 SDSS DR7 voids and superclusters, Nadathur+, 2014
J/APJ/835/161 A cosmic void catalog of SDSS DR12 BOSS galaxies, Mao+, 2017
VI/42 Identification of a Constellation From Position, Roman, 1987
Good places to start your exploration of the Universe.
Hoffleit, D. & Warren, Jr., W.H. The Bright Star Catalog, 5th Revised Edition (Preliminary Version) (1991)
Roman N.G. Identification of a constellation from a position Publications of the Astronomical Society of the Pacific 99 695–699 (1987)
To determine constellation shapes, I originally started with a list by Marc van der Sluys
BSC (Yale Catalogue of Bright Stars) constellation edges by Marc van der Sluys
However, many of these constellations were not the asterisms sanctioned by the IAU. I therefore corrected all the constellation shapes by manually examining the IAU map and cross-referencing the stars to the Yale Catalogue of Bright Stars. Ugh.
IAU Constellation shapes as edges between BSC stars (Yale Catalogue of Bright Stars) by Martin Krzywinski
For more details about the constellations see my IAU Constellation Shape Resources.
Abell clusters [Wikipedia]
Abell, G.O. The distribution of rich clusters of galaxies. A catalog of 2712 rich clusters found on the National Geographic Society Palomar Observatory Sky Survey The Astrophysical Journal Supplement Series 3 211–88 (1958)
LC 1101: supergiant elliptical galaxy [Wikipedia]
Abell 2029 galaxy cluster [Wikipedia]
The universe within 2 billion light years. by Richard Powell
Finelli F. et al. Supervoids in the WISE–2MASS catalogue imprinting cold spots in the cosmic microwave background Monthly Notices of the Royal Astronomical Society 455 (2016)
Kopylov A.I. & Kopylova F.G. Search for streaming motion of galaxy clusters around the Giant Void Astronomy and Astrophysics 382 389–396 (2002)
Linder U. et al. The structure of supervoids. I. Void hierarchy in the Northern Local Supervoid. Astronomy and Astrophysics 329–347 (1995)
El-Ad H. & Piran T. Voids in the large-scale structure The Astrophysical Journal 491 421–435 (1997)
List of voids [Wikipedia]
Giant void [Wikipedia]
Boötes void [Wikipedia]
Northern local supervoid [Wikipedia]
Southern local supervoid [Wikipedia]
Eridanus supervoid (CMBR Cold spot) [Wikipedia]
J1120+0641 [Wikipedia]
Mortlock D.J. et al A luminous quasar at a redshift of z = 7.085 474 616–619 (2011)
Bañados E. et al An 800-million-solar-mass black hole in a significantly neutral universe at a redshift of 7.5 Nature 553 (2018)
J1342+0928 [Wikipedia]
Celestial coordinate system [Wikipedia]
NASA/IPAC Extragalactic Database: Coordinate Transformation & Galactic Extinction Calculator
RA DEC flexible converter by Jan Skowron
How far out in the universe can we see? by Harald Lang
Redshift and distance calculator by Edward Wright
Wright, E.L. The Publications of the Astronomical Society of the Pacific 118 1711–1715 (2006)
Loeb, A. Long-term future of extragalactic astronomy Physical Review D 65 047301.1–047301.4 (2002)
Bennett, C.L. et al The 1% Concordance Hubble Constant Astrophysical Journal 794 (2014)
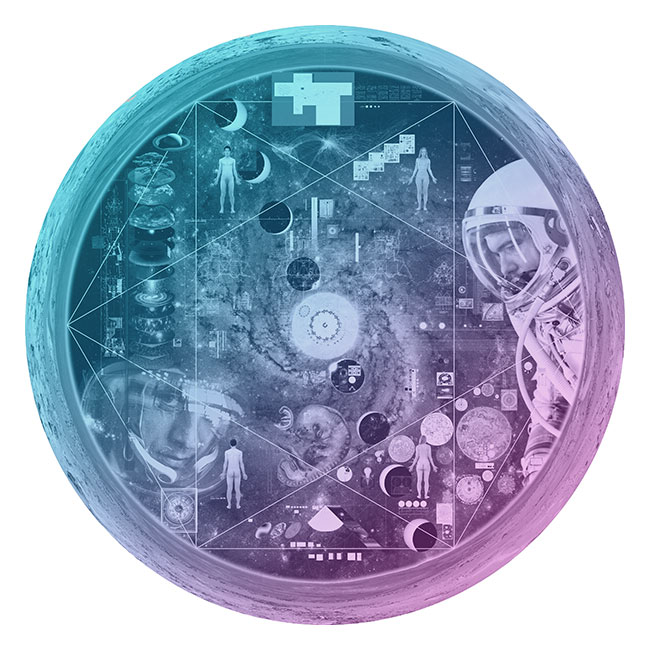
Nasa to send our human genome discs to the Moon
We'd like to say a ‘cosmic hello’: mathematics, culture, palaeontology, art and science, and ... human genomes.

Comparing classifier performance with baselines
All animals are equal, but some animals are more equal than others. —George Orwell
This month, we will illustrate the importance of establishing a baseline performance level.
Baselines are typically generated independently for each dataset using very simple models. Their role is to set the minimum level of acceptable performance and help with comparing relative improvements in performance of other models.
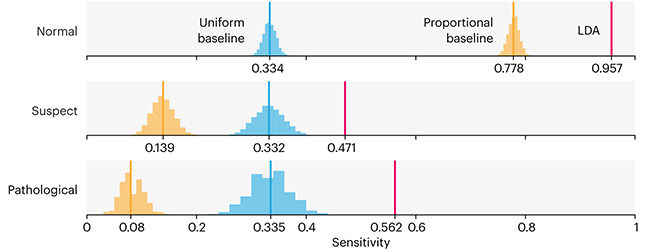
Unfortunately, baselines are often overlooked and, in the presence of a class imbalance5, must be established with care.
Megahed, F.M, Chen, Y-J., Jones-Farmer, A., Rigdon, S.E., Krzywinski, M. & Altman, N. (2024) Points of significance: Comparing classifier performance with baselines. Nat. Methods 20.
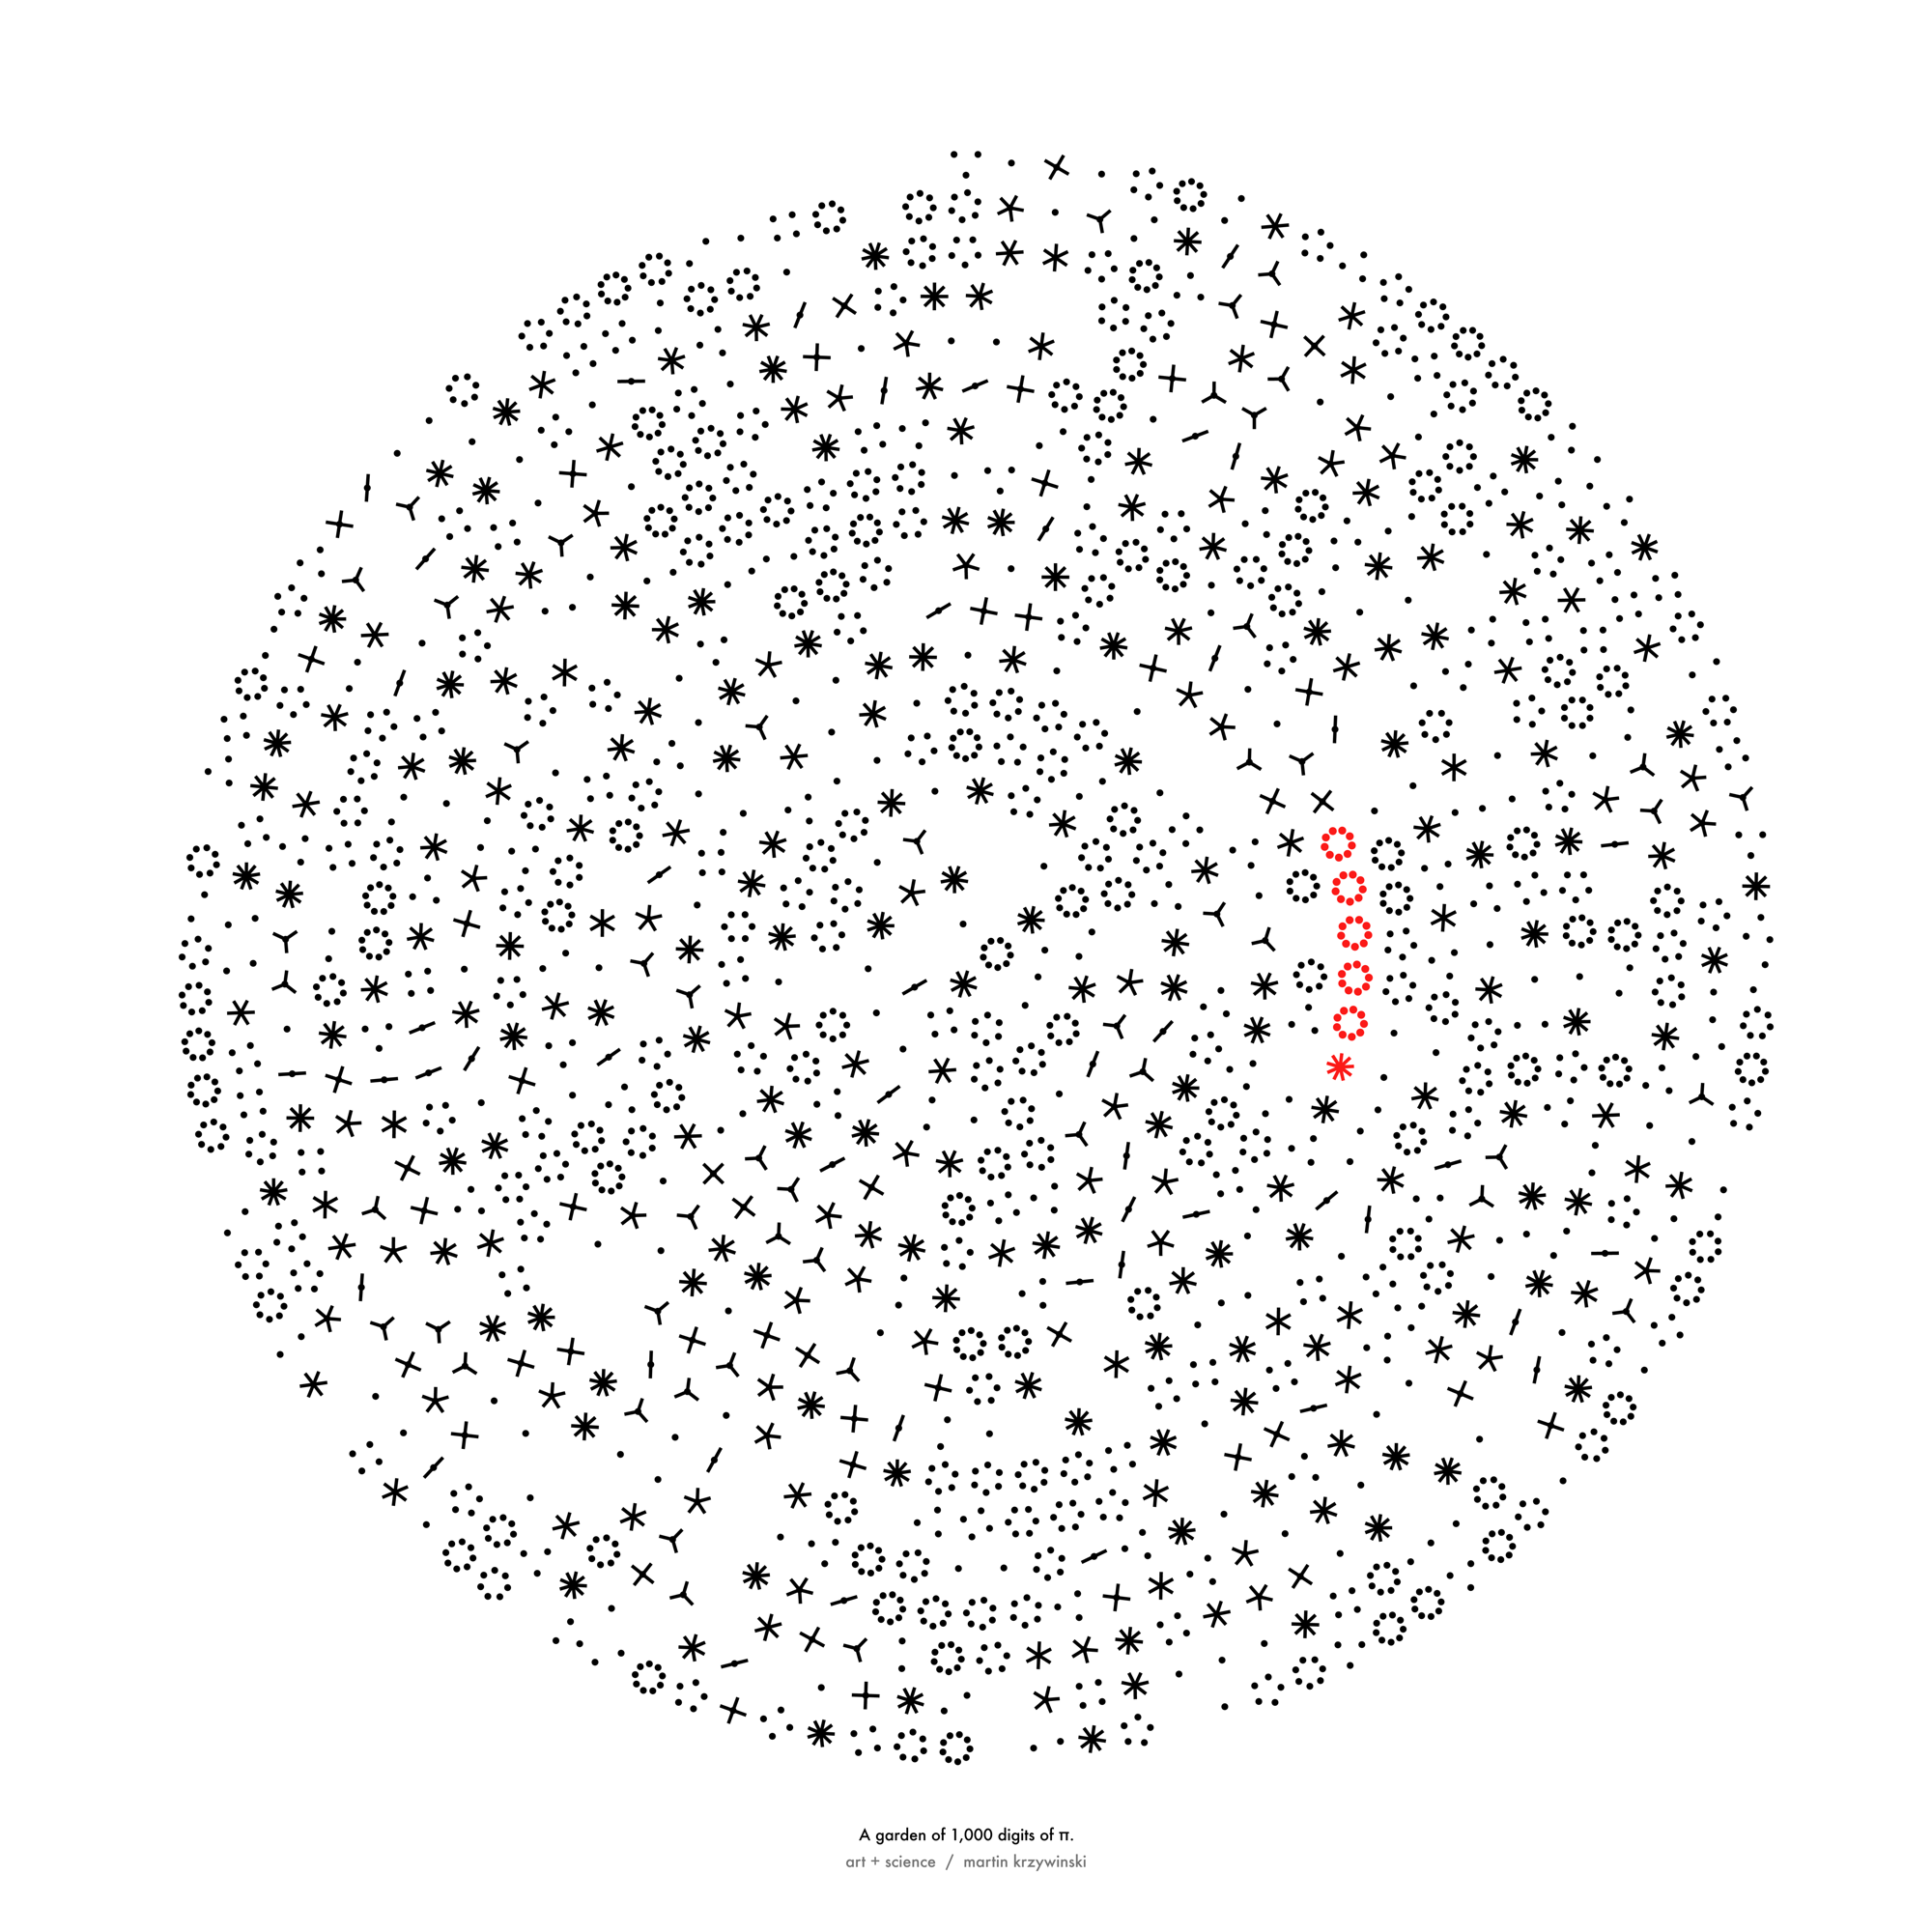
Happy 2024 π Day—
sunflowers ho!
Celebrate π Day (March 14th) and dig into the digit garden. Let's grow something.
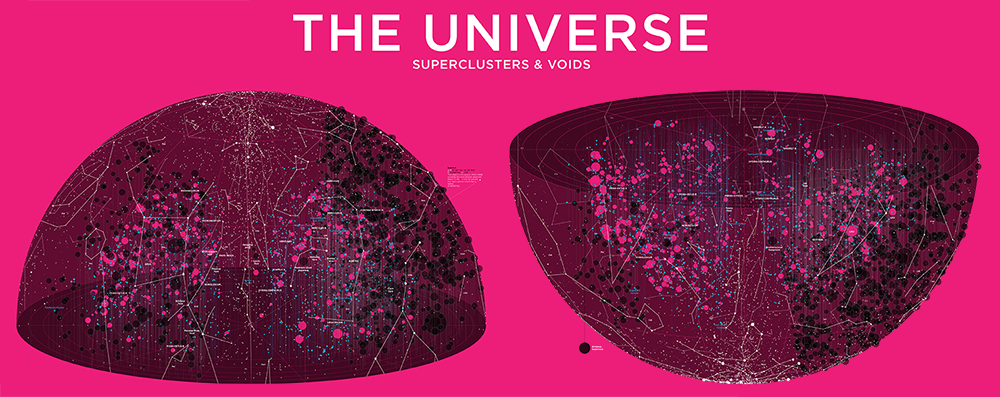
How Analyzing Cosmic Nothing Might Explain Everything
Huge empty areas of the universe called voids could help solve the greatest mysteries in the cosmos.
My graphic accompanying How Analyzing Cosmic Nothing Might Explain Everything in the January 2024 issue of Scientific American depicts the entire Universe in a two-page spread — full of nothing.
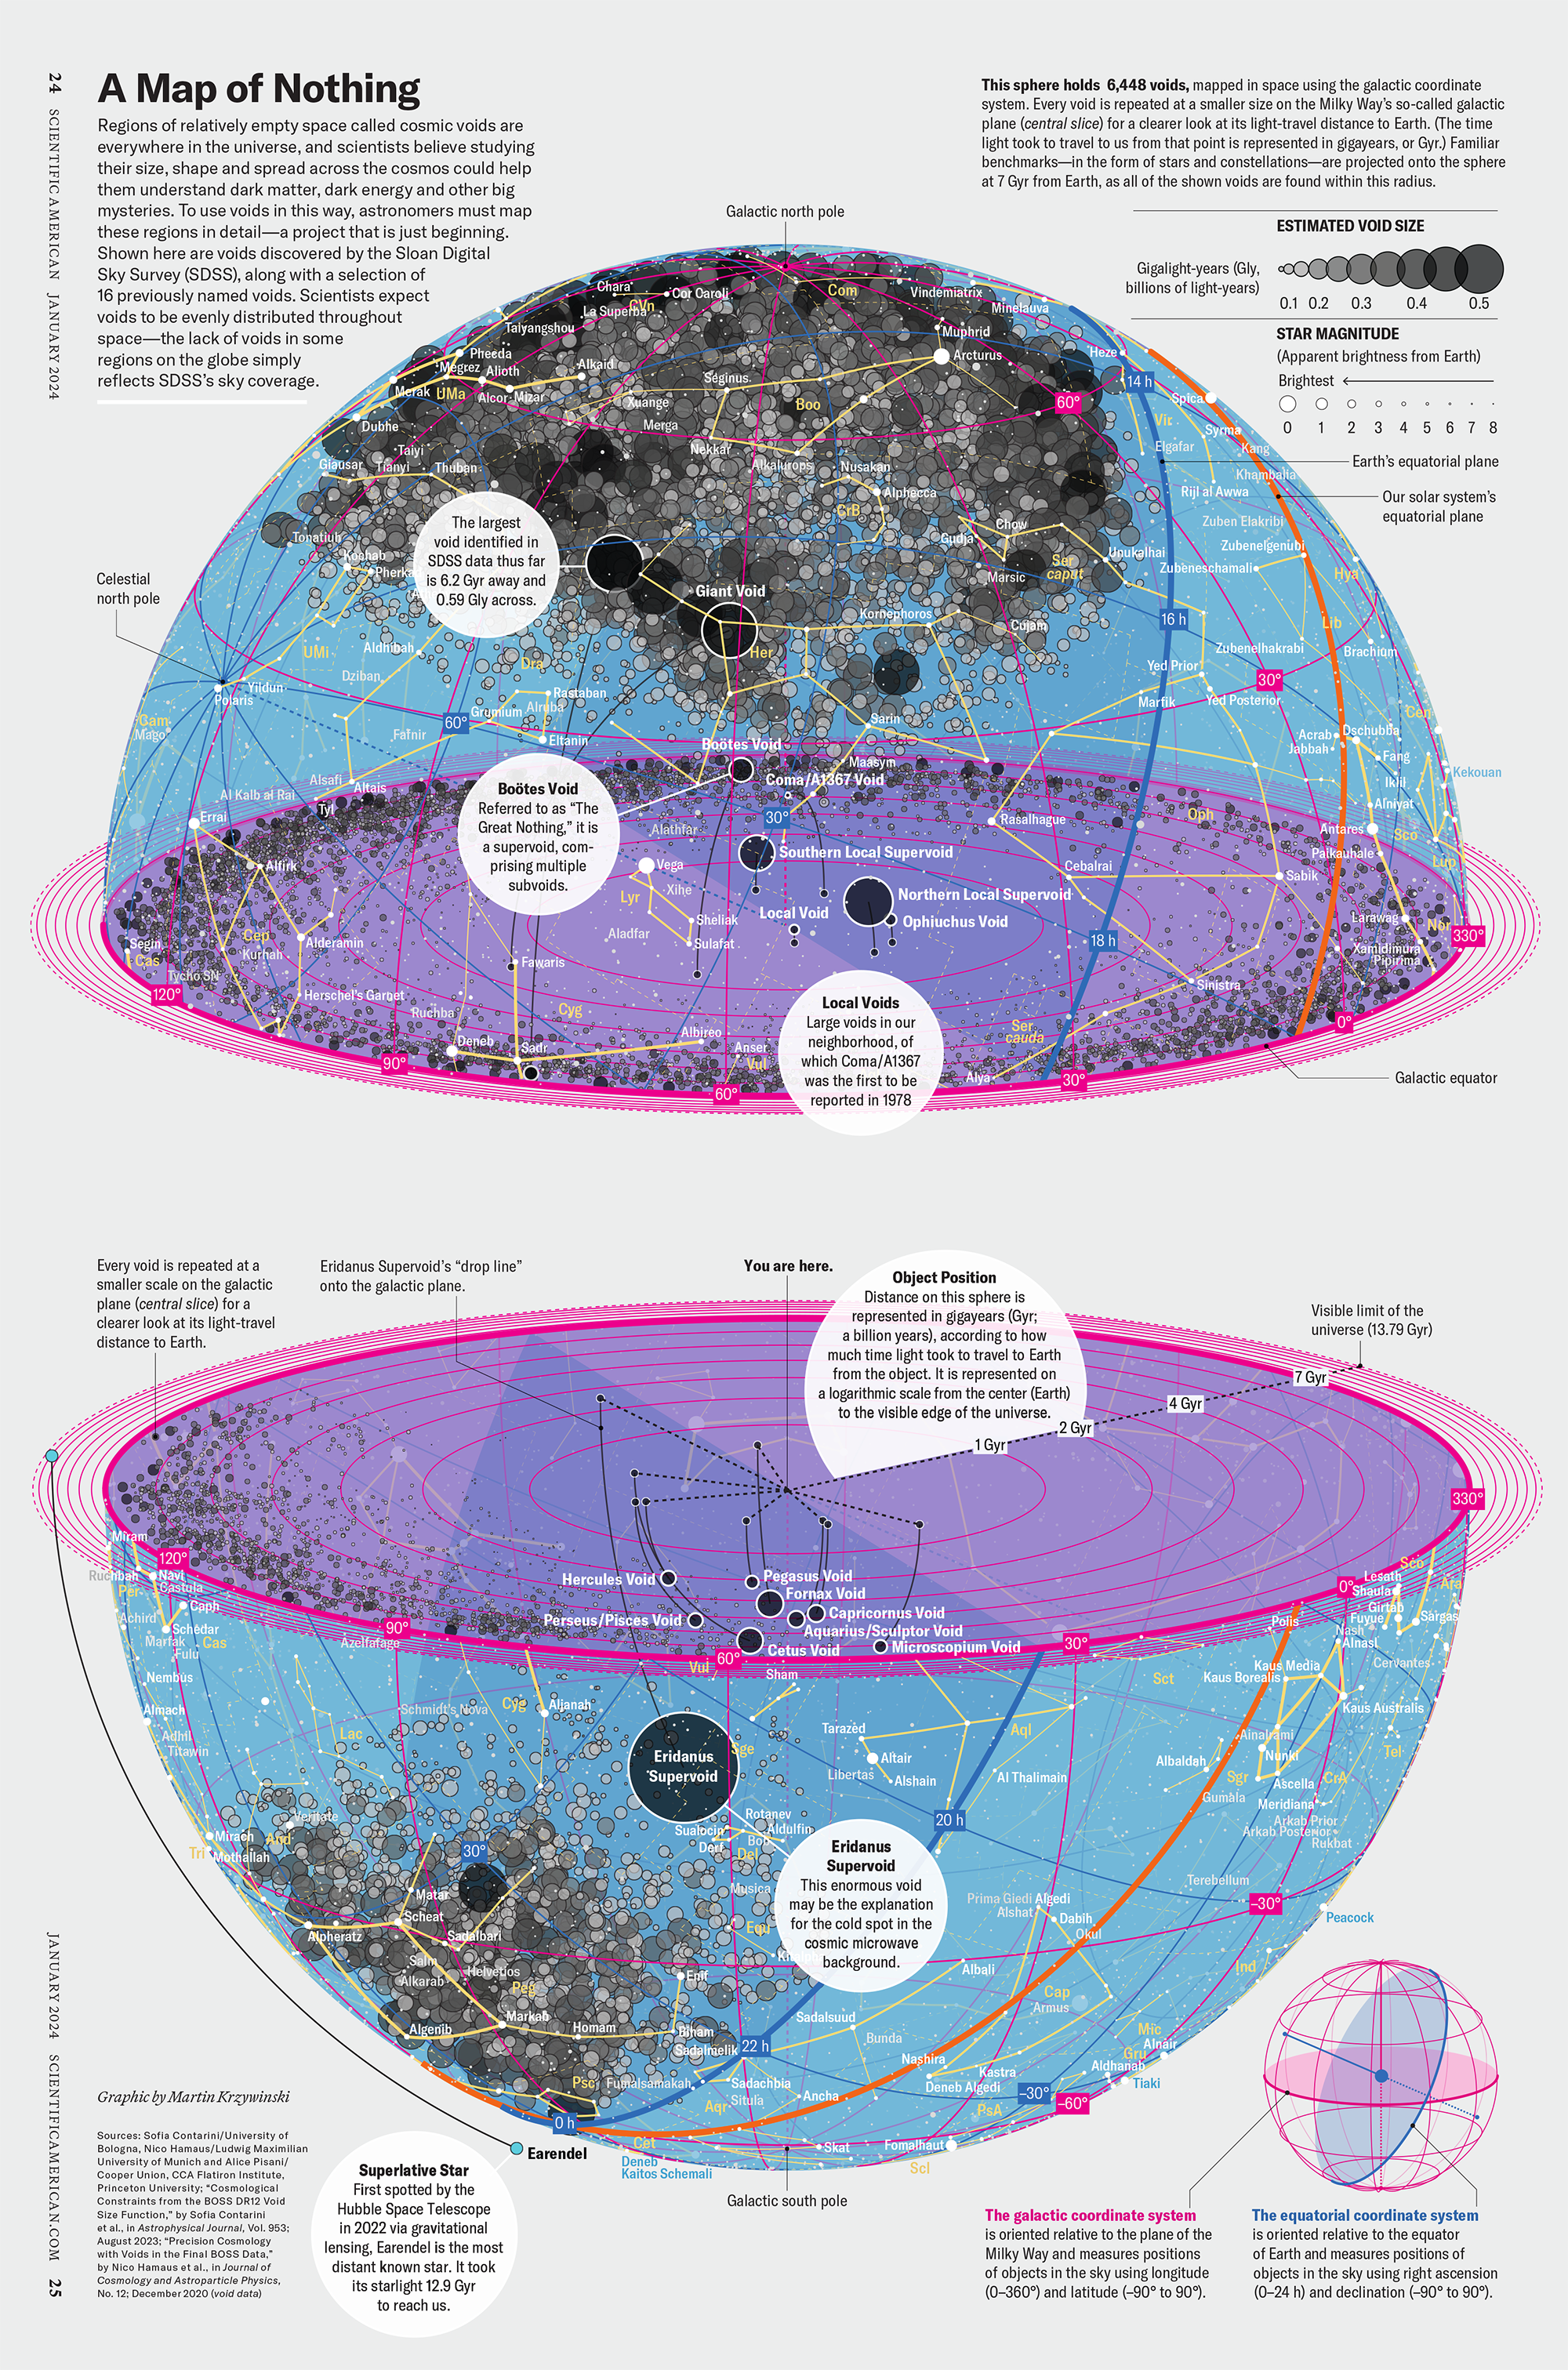
The graphic uses the latest data from SDSS 12 and is an update to my Superclusters and Voids poster.
Michael Lemonick (editor) explains on the graphic:
“Regions of relatively empty space called cosmic voids are everywhere in the universe, and scientists believe studying their size, shape and spread across the cosmos could help them understand dark matter, dark energy and other big mysteries.
To use voids in this way, astronomers must map these regions in detail—a project that is just beginning.
Shown here are voids discovered by the Sloan Digital Sky Survey (SDSS), along with a selection of 16 previously named voids. Scientists expect voids to be evenly distributed throughout space—the lack of voids in some regions on the globe simply reflects SDSS’s sky coverage.”
voids
Sofia Contarini, Alice Pisani, Nico Hamaus, Federico Marulli Lauro Moscardini & Marco Baldi (2023) Cosmological Constraints from the BOSS DR12 Void Size Function Astrophysical Journal 953:46.
Nico Hamaus, Alice Pisani, Jin-Ah Choi, Guilhem Lavaux, Benjamin D. Wandelt & Jochen Weller (2020) Journal of Cosmology and Astroparticle Physics 2020:023.
Sloan Digital Sky Survey Data Release 12
Alan MacRobert (Sky & Telescope), Paulina Rowicka/Martin Krzywinski (revisions & Microscopium)
Hoffleit & Warren Jr. (1991) The Bright Star Catalog, 5th Revised Edition (Preliminary Version).
H0 = 67.4 km/(Mpc·s), Ωm = 0.315, Ωv = 0.685. Planck collaboration Planck 2018 results. VI. Cosmological parameters (2018).
constellation figures
stars
cosmology
Error in predictor variables
It is the mark of an educated mind to rest satisfied with the degree of precision that the nature of the subject admits and not to seek exactness where only an approximation is possible. —Aristotle
In regression, the predictors are (typically) assumed to have known values that are measured without error.
Practically, however, predictors are often measured with error. This has a profound (but predictable) effect on the estimates of relationships among variables – the so-called “error in variables” problem.
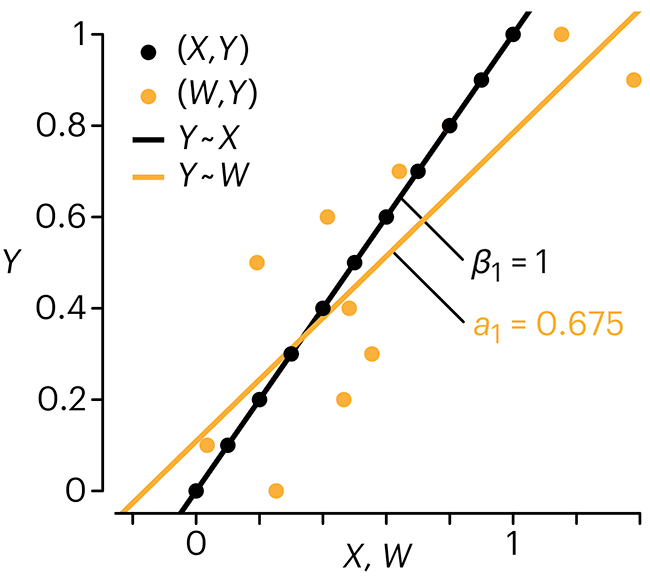
Error in measuring the predictors is often ignored. In this column, we discuss when ignoring this error is harmless and when it can lead to large bias that can leads us to miss important effects.
Altman, N. & Krzywinski, M. (2024) Points of significance: Error in predictor variables. Nat. Methods 20.
Background reading
Altman, N. & Krzywinski, M. (2015) Points of significance: Simple linear regression. Nat. Methods 12:999–1000.
Lever, J., Krzywinski, M. & Altman, N. (2016) Points of significance: Logistic regression. Nat. Methods 13:541–542 (2016).
Das, K., Krzywinski, M. & Altman, N. (2019) Points of significance: Quantile regression. Nat. Methods 16:451–452.
Convolutional neural networks
Nature uses only the longest threads to weave her patterns, so that each small piece of her fabric reveals the organization of the entire tapestry. – Richard Feynman
Following up on our Neural network primer column, this month we explore a different kind of network architecture: a convolutional network.
The convolutional network replaces the hidden layer of a fully connected network (FCN) with one or more filters (a kind of neuron that looks at the input within a narrow window).
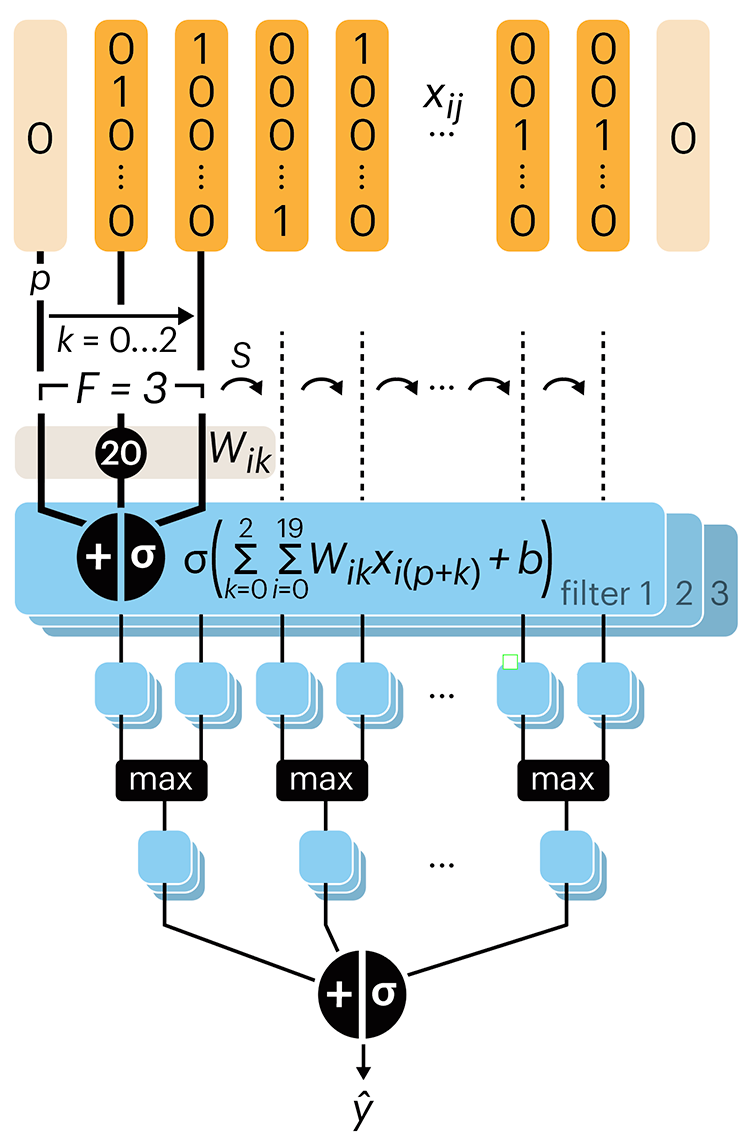
Even through convolutional networks have far fewer neurons that an FCN, they can perform substantially better for certain kinds of problems, such as sequence motif detection.
Derry, A., Krzywinski, M & Altman, N. (2023) Points of significance: Convolutional neural networks. Nature Methods 20:1269–1270.
Background reading
Derry, A., Krzywinski, M. & Altman, N. (2023) Points of significance: Neural network primer. Nature Methods 20:165–167.
Lever, J., Krzywinski, M. & Altman, N. (2016) Points of significance: Logistic regression. Nature Methods 13:541–542.