
 buy artwork
`\pi` Approximation Day Art Posters


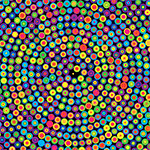
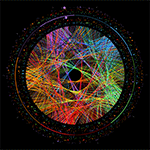
The never-repeating digits of `\pi` can be approximated by 22/7 = 3.142857 to within 0.04%. These pages artistically and mathematically explore rational approximations to `\pi`. This 22/7 ratio is celebrated each year on July 22nd. If you like hand waving or back-of-envelope mathematics, this day is for you: `\pi` approximation day!
The `22/7` approximation of `\pi` is more accurate than using the first three digits `3.14`. In light of this, it is curious to point out that `\pi` Approximation Day depicts `\pi` 20% more accurately than the official `\pi` Day! The approximation is accurate within 0.04% while 3.14 is accurate to 0.05%.
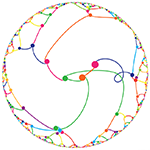
first 10,000 approximations to `\pi`
For each `m=1...10000` I found `n` such that `m/n` was the best approximation of `\pi`. You can download the entire list, which looks like this
    m     n            m/n relative_error best_seen?
    1     1 1.000000000000 0.681690113816 improved
    2     1 2.000000000000 0.363380227632 improved
    3     1 3.000000000000 0.045070341449 improved
    4     1 4.000000000000 0.273239544735
    5     2 2.500000000000 0.204225284541
    7     2 3.500000000000 0.114084601643
    8     3 2.666666666667 0.151173636843
    9     4 2.250000000000 0.283802756086
   10     3 3.333333333333 0.061032953946
   11     4 2.750000000000 0.124647812995
   12     5 2.400000000000 0.236056273159
   13     4 3.250000000000 0.034507130097 improved
   14     5 2.800000000000 0.108732318685
   16     5 3.200000000000 0.018591635788 improved
   17     5 3.400000000000 0.082253613025
   18     5 3.600000000000 0.145915590262
   19     6 3.166666666667 0.007981306249 improved
   20     7 2.857142857143 0.090543182332
   21     8 2.625000000000 0.164436548768
   22     7 3.142857142857 0.000402499435 improved
   23     7 3.285714285714 0.045875340318
   24     7 3.428571428571 0.091348181202
...
  354   113 3.132743362832 0.002816816734
  355   113 3.141592920354 0.000000084914 improved
  356   113 3.150442477876 0.002816986561
...
 9998  3183 3.141061891298 0.000168946885
 9999  3182 3.142363293526 0.000245302310
10000  3183 3.141690229343 0.000031059327
As the value of `m` is increased, better approximations are possible. For example, each of `13/4`, `16/5`, `19/6` and `22/7` are in turn better approximations of `\pi`. The line includes the improved flag if the approximation is better than others found thus far.
next best after 22/7
After `22/7`, the next better approximation is at `179/57`.
Out of all the 10,000 approximations, the best one is `355/113`, which is good to 7 digits (6 decimal places).
      pi = 3.1415926
 355/113 = 3.1415929
I've scanned to beyond `m=1000000` and `355/113` still remains as the only approximation that returns more correct digits than required to remember it.
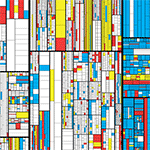
increasingly accurate approximations
Here is a sequence of approximations that improve on all previous ones.
    1     1 1.000000000000 0.681690113816 improved
    2     1 2.000000000000 0.363380227632 improved
    3     1 3.000000000000 0.045070341449 improved
   13     4 3.250000000000 0.034507130097 improved
   16     5 3.200000000000 0.018591635788 improved
   19     6 3.166666666667 0.007981306249 improved
   22     7 3.142857142857 0.000402499435 improved
  179    57 3.140350877193 0.000395269704 improved
  201    64 3.140625000000 0.000308013704 improved
  223    71 3.140845070423 0.000237963113 improved
  245    78 3.141025641026 0.000180485705 improved
  267    85 3.141176470588 0.000132475164 improved
  289    92 3.141304347826 0.000091770575 improved
  311    99 3.141414141414 0.000056822190 improved
  333   106 3.141509433962 0.000026489630 improved
  355   113 3.141592920354 0.000000084914 improved
For all except one, these approximations aren't all good value for your digits.
For example, `179/57` requires you to remember 5 digits but only gets you 3 digits of `\pi` correct (3.14).
Only `355/113` gets you more digits than you need to remember—you need to memorize 6 but get 7 (3.141592) out of the approximation!
You could argue that `22/7` and `355/113` are the only approximations worth remembering. In fact, go ahead and do so.
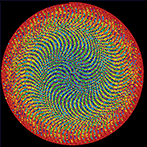
approximations for large `m` and `n`
It's remarkable that there is no better `m/n` approximation after `355/113` for all `m \le 10000`.
What do we find for `m > 10000`?
Well, we have to move down the values of `m` all the way to 52,163 to find `52163/16604`. But for all this searching, our improvement in accuracy is miniscule—0.2%!
                pi 3.141592653589793238

       m        n  m/n              relative_error
      355      113 3.1415929203     0.00000008491
    52163    16604 3.1415923873     0.00000008474
After 52,162 there is a slew improvements to the approximation.
   104348    33215 3.1415926539     0.000000000106
   208341    66317 3.1415926534     0.0000000000389
   312689    99532 3.1415926536     0.00000000000927
   833719   265381 3.141592653581   0.00000000000277
  1146408   364913 3.14159265359    0.000000000000513
  3126535   995207 3.141592653588   0.000000000000364
  4272943  1360120 3.1415926535893  0.000000000000129
  5419351  1725033 3.1415926535898  0.00000000000000705
 42208400 13435351 3.1415926535897  0.00000000000000669
 47627751 15160384 3.14159265358977 0.00000000000000512
 53047102 16885417 3.14159265358978 0.00000000000000388
 58466453 18610450 3.14159265358978 0.00000000000000287
I stopped looking after `m=58,466,453`.
Despite their accuracy, all these approximations require that you remember more or equal the number of digits than they return. The last one above requires you to memorize 17 (9+8) digits and returns only 14 digits of `\pi`.
The only exception to this is `355/113`, which returns 7 digits for its 6.
You can download the first 175 increasingly accurate approximations, calculated to extended precision (up to `58,466,453/18,610,450`).
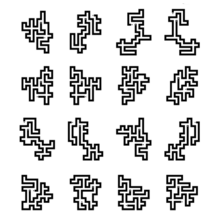
Beyond Belief Campaign BRCA Art
Fuelled by philanthropy, findings into the workings of BRCA1 and BRCA2 genes have led to groundbreaking research and lifesaving innovations to care for families facing cancer.
This set of 100 one-of-a-kind prints explore the structure of these genes. Each artwork is unique — if you put them all together, you get the full sequence of the BRCA1 and BRCA2 proteins.

Propensity score weighting
The needs of the many outweigh the needs of the few. —Mr. Spock (Star Trek II)
This month, we explore a related and powerful technique to address bias: propensity score weighting (PSW), which applies weights to each subject instead of matching (or discarding) them.

Kurz, C.F., Krzywinski, M. & Altman, N. (2025) Points of significance: Propensity score weighting. Nat. Methods 22:1–3.
Happy 2025 π Day—
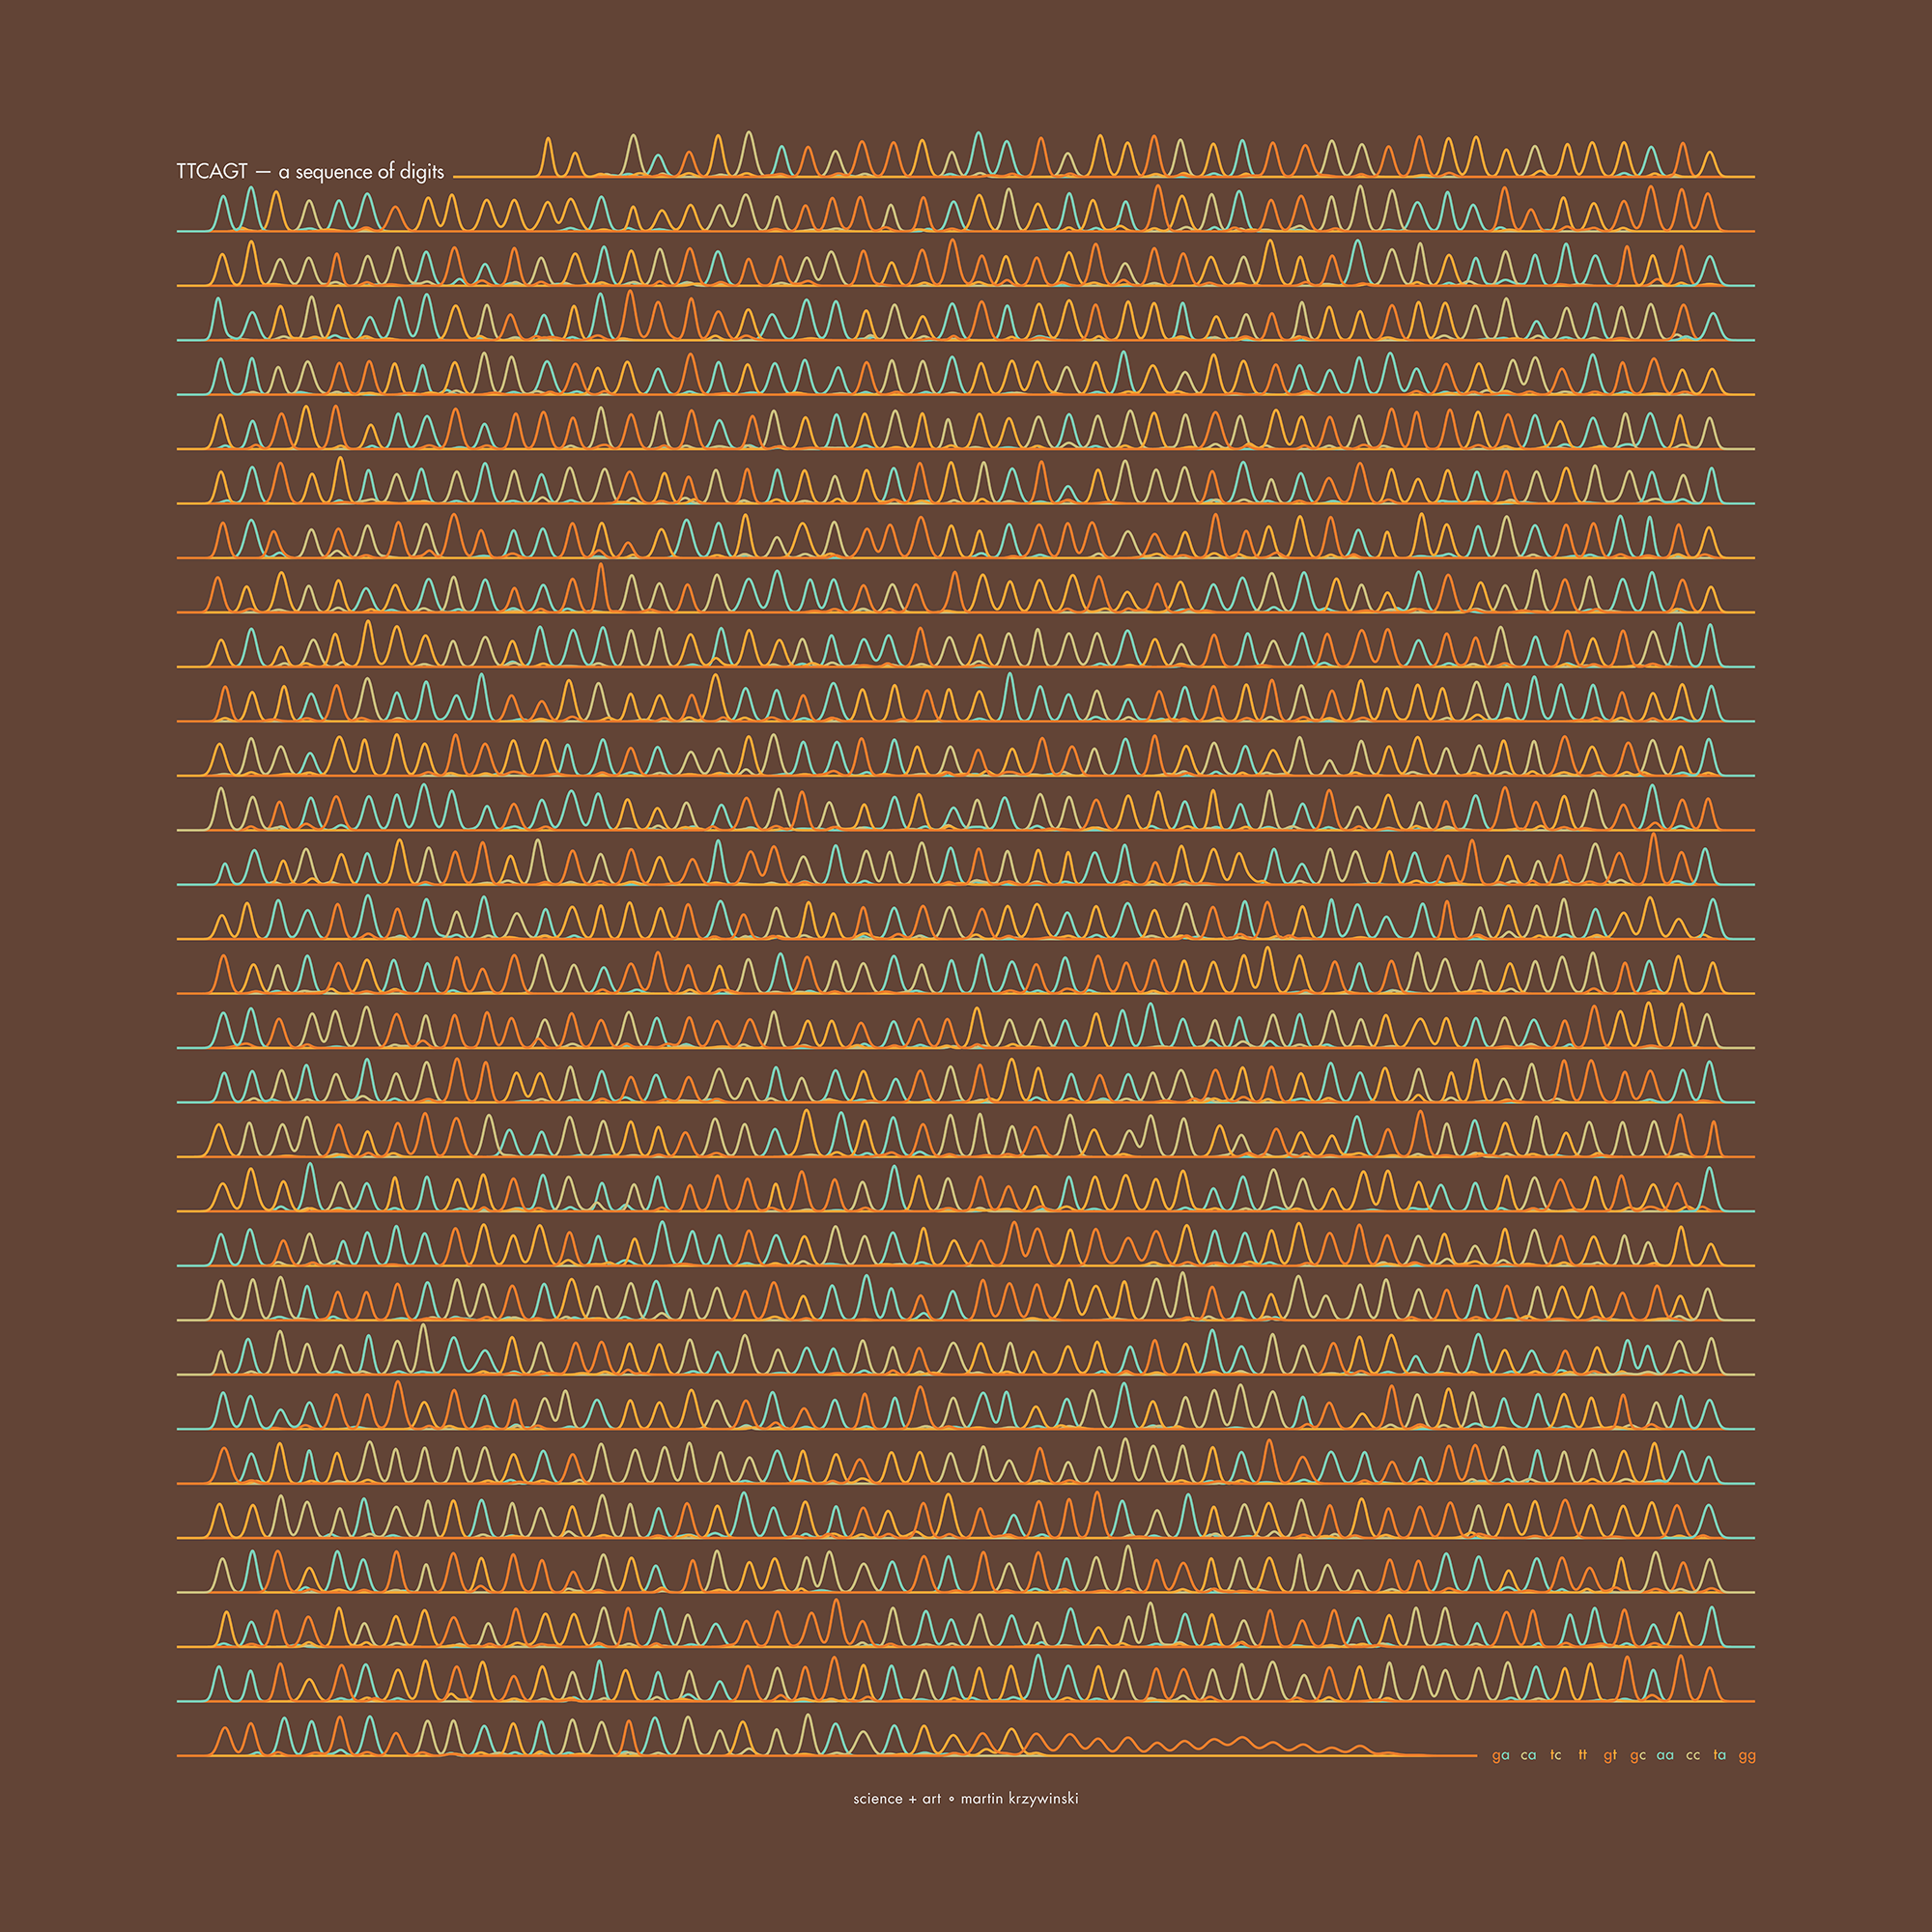
TTCAGT: a sequence of digits
Celebrate π Day (March 14th) and sequence digits like its 1999. Let's call some peaks.

Crafting 10 Years of Statistics Explanations: Points of Significance
I don’t have good luck in the match points. —Rafael Nadal, Spanish tennis player
Points of Significance is an ongoing series of short articles about statistics in Nature Methods that started in 2013. Its aim is to provide clear explanations of essential concepts in statistics for a nonspecialist audience. The articles favor heuristic explanations and make extensive use of simulated examples and graphical explanations, while maintaining mathematical rigor.
Topics range from basic, but often misunderstood, such as uncertainty and P-values, to relatively advanced, but often neglected, such as the error-in-variables problem and the curse of dimensionality. More recent articles have focused on timely topics such as modeling of epidemics, machine learning, and neural networks.
In this article, we discuss the evolution of topics and details behind some of the story arcs, our approach to crafting statistical explanations and narratives, and our use of figures and numerical simulations as props for building understanding.

Altman, N. & Krzywinski, M. (2025) Crafting 10 Years of Statistics Explanations: Points of Significance. Annual Review of Statistics and Its Application 12:69–87.
Propensity score matching
I don’t have good luck in the match points. —Rafael Nadal, Spanish tennis player
In many experimental designs, we need to keep in mind the possibility of confounding variables, which may give rise to bias in the estimate of the treatment effect.

If the control and experimental groups aren't matched (or, roughly, similar enough), this bias can arise.
Sometimes this can be dealt with by randomizing, which on average can balance this effect out. When randomization is not possible, propensity score matching is an excellent strategy to match control and experimental groups.
Kurz, C.F., Krzywinski, M. & Altman, N. (2024) Points of significance: Propensity score matching. Nat. Methods 21:1770–1772.
Understanding p-values and significance
P-values combined with estimates of effect size are used to assess the importance of experimental results. However, their interpretation can be invalidated by selection bias when testing multiple hypotheses, fitting multiple models or even informally selecting results that seem interesting after observing the data.
We offer an introduction to principled uses of p-values (targeted at the non-specialist) and identify questionable practices to be avoided.

Altman, N. & Krzywinski, M. (2024) Understanding p-values and significance. Laboratory Animals 58:443–446.