

There is no sound in space, but there is music (and genomes)
contents
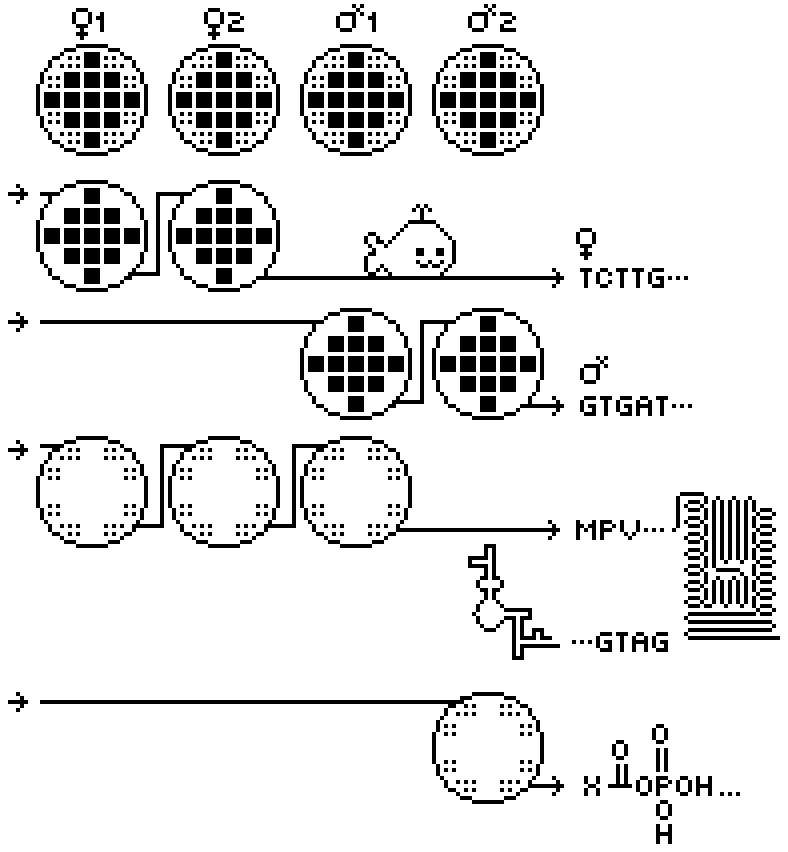
The discs contain the full genome of a female and male as well as the human proteome and metabolome.
The genome sequence is organized into panels of 203 × 203 pixels. Each panel contains 202 × 202 = 40,804 data pixels. The last row and column are dedicated to error correction — registering whether the sum of a row or column pixels is even.
Each disc contains about about 70,000 such panels comprising about 2,800,000,000 pixels. For every 1,024 panels, there is an error check panel that works like the row/column error check except that it sums across panels.
Each base is encoded by two pixels so each panel stores 20,402 bases. Each disc therefore stores about 1.4 Gb of sequence. This capacity is just enough to store the fully sequenced haploid genome of an individual on two discs.

The proteome is stored in smaller panels of size `n` × 32 where `n=2-32`. These panels are placed near the edge of the disc to make full use of the space on the disc.
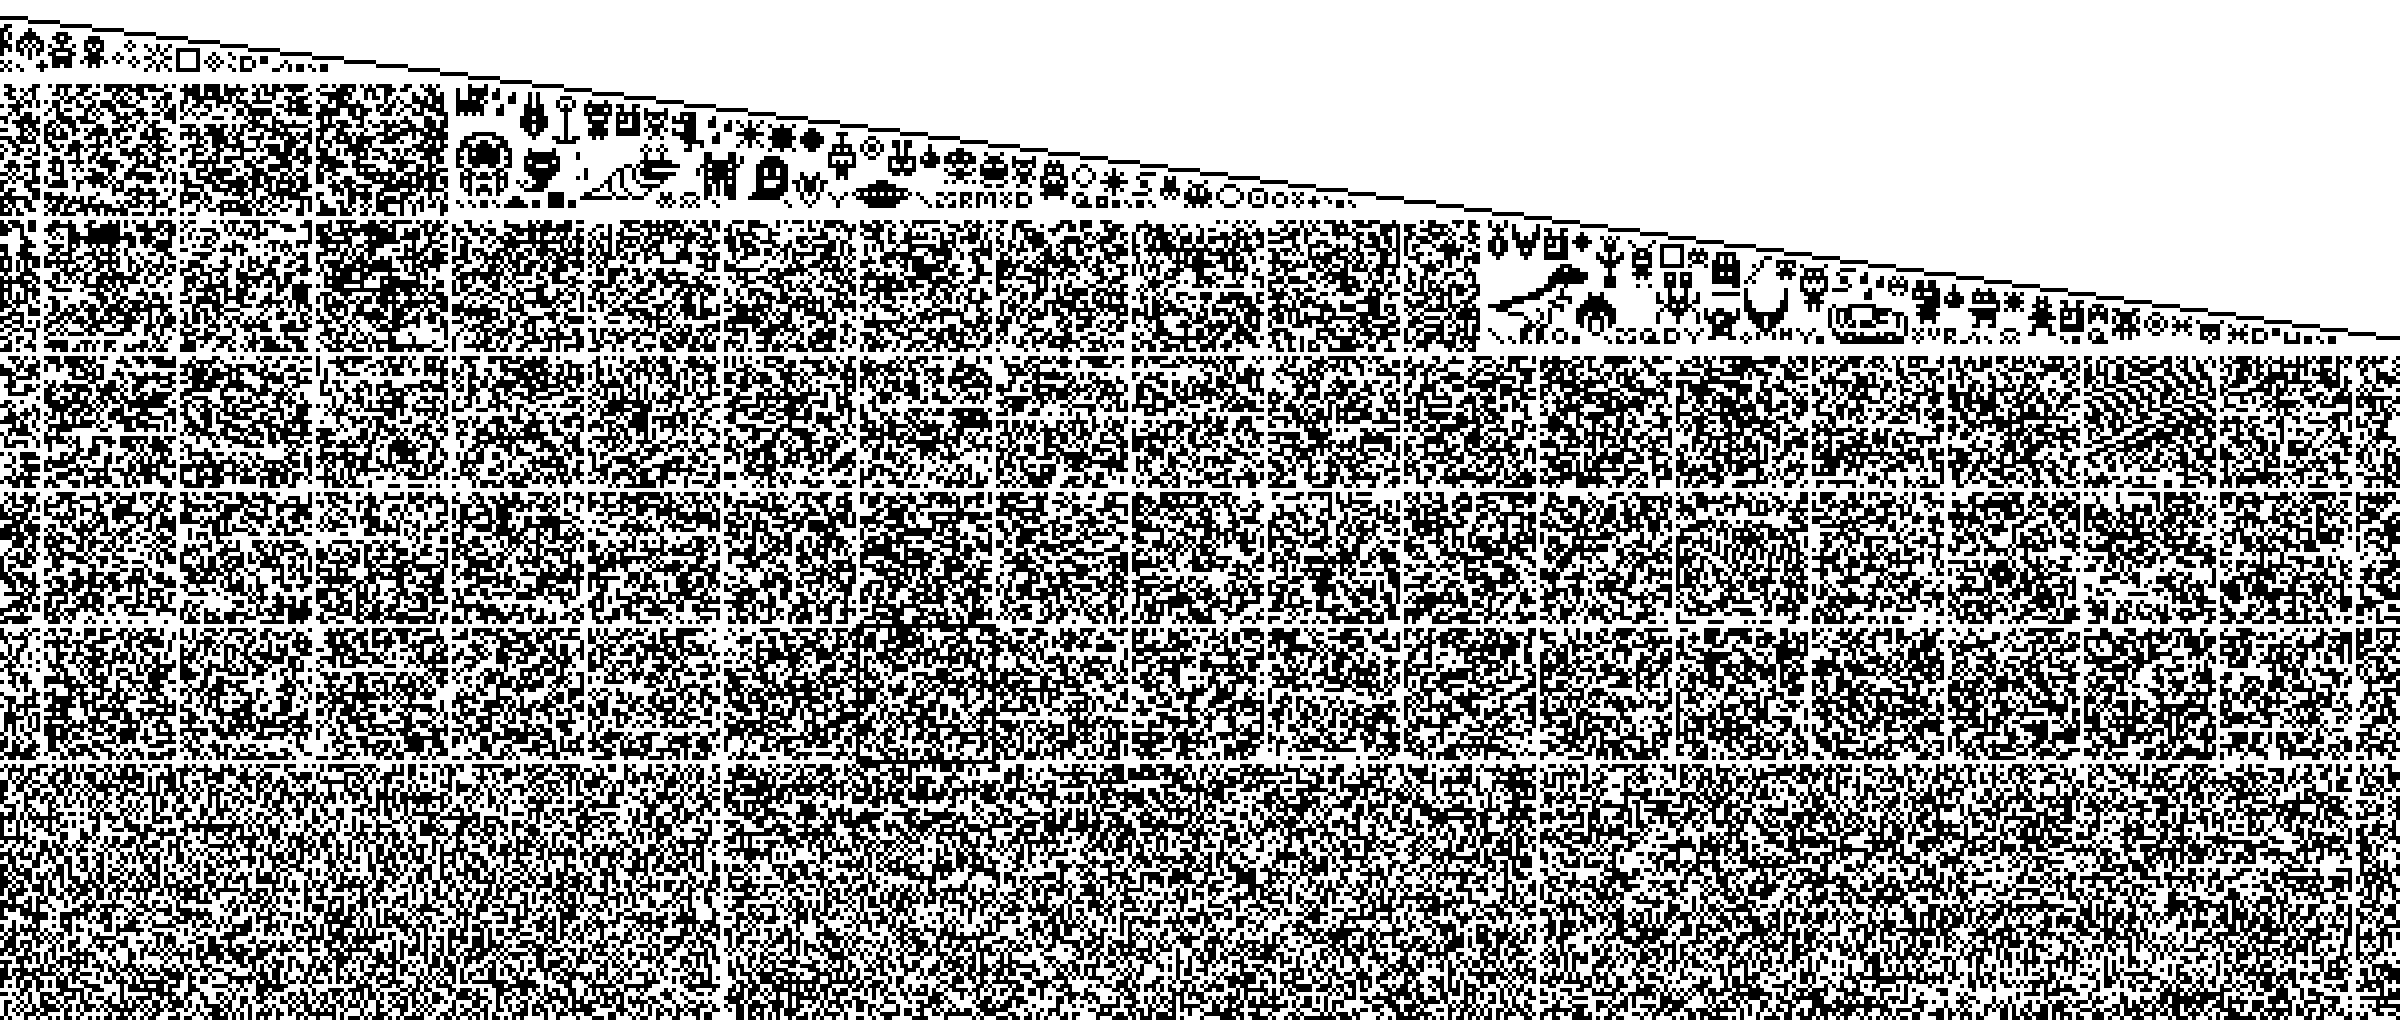
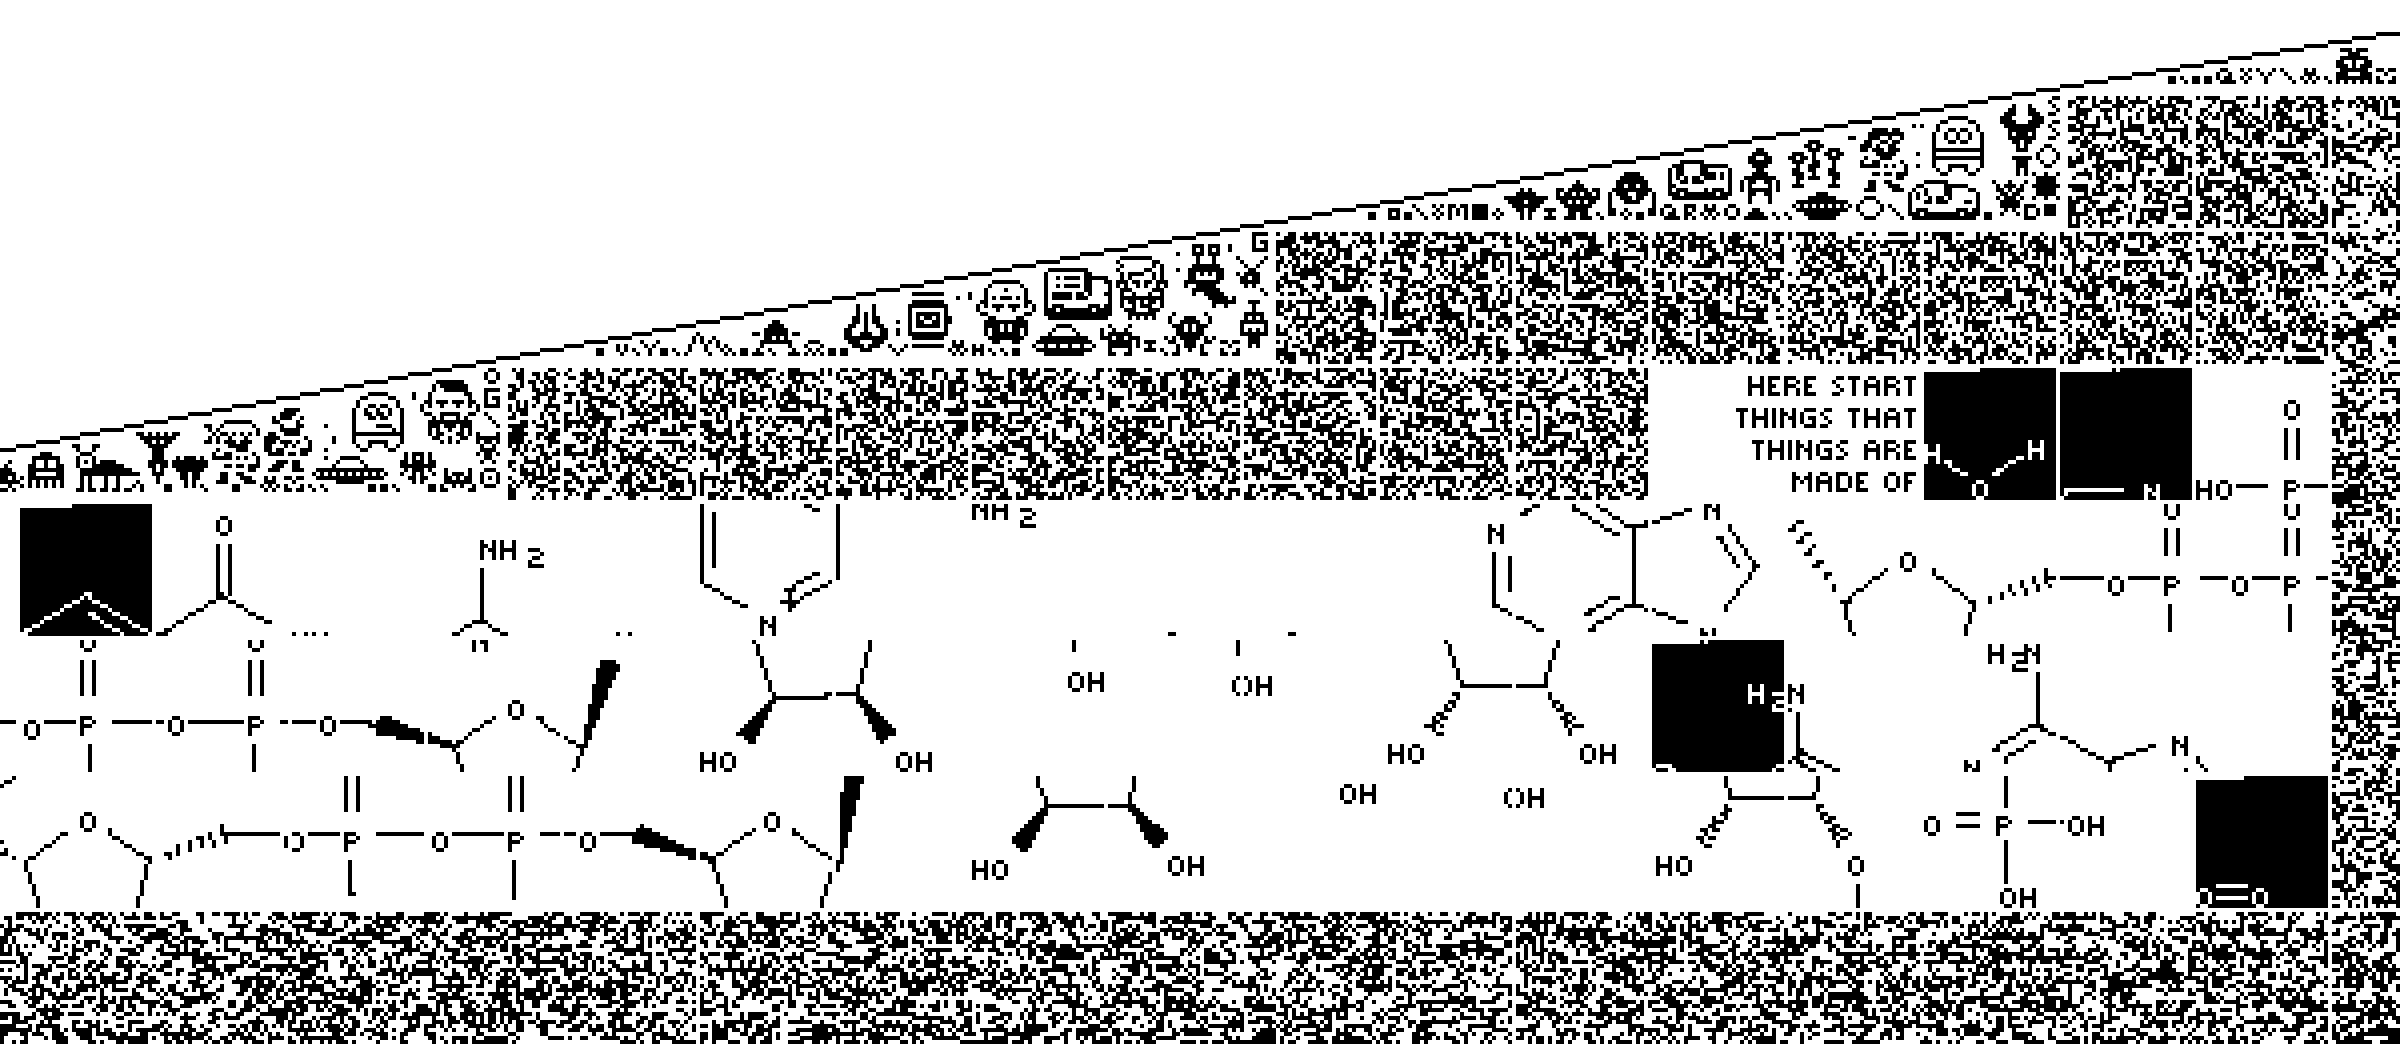
The proteome ends close to the start of the last disc. From this point on, the small panels are used to store the chemical structures of compounds that participate in metabolic reactions.
Each compound is a jigsaw puzzle — its structure is stored across one or more panels and it's up to you to piece the panels together. Hint: the first panel of a structure has its pixels inverted.
Each disc also includes a jigsaw puzzle — four in total.
You put it together. And by you I mean they. And by they I mean (possibly) aliens.
If you like these puzzles, see my 1-bit 10 gigapixel space maps.
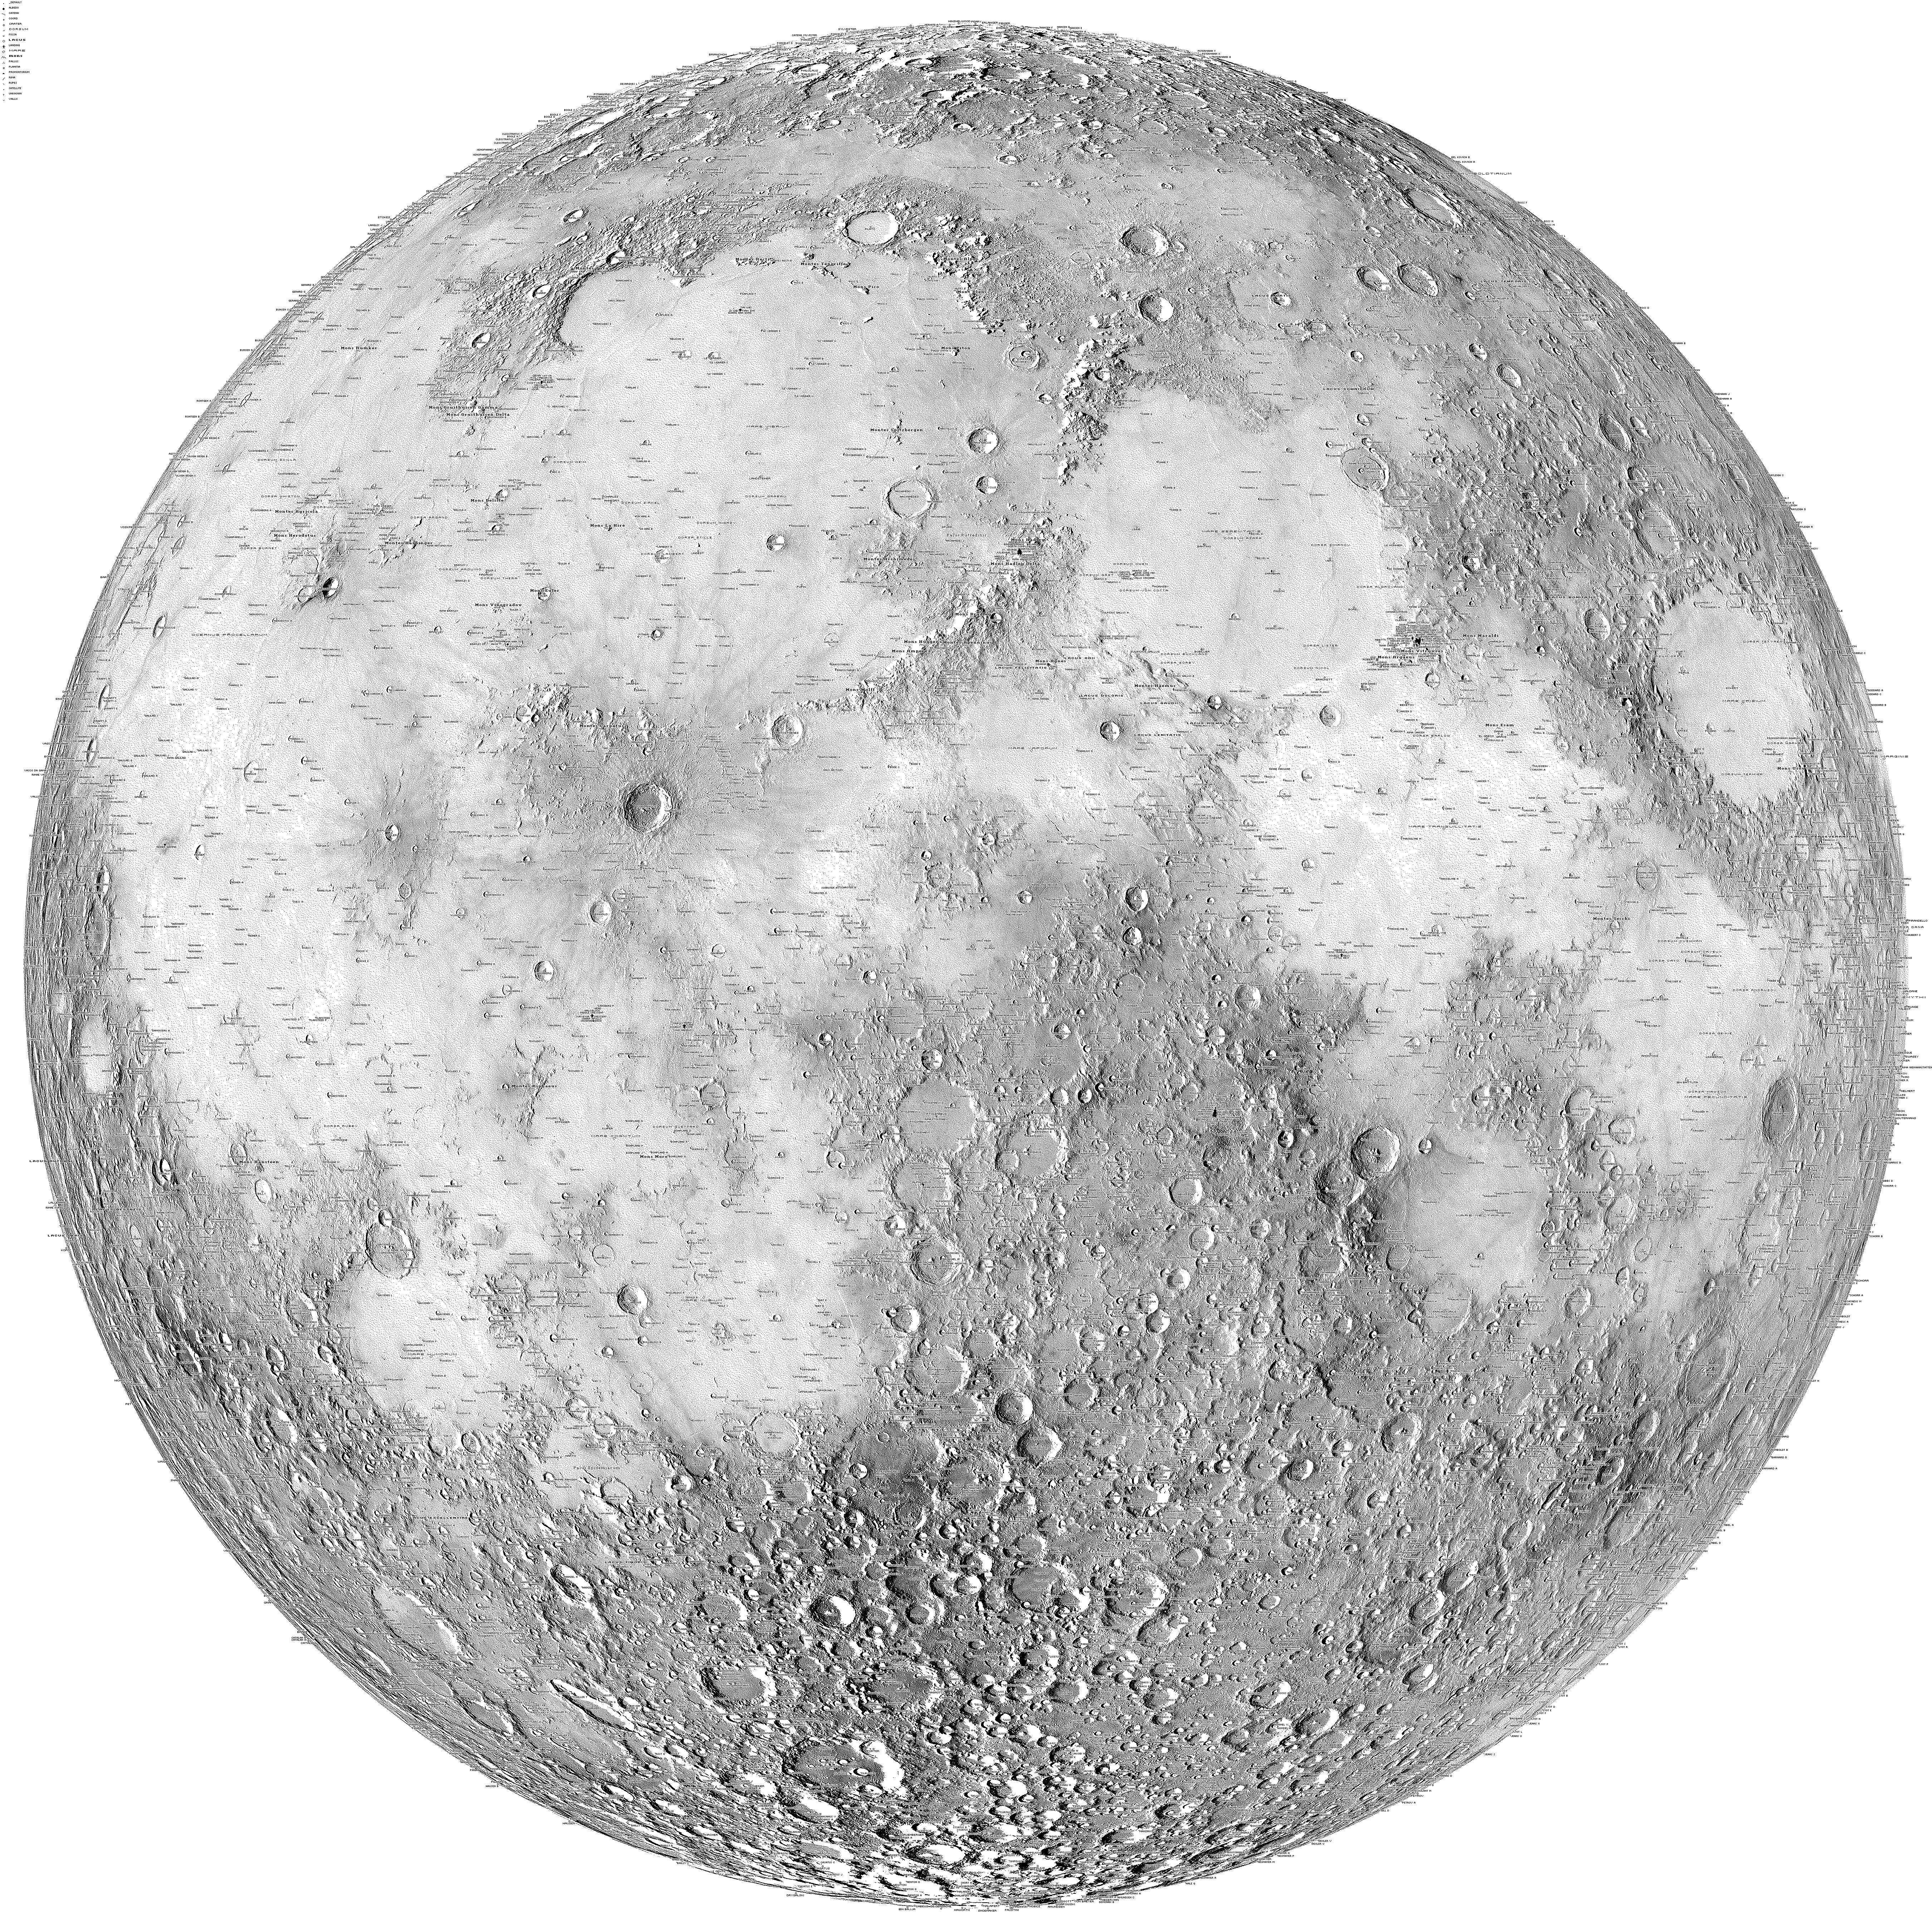
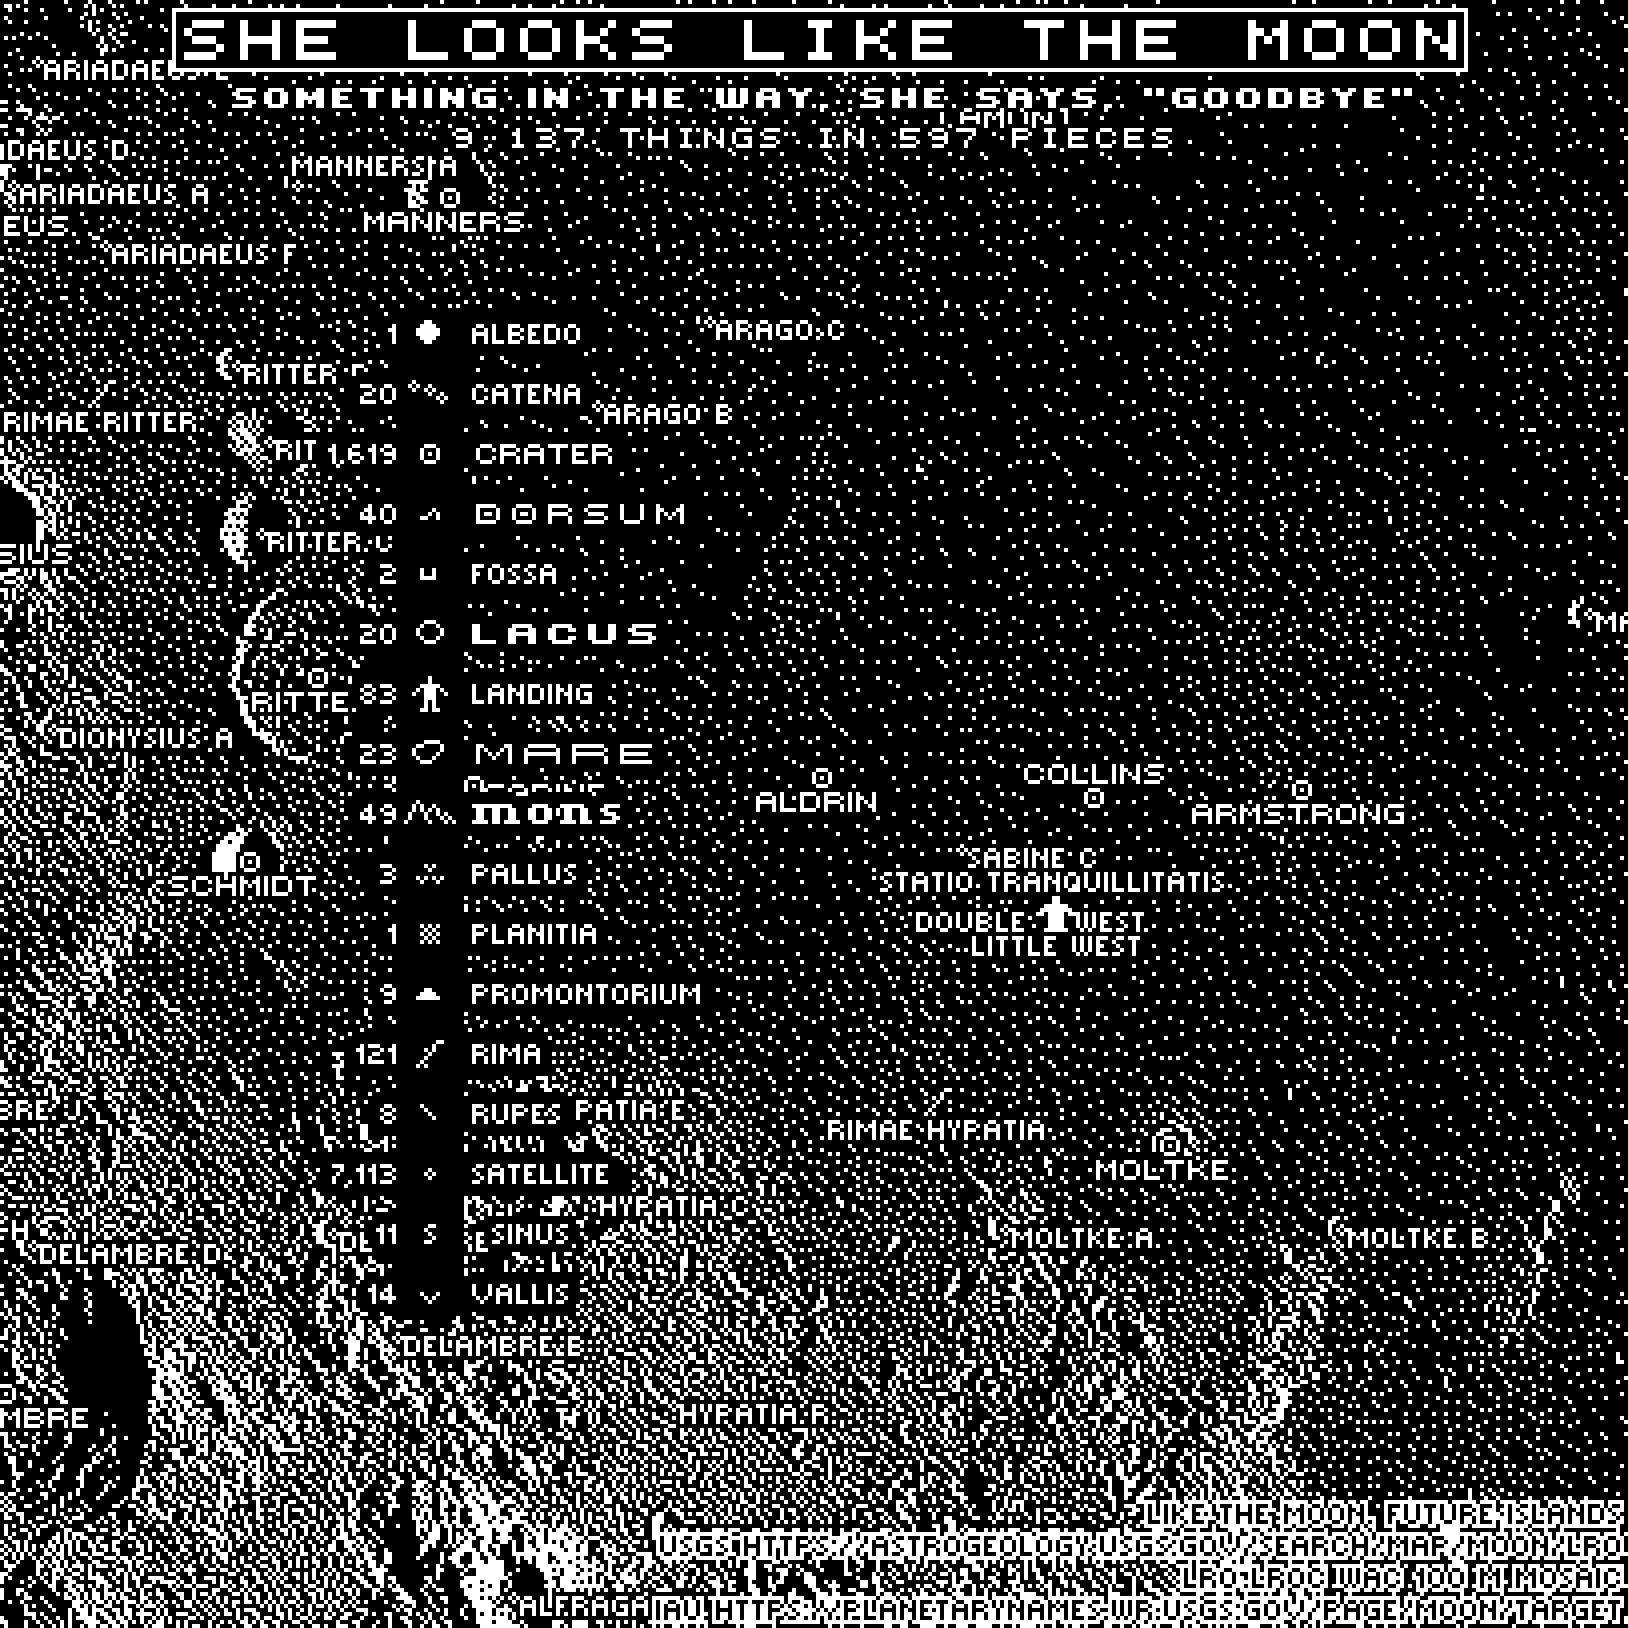
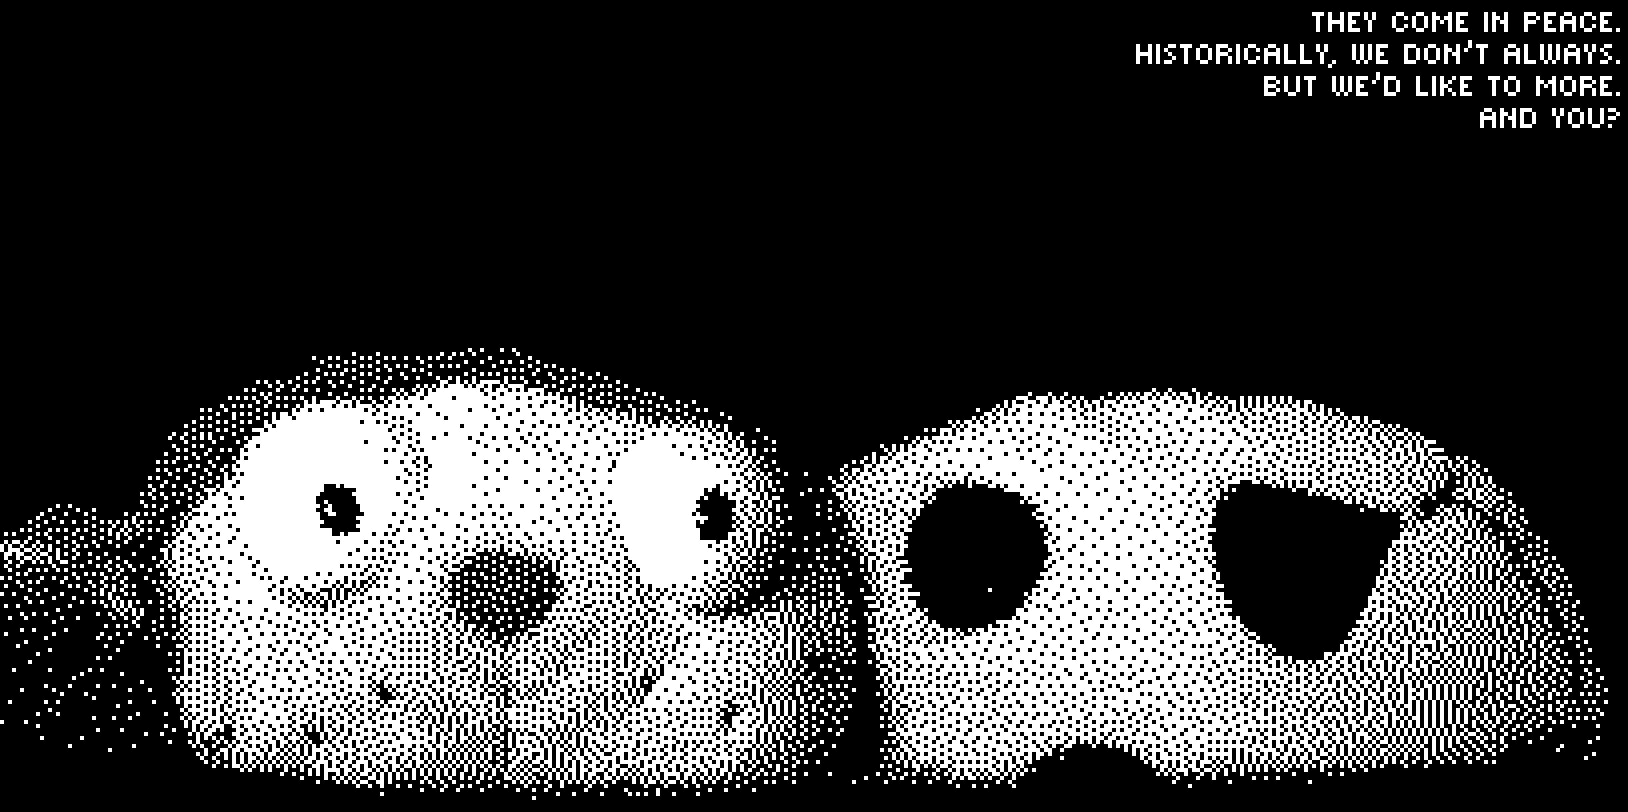
The first female disc has a moon map puzzle. The “She looks like the Moon” is a reference to Like the Moon by Future Islands.
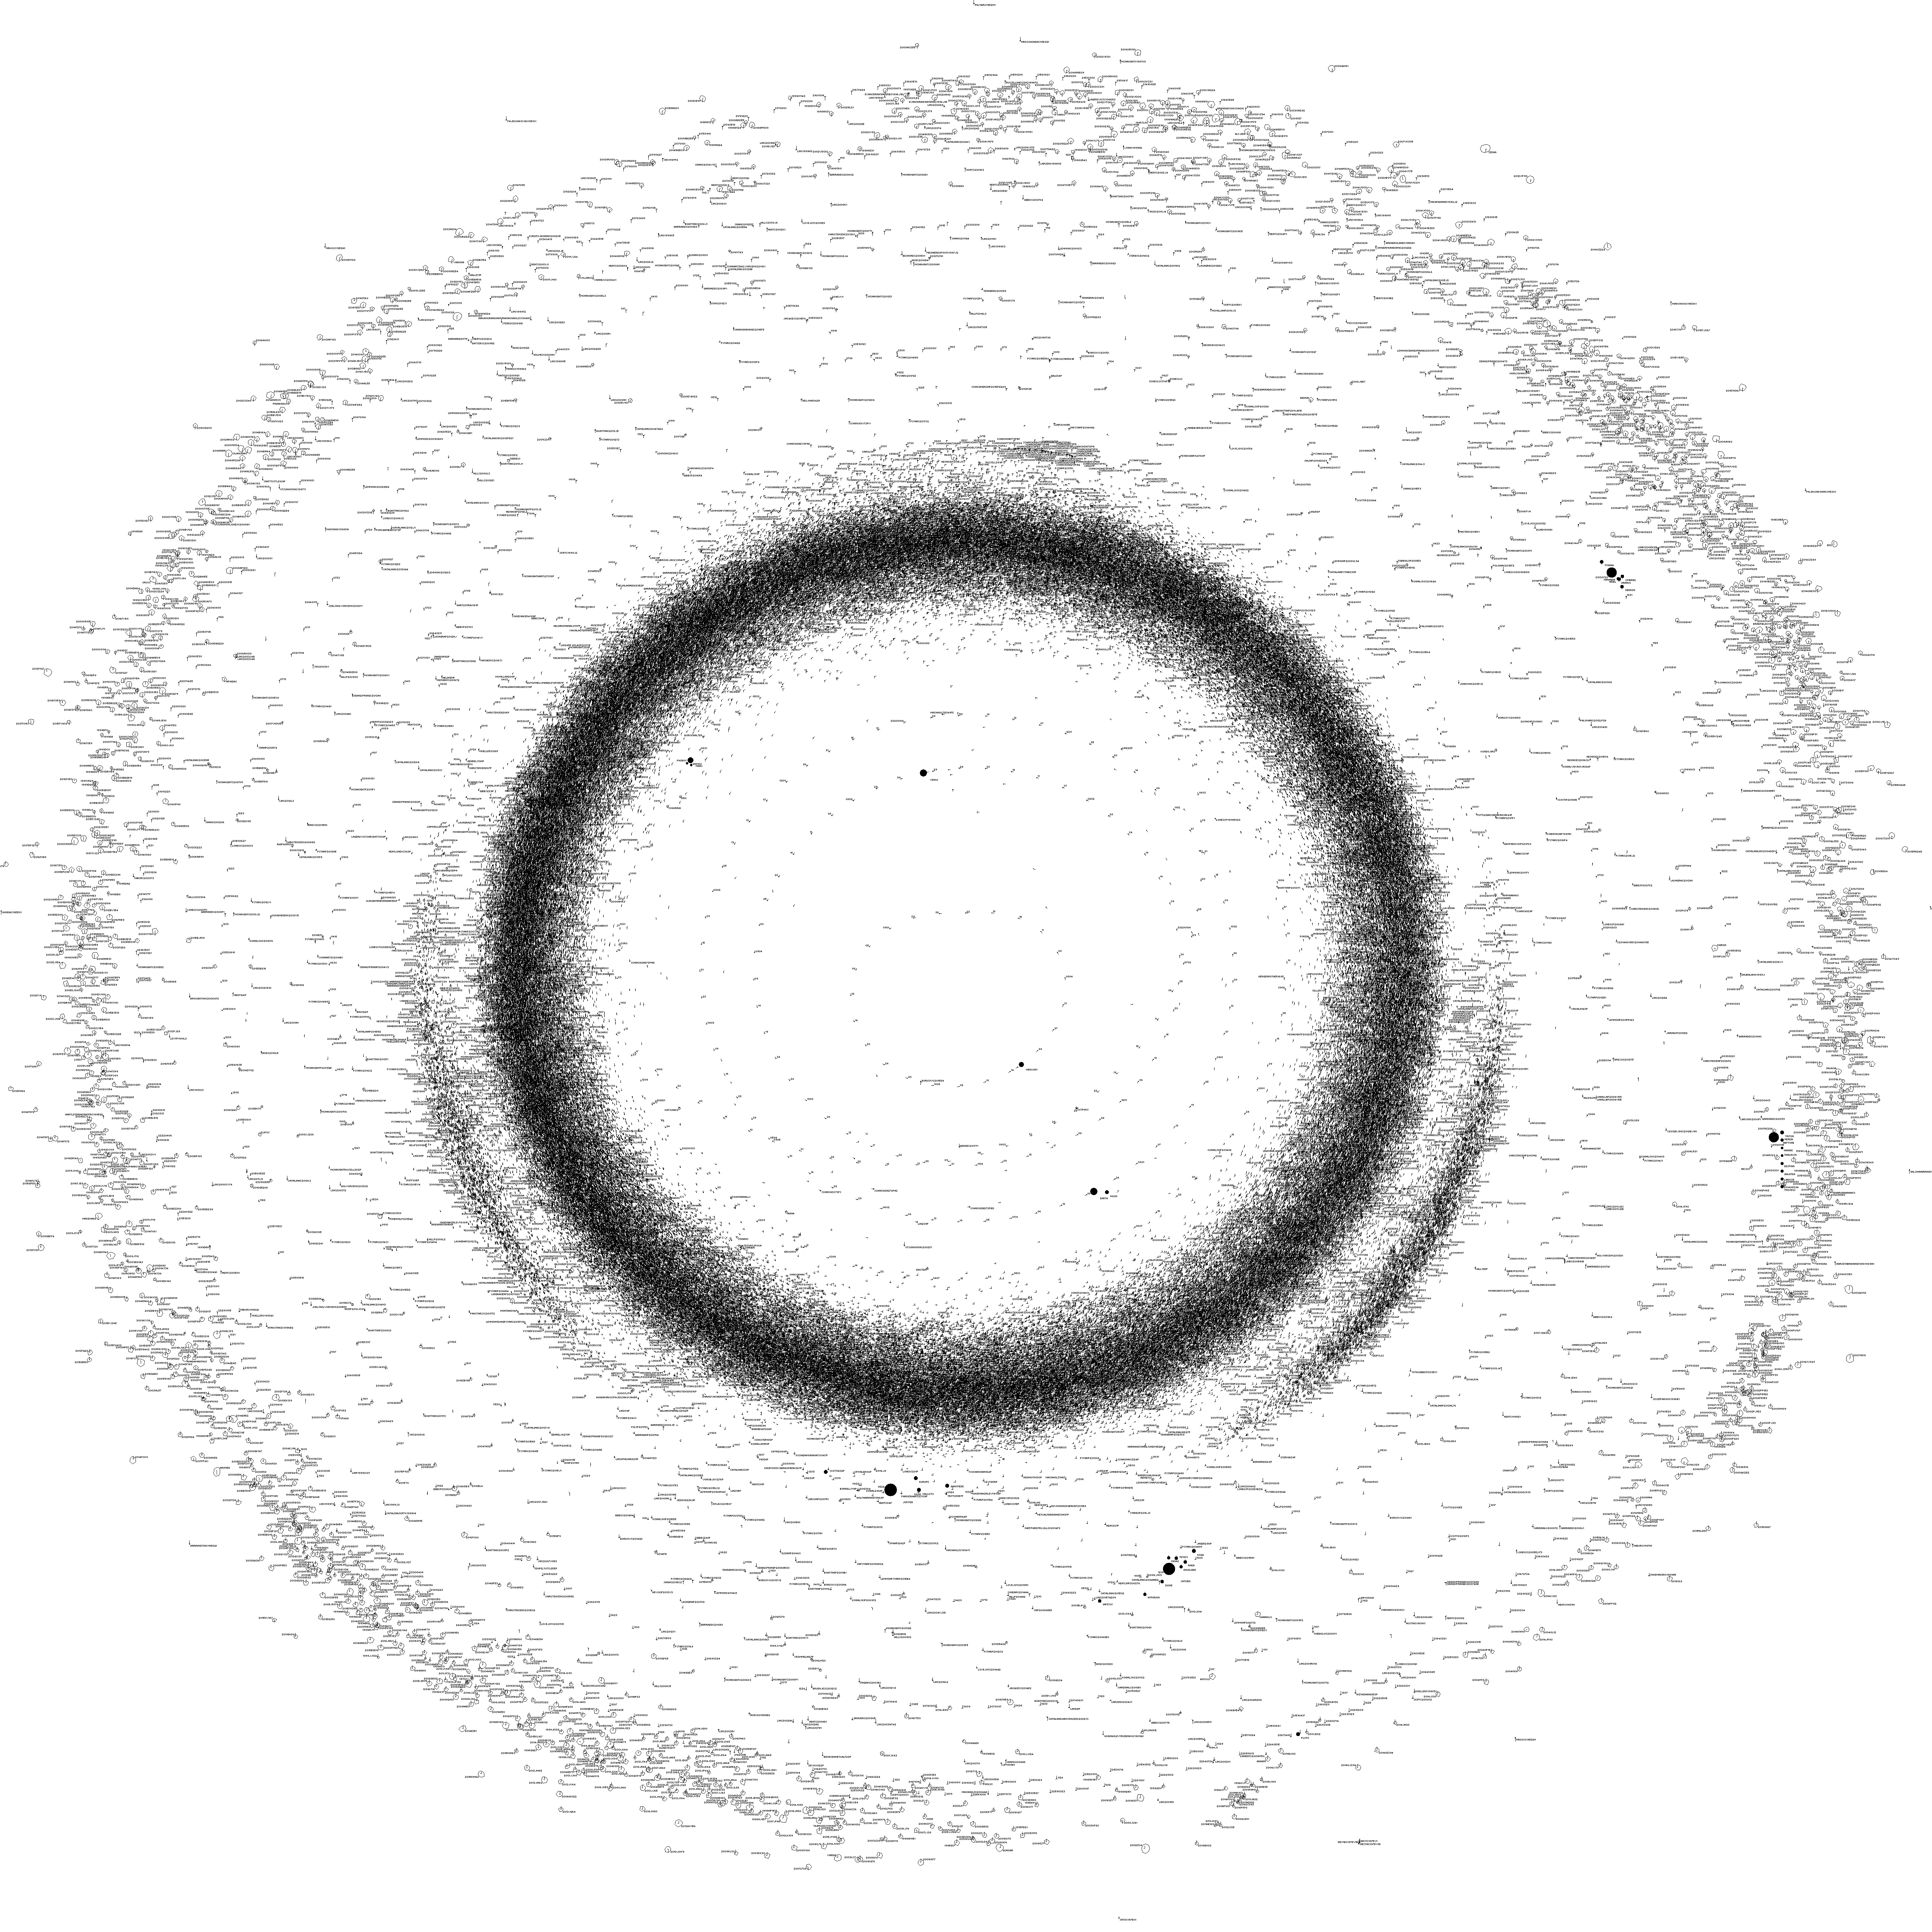
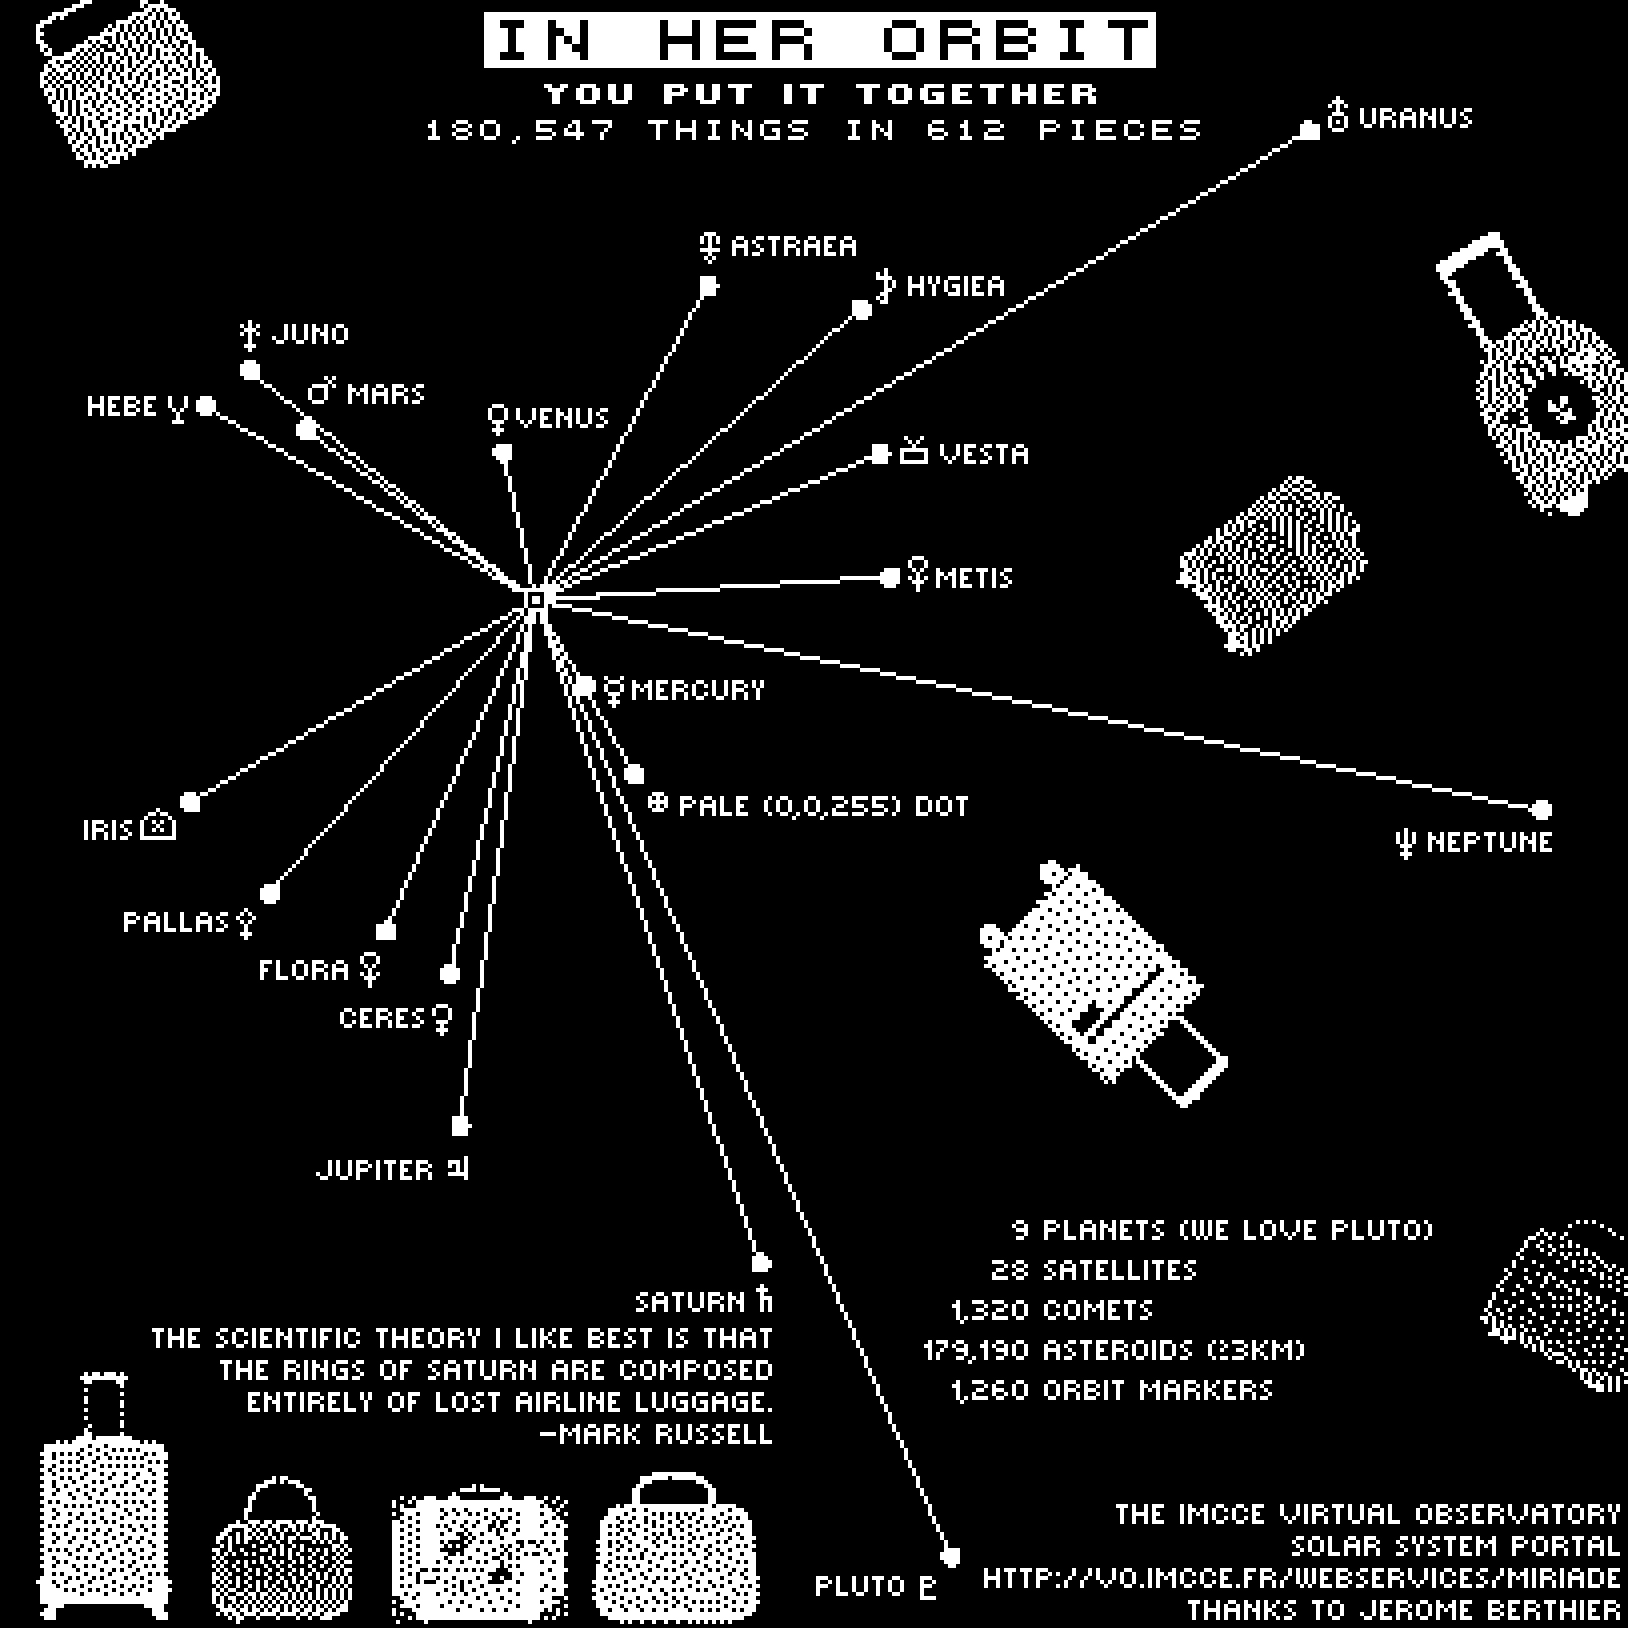
The second female disc has the solar system. Not everything in it but closeish to it.
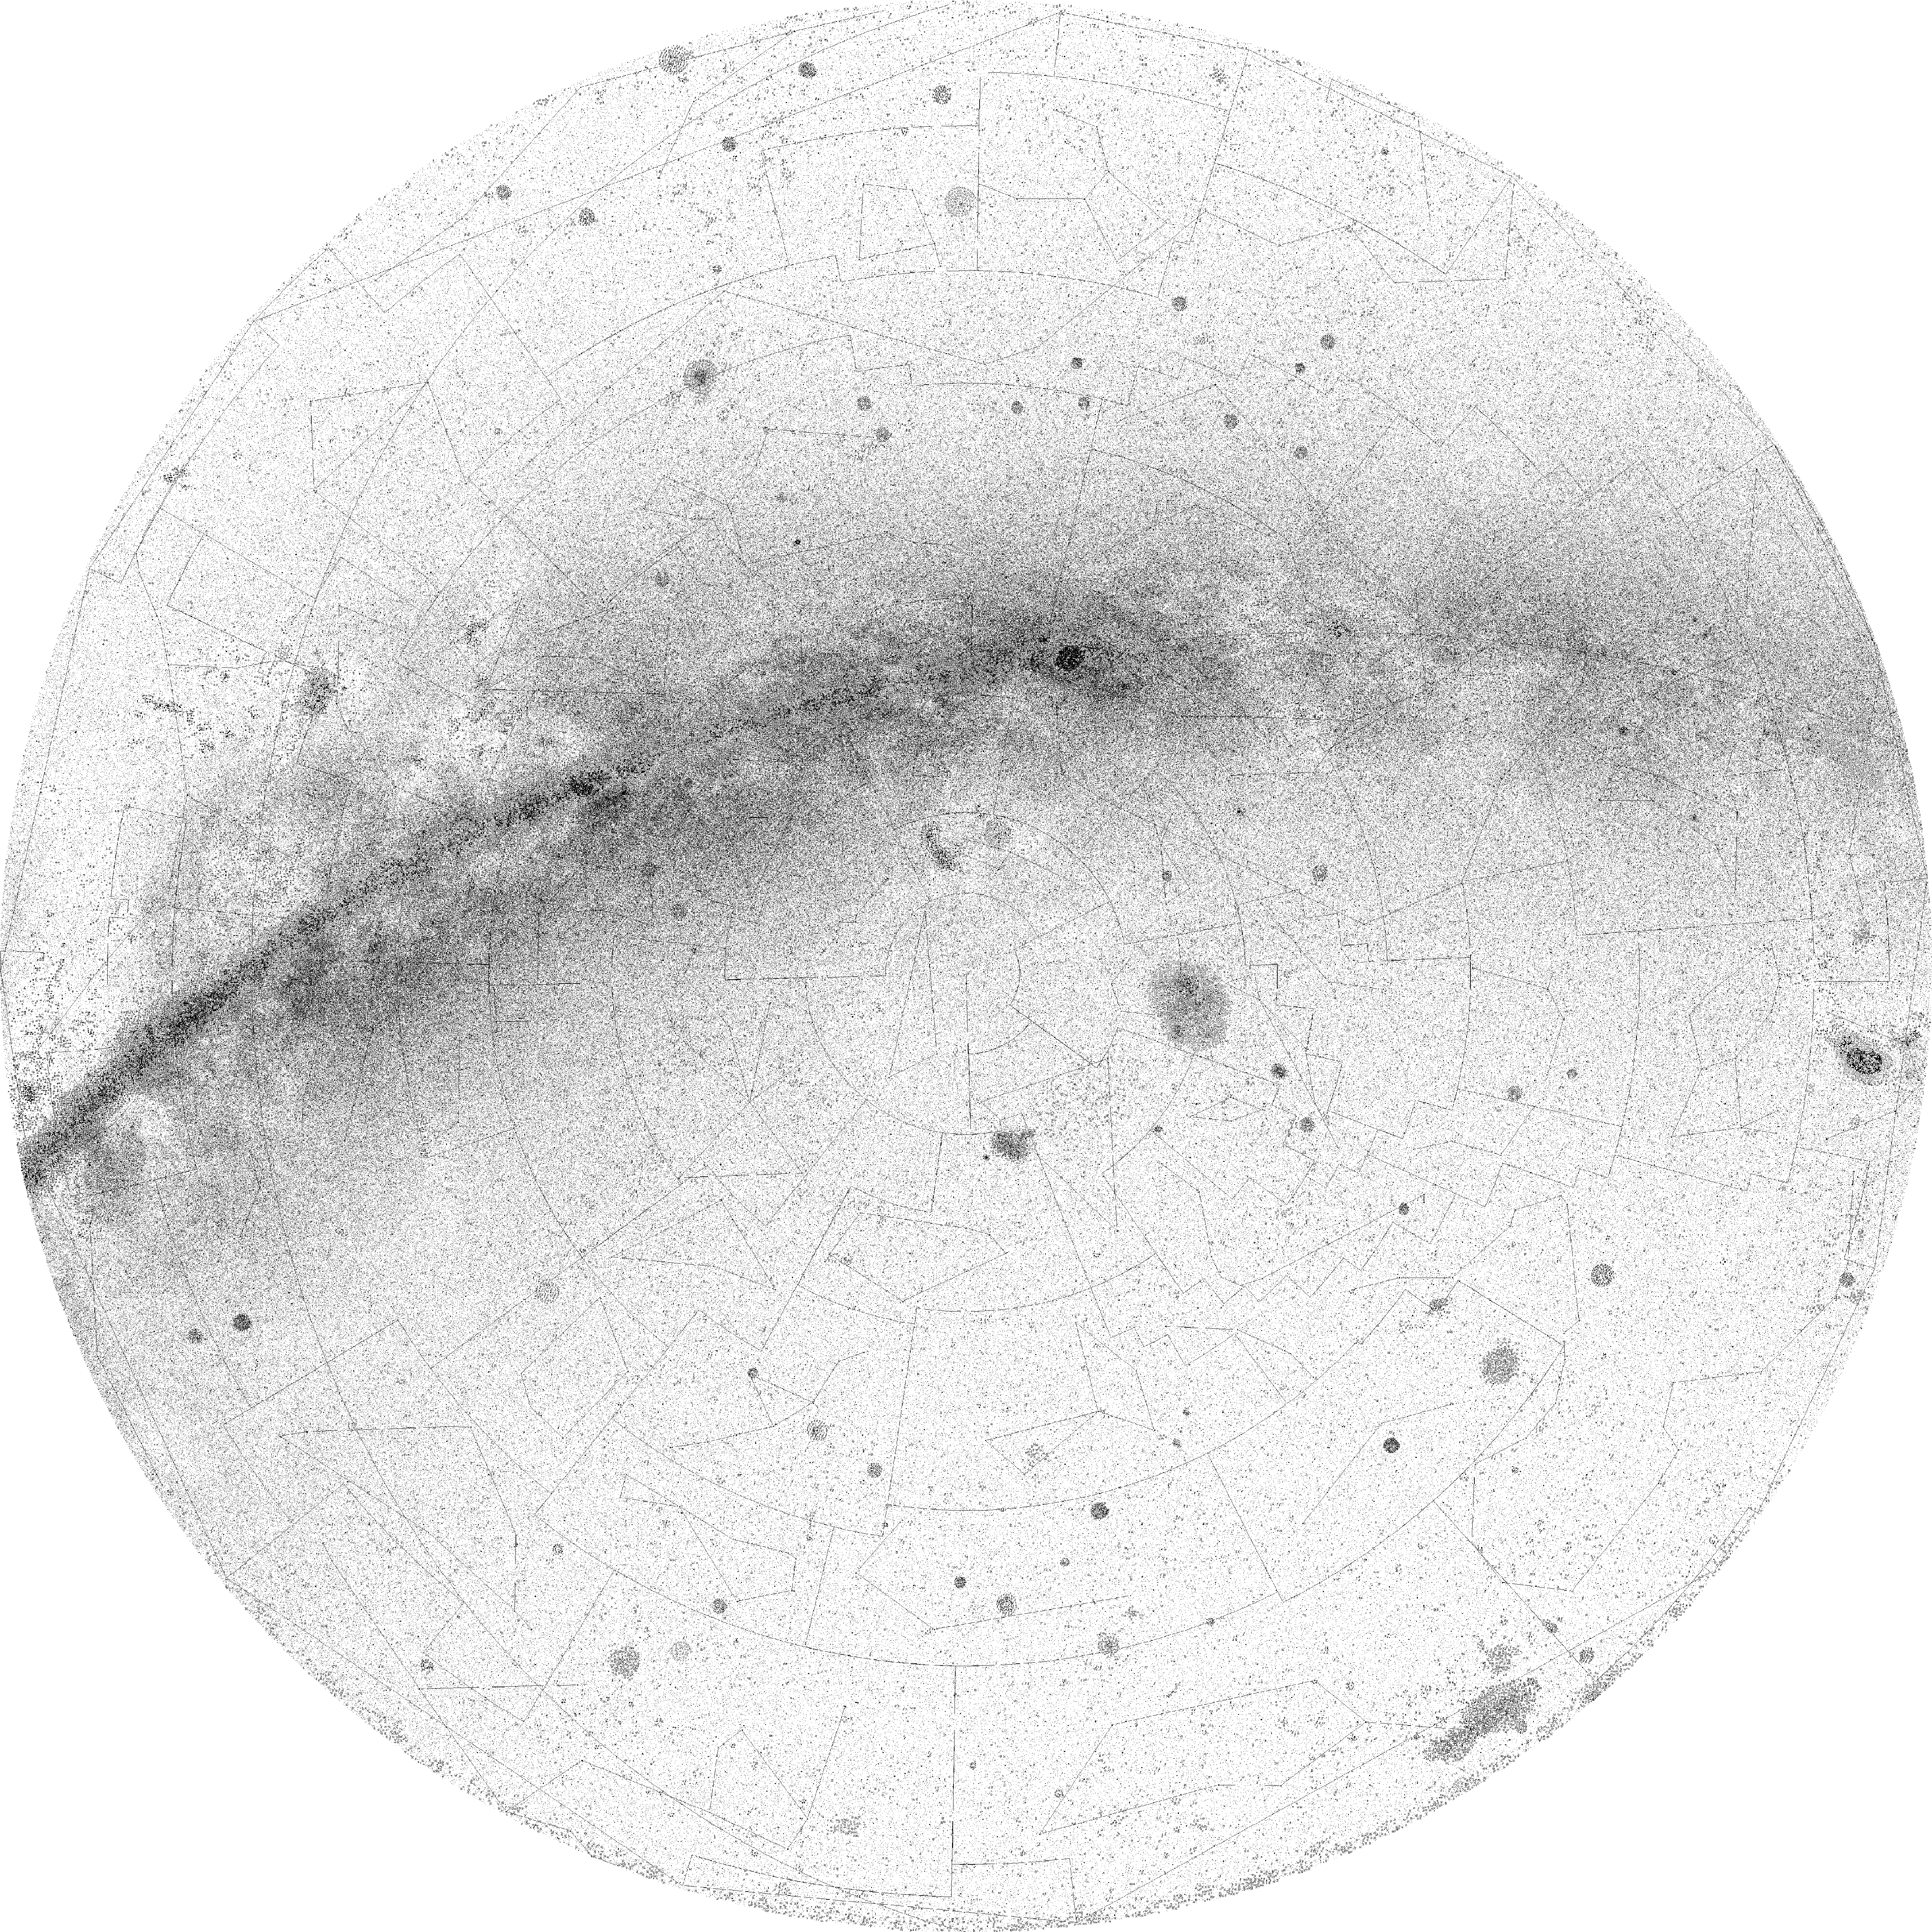
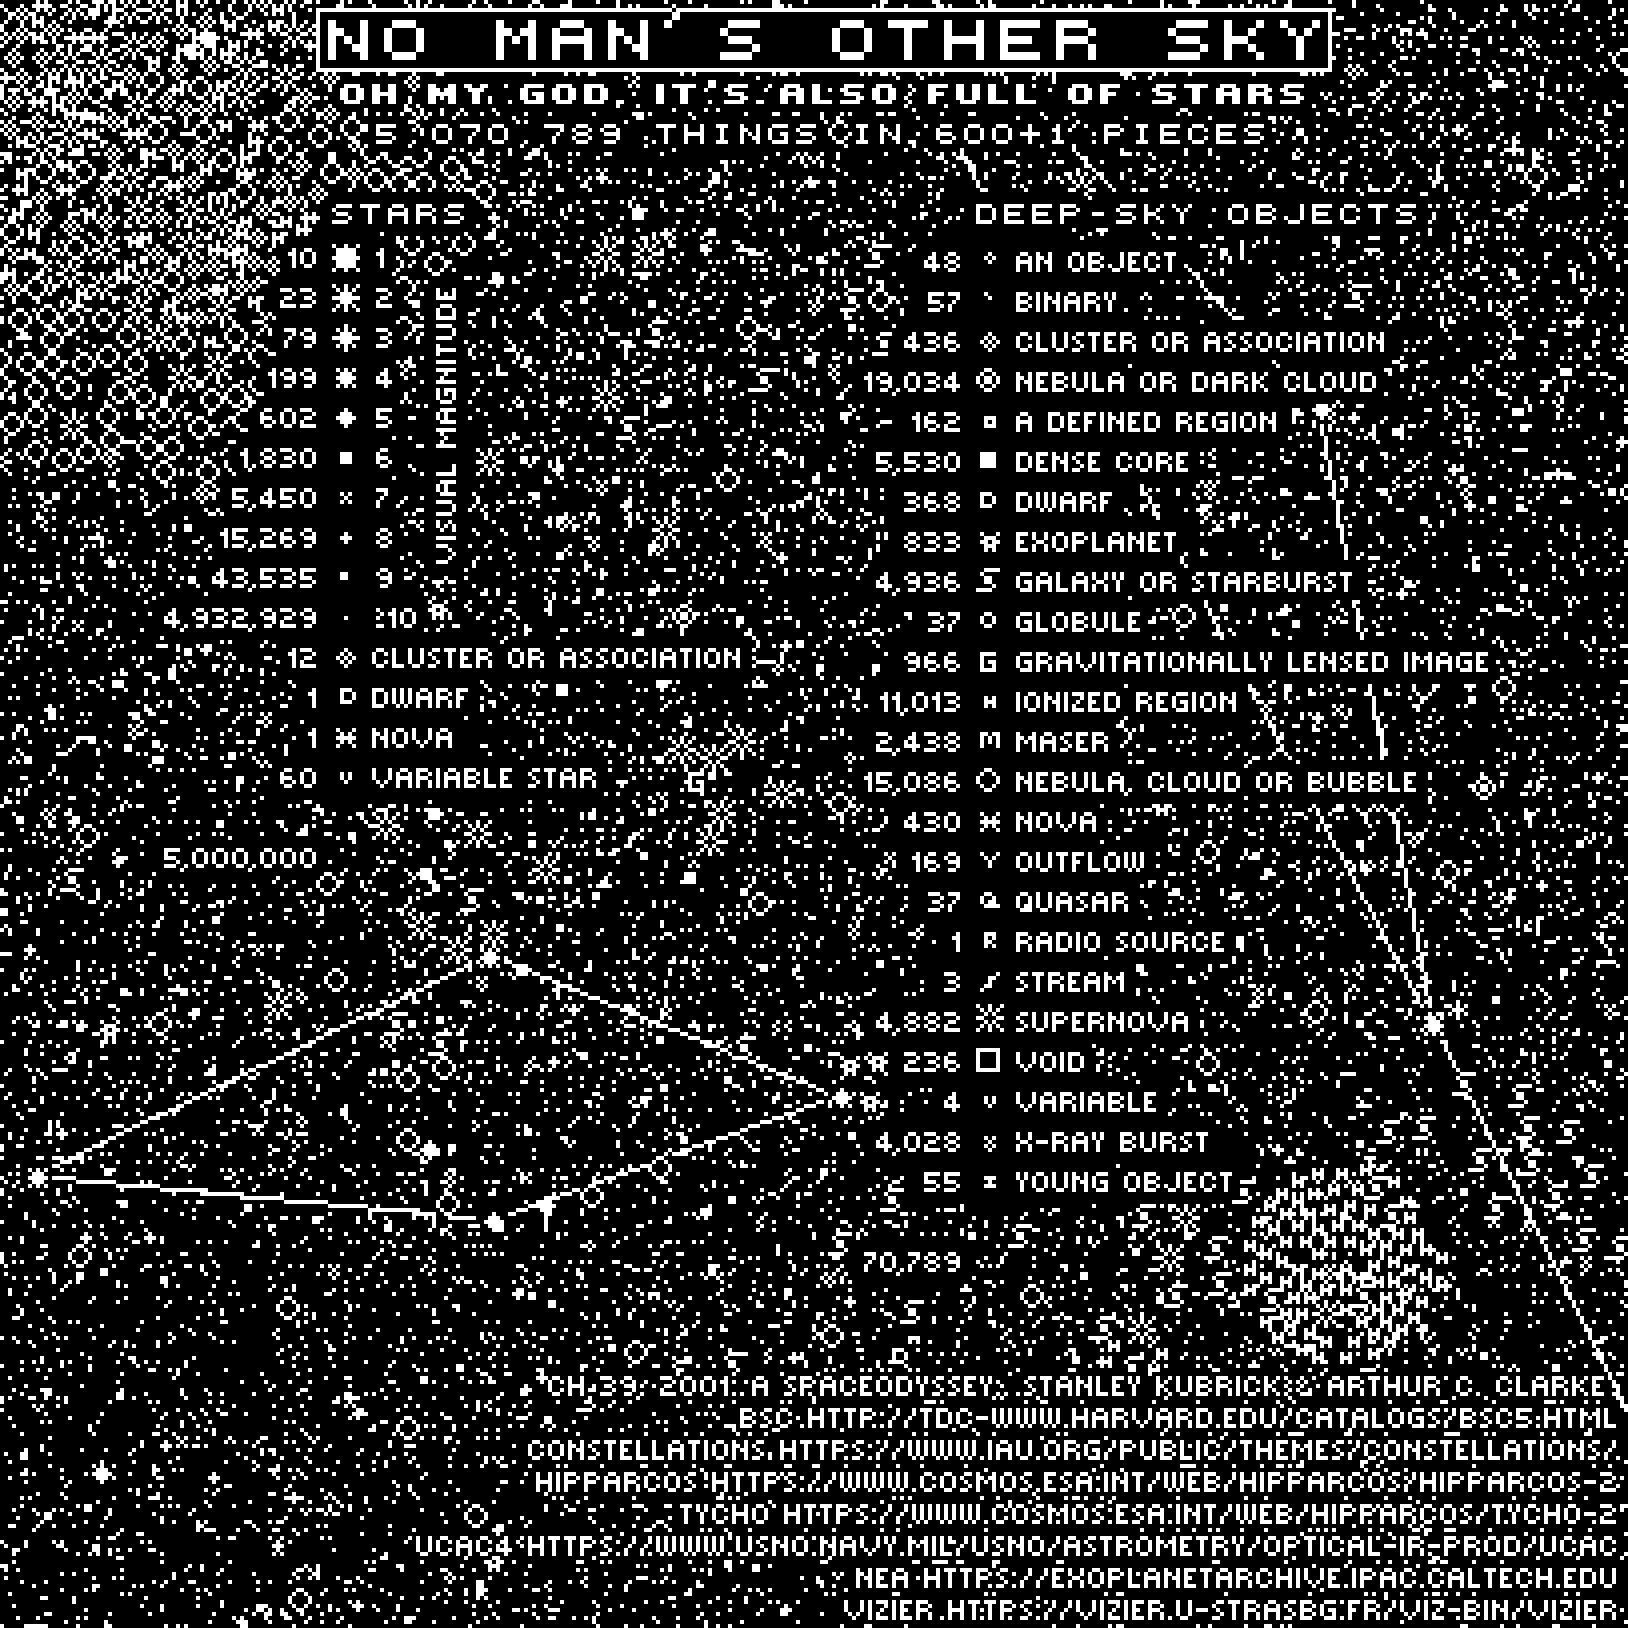
The north celestial hemisphere is the puzzle on the first male disc. Hence, ‘No Man's Sky’. Except that there is a man — on the disc. But it's not his sky. This is what I meant.
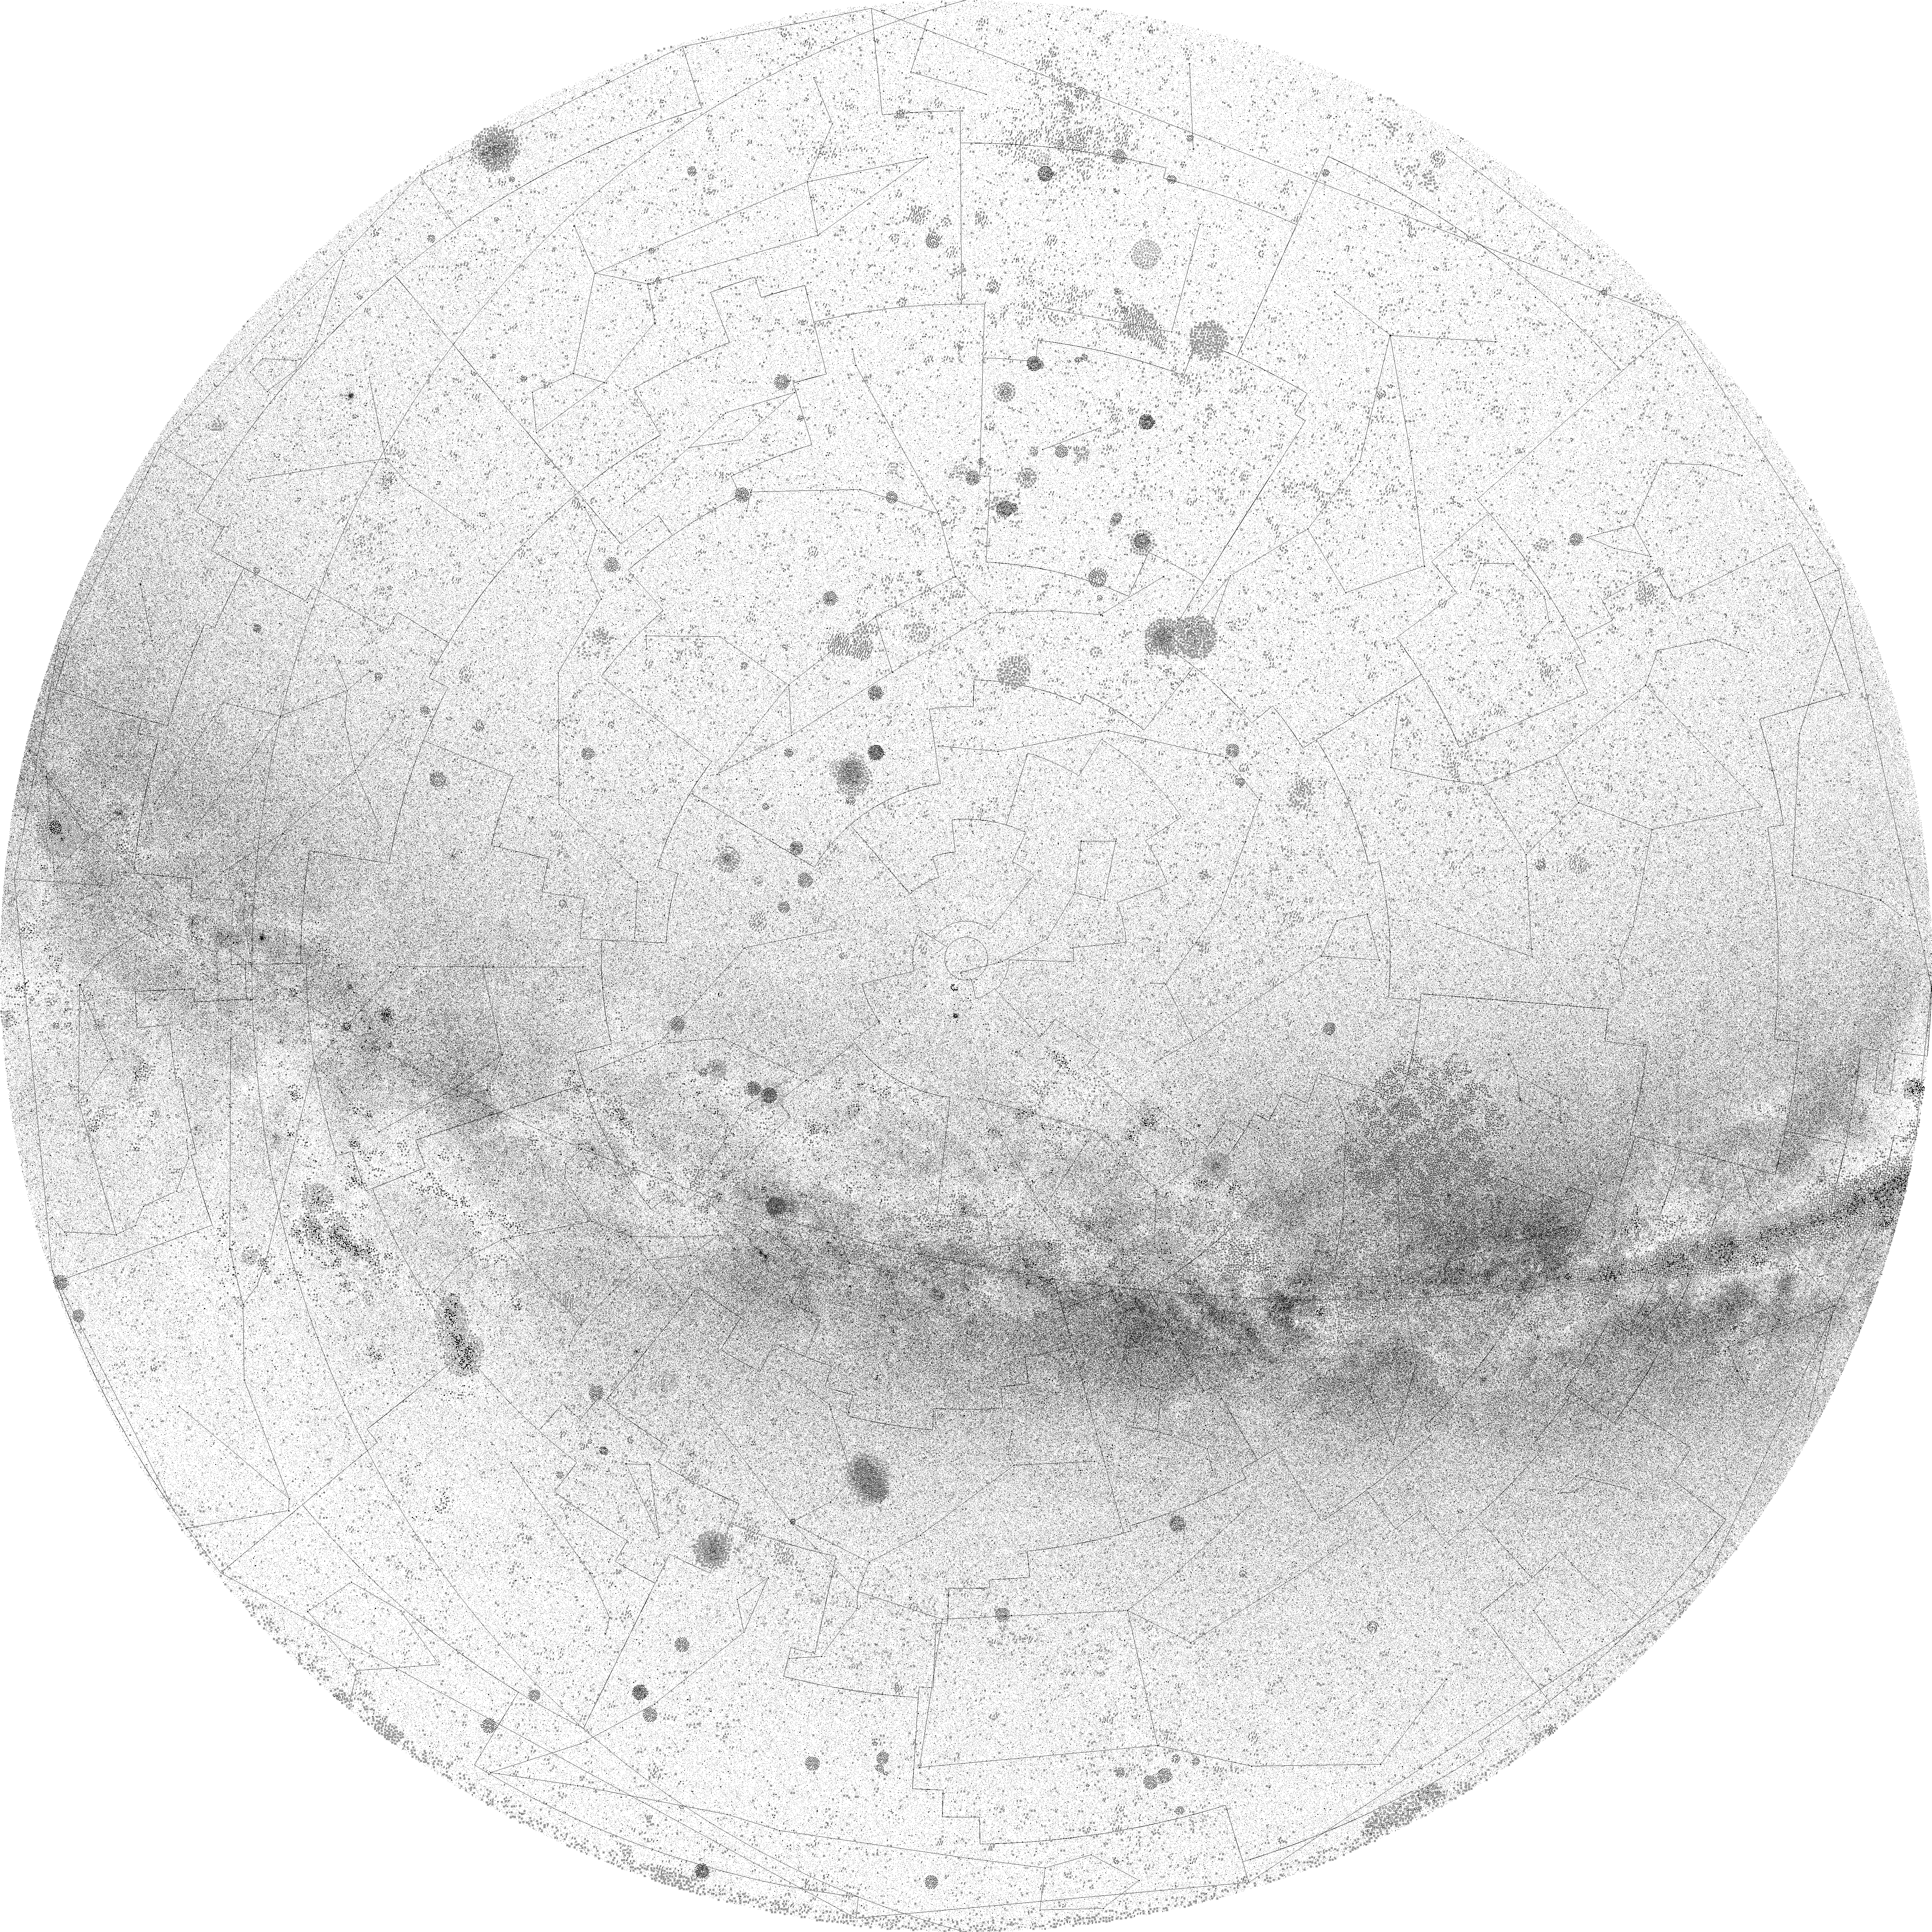
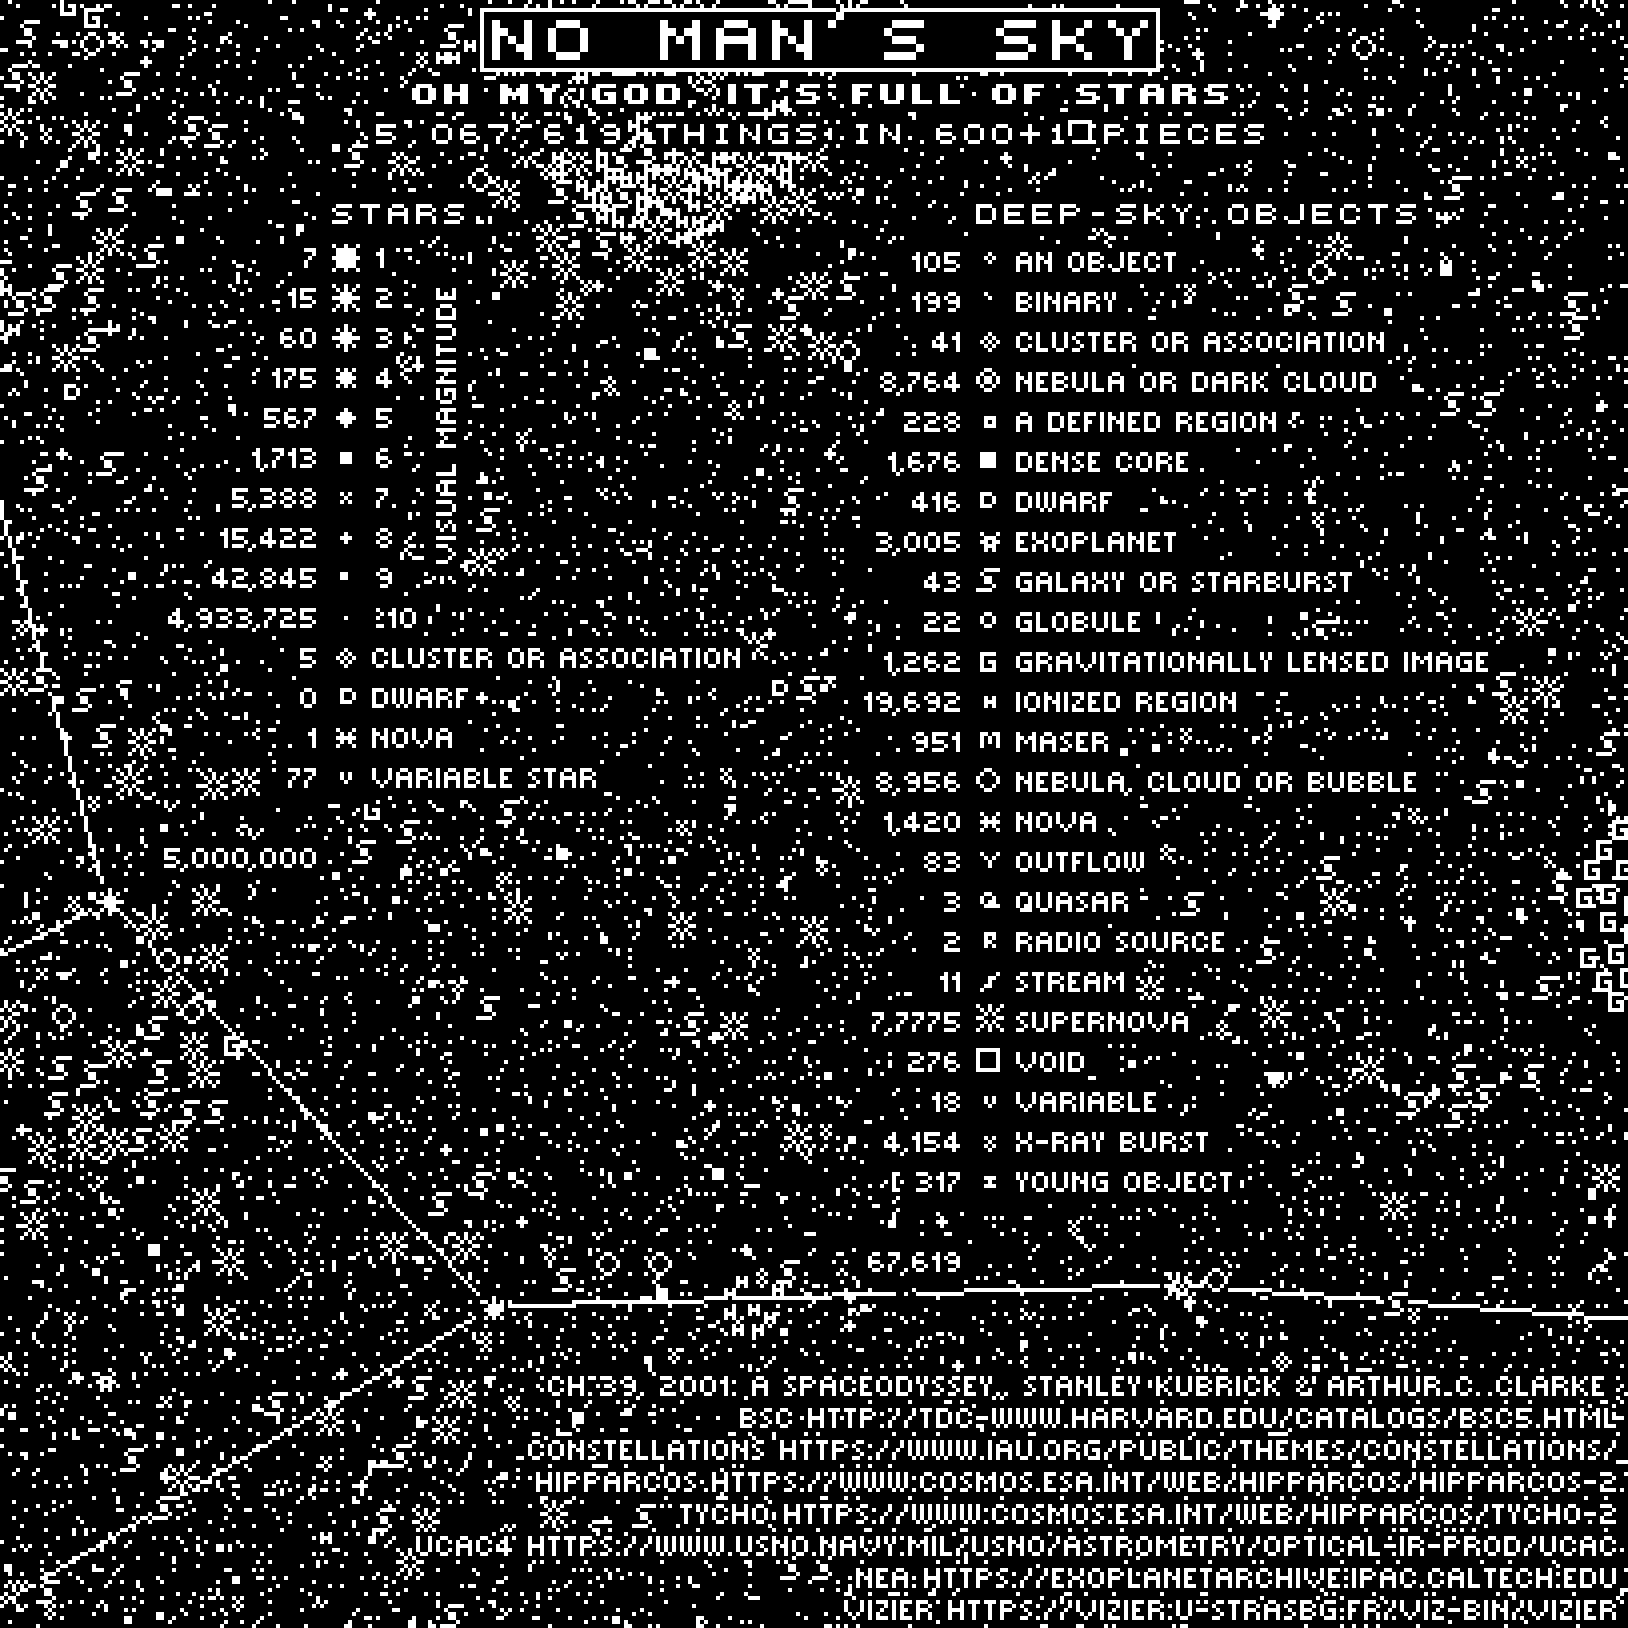
‘My God, it's also full of stars.’ Keep coruscatling, little buddies!
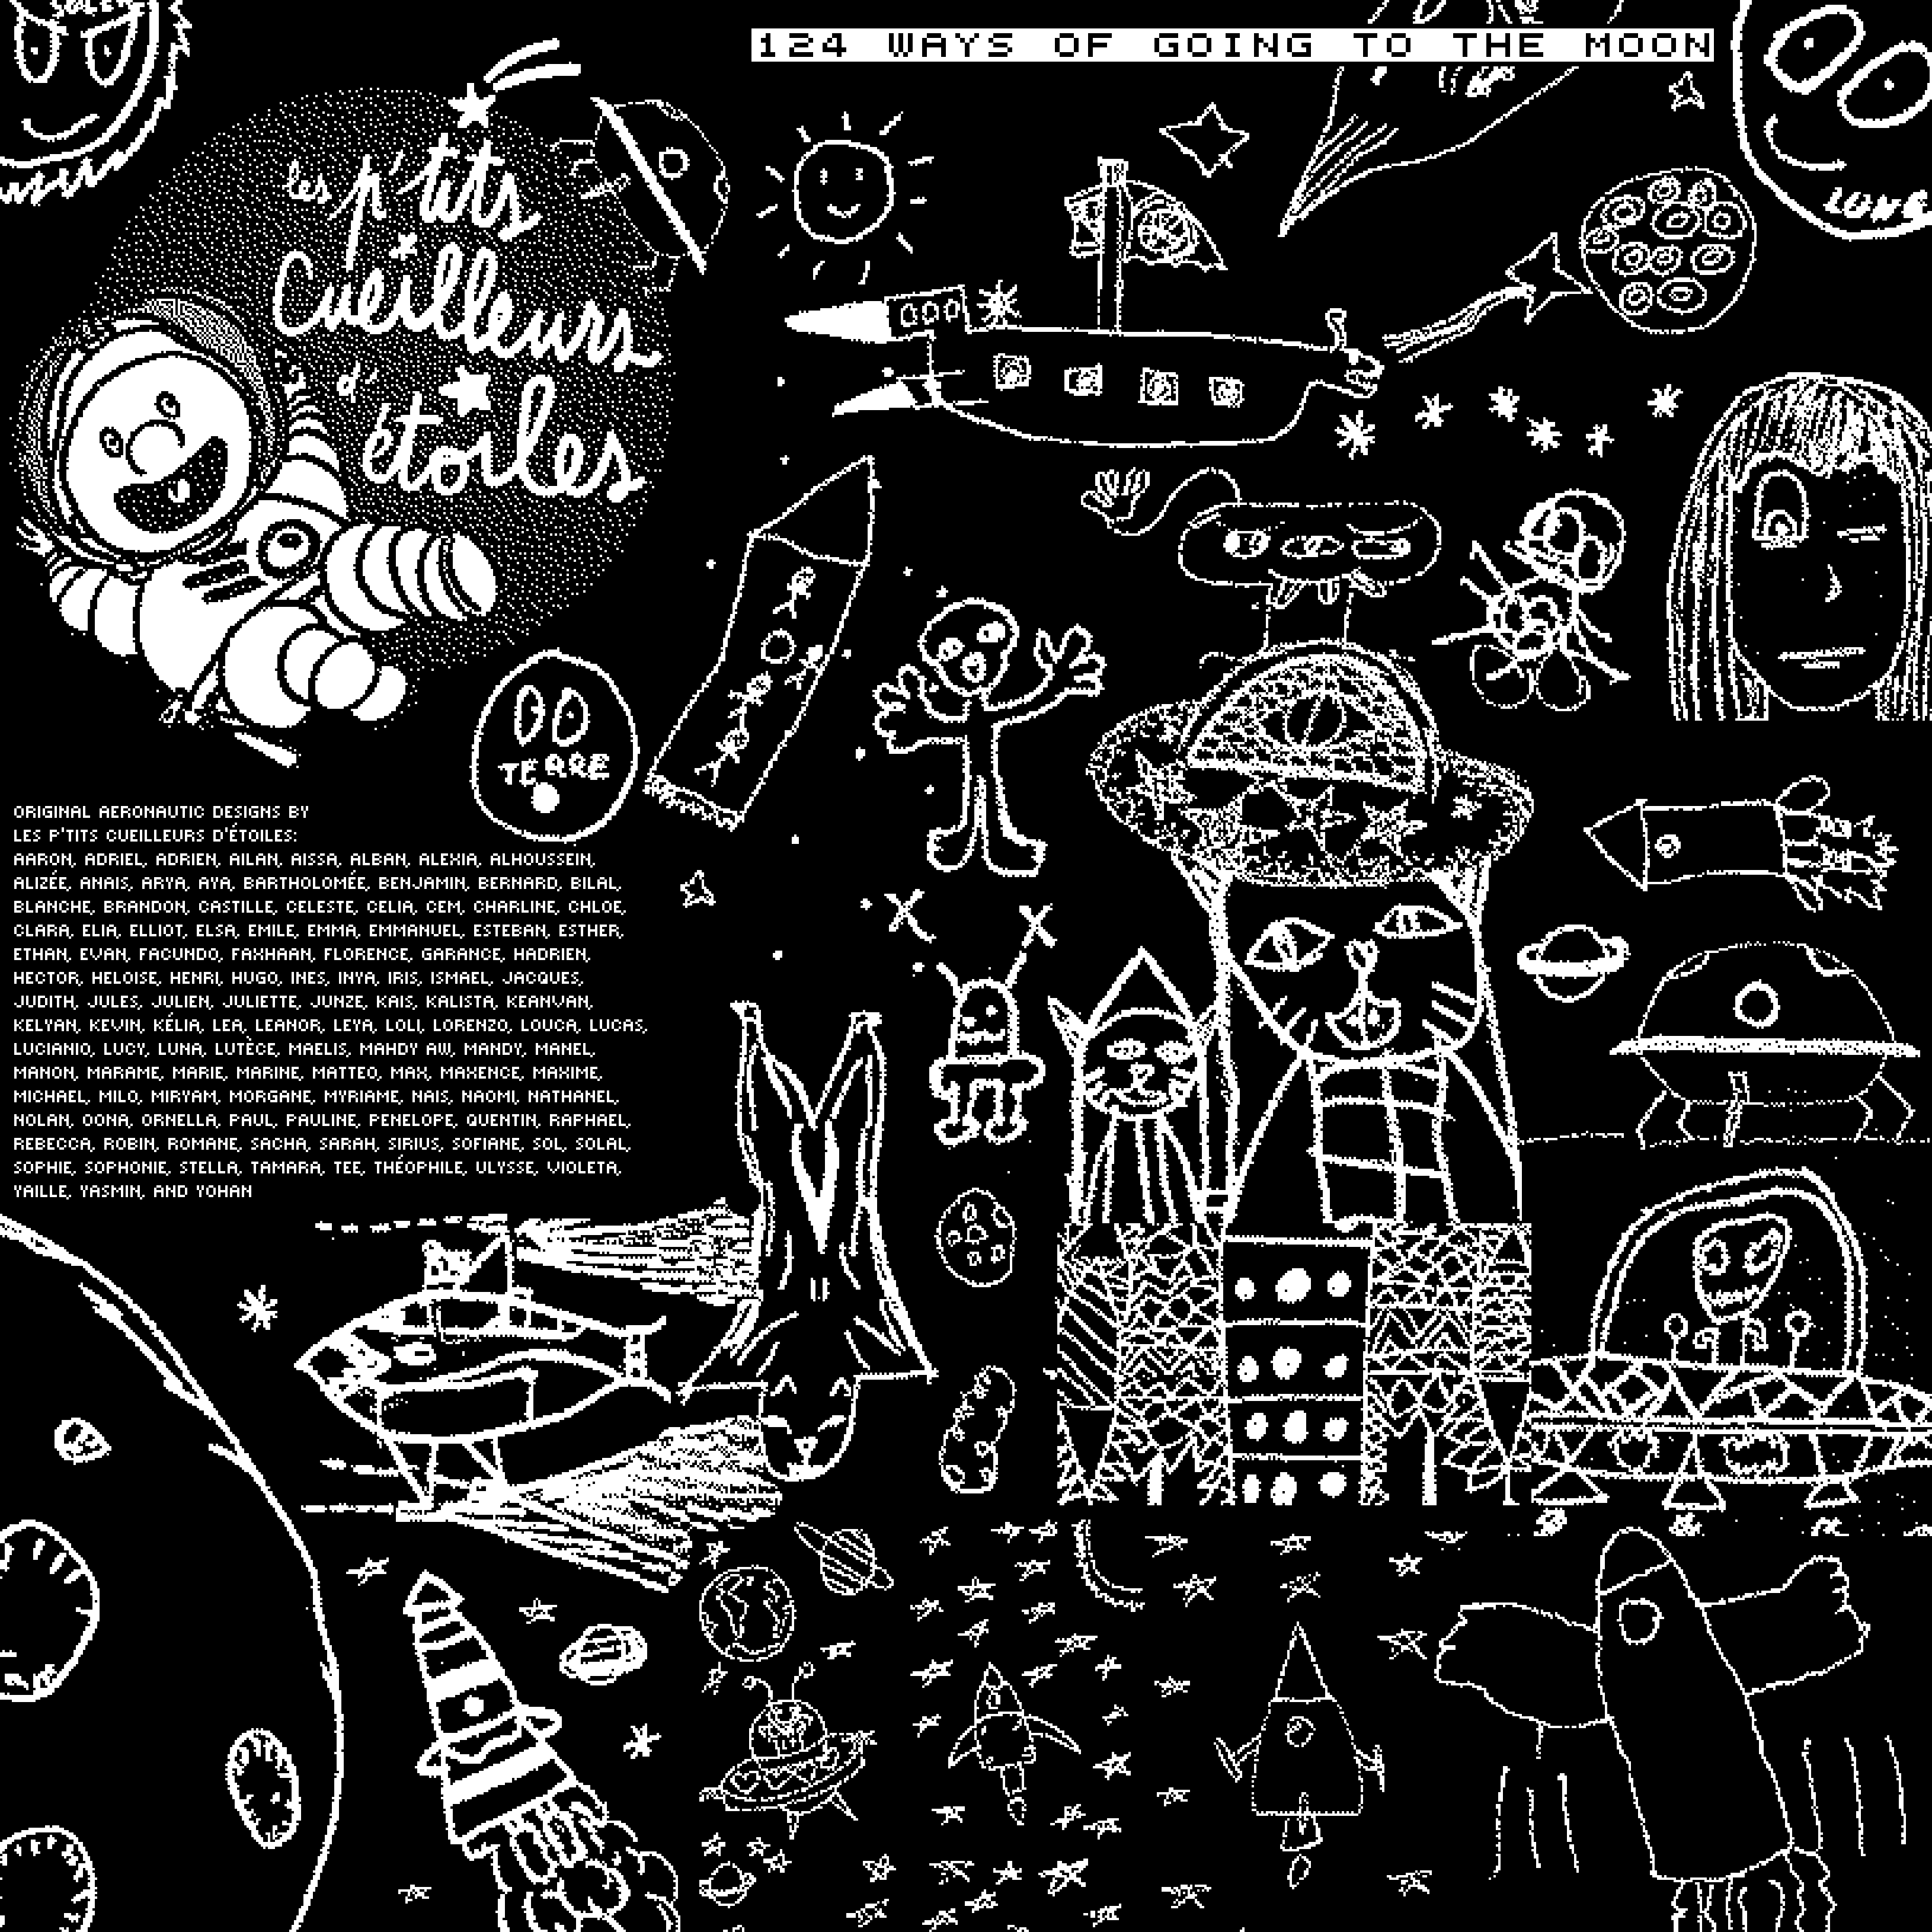
The first disc also contains a collection of 124 artworks by children undergoing treatment in Paris hospitals.
This was organized by Jean-Philippe Uzan who is part of the Les p'tits cueilleurs d'étoiles program (The Little Star Gatherers), designed to bring space to hospitalized children.
You can browse the full gallery.
There are many other curious things to find on the first disc. Here are some of them.
Beyond Belief Campaign BRCA Art
Fuelled by philanthropy, findings into the workings of BRCA1 and BRCA2 genes have led to groundbreaking research and lifesaving innovations to care for families facing cancer.
This set of 100 one-of-a-kind prints explore the structure of these genes. Each artwork is unique — if you put them all together, you get the full sequence of the BRCA1 and BRCA2 proteins.

Propensity score weighting
The needs of the many outweigh the needs of the few. —Mr. Spock (Star Trek II)
This month, we explore a related and powerful technique to address bias: propensity score weighting (PSW), which applies weights to each subject instead of matching (or discarding) them.

Kurz, C.F., Krzywinski, M. & Altman, N. (2025) Points of significance: Propensity score weighting. Nat. Methods 22:1–3.
Happy 2025 π Day—
TTCAGT: a sequence of digits
Celebrate π Day (March 14th) and sequence digits like its 1999. Let's call some peaks.

Crafting 10 Years of Statistics Explanations: Points of Significance
I don’t have good luck in the match points. —Rafael Nadal, Spanish tennis player
Points of Significance is an ongoing series of short articles about statistics in Nature Methods that started in 2013. Its aim is to provide clear explanations of essential concepts in statistics for a nonspecialist audience. The articles favor heuristic explanations and make extensive use of simulated examples and graphical explanations, while maintaining mathematical rigor.
Topics range from basic, but often misunderstood, such as uncertainty and P-values, to relatively advanced, but often neglected, such as the error-in-variables problem and the curse of dimensionality. More recent articles have focused on timely topics such as modeling of epidemics, machine learning, and neural networks.
In this article, we discuss the evolution of topics and details behind some of the story arcs, our approach to crafting statistical explanations and narratives, and our use of figures and numerical simulations as props for building understanding.

Altman, N. & Krzywinski, M. (2025) Crafting 10 Years of Statistics Explanations: Points of Significance. Annual Review of Statistics and Its Application 12:69–87.
Propensity score matching
I don’t have good luck in the match points. —Rafael Nadal, Spanish tennis player
In many experimental designs, we need to keep in mind the possibility of confounding variables, which may give rise to bias in the estimate of the treatment effect.

If the control and experimental groups aren't matched (or, roughly, similar enough), this bias can arise.
Sometimes this can be dealt with by randomizing, which on average can balance this effect out. When randomization is not possible, propensity score matching is an excellent strategy to match control and experimental groups.
Kurz, C.F., Krzywinski, M. & Altman, N. (2024) Points of significance: Propensity score matching. Nat. Methods 21:1770–1772.
Understanding p-values and significance
P-values combined with estimates of effect size are used to assess the importance of experimental results. However, their interpretation can be invalidated by selection bias when testing multiple hypotheses, fitting multiple models or even informally selecting results that seem interesting after observing the data.
We offer an introduction to principled uses of p-values (targeted at the non-specialist) and identify questionable practices to be avoided.

Altman, N. & Krzywinski, M. (2024) Understanding p-values and significance. Laboratory Animals 58:443–446.