


Science Advances Cover
6 January 2023, Issue 9, Volume 1
contents
Kijima, Y. et al. A universal sequencing read interpreter (2023) Science Advances 9.
The cover depicts three sets of 672 bases of barcode sequences, which are encoded onto 7-dimensional cubes. Three overlapping cubes are shown, one for each of the three sequencing platforms: 10X Chromium v3 scRNA-seq, Quartz-seq2, and Drop-seq.
Individual bases are encoded by oriented triangles on each of the 2-dimensional faces of the cube (of which there are 672). I created various designs and in the one chosen by Science Advances, the triangles are 7.5% of their full size (more details).
Science Advances caption: DNA sequencing read translation in high-dimensional space. The cover image was created when 672 bases of sequencing barcodes generated by three different single-cell RNA sequencing platforms were encoded as oriented triangles on the faces of three 7-dimensional cubes. Kijima et al. have developed a software tool that interprets DNA sequences to extract encoded information for additional biological analysis. The tool called, INTERSTELLAR, will facilitate development of sequencing-based experiments and sharing of data analysis pipelines.


We wanted to create some kind of high-dimensional encoding of sequences. For this, I looked back to my collaboration with Max Cooper's for his Ascent video from his Unspoken Words album.
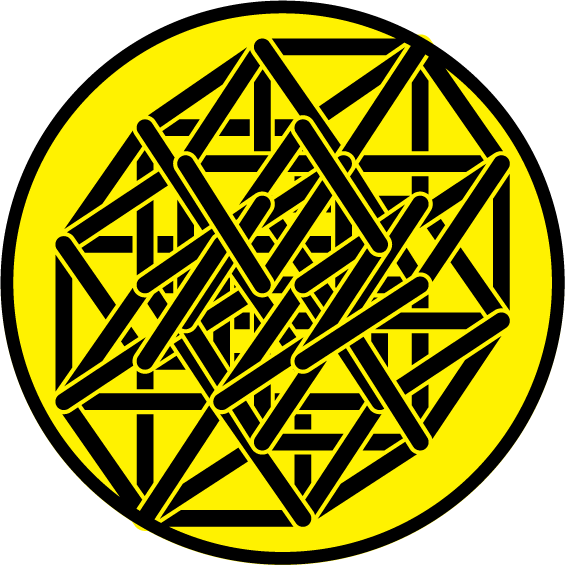
In ascent, we animated multiple 5-dimensional cubes to create a flurries of lines and shapes — a promising direction for encoding sequences.
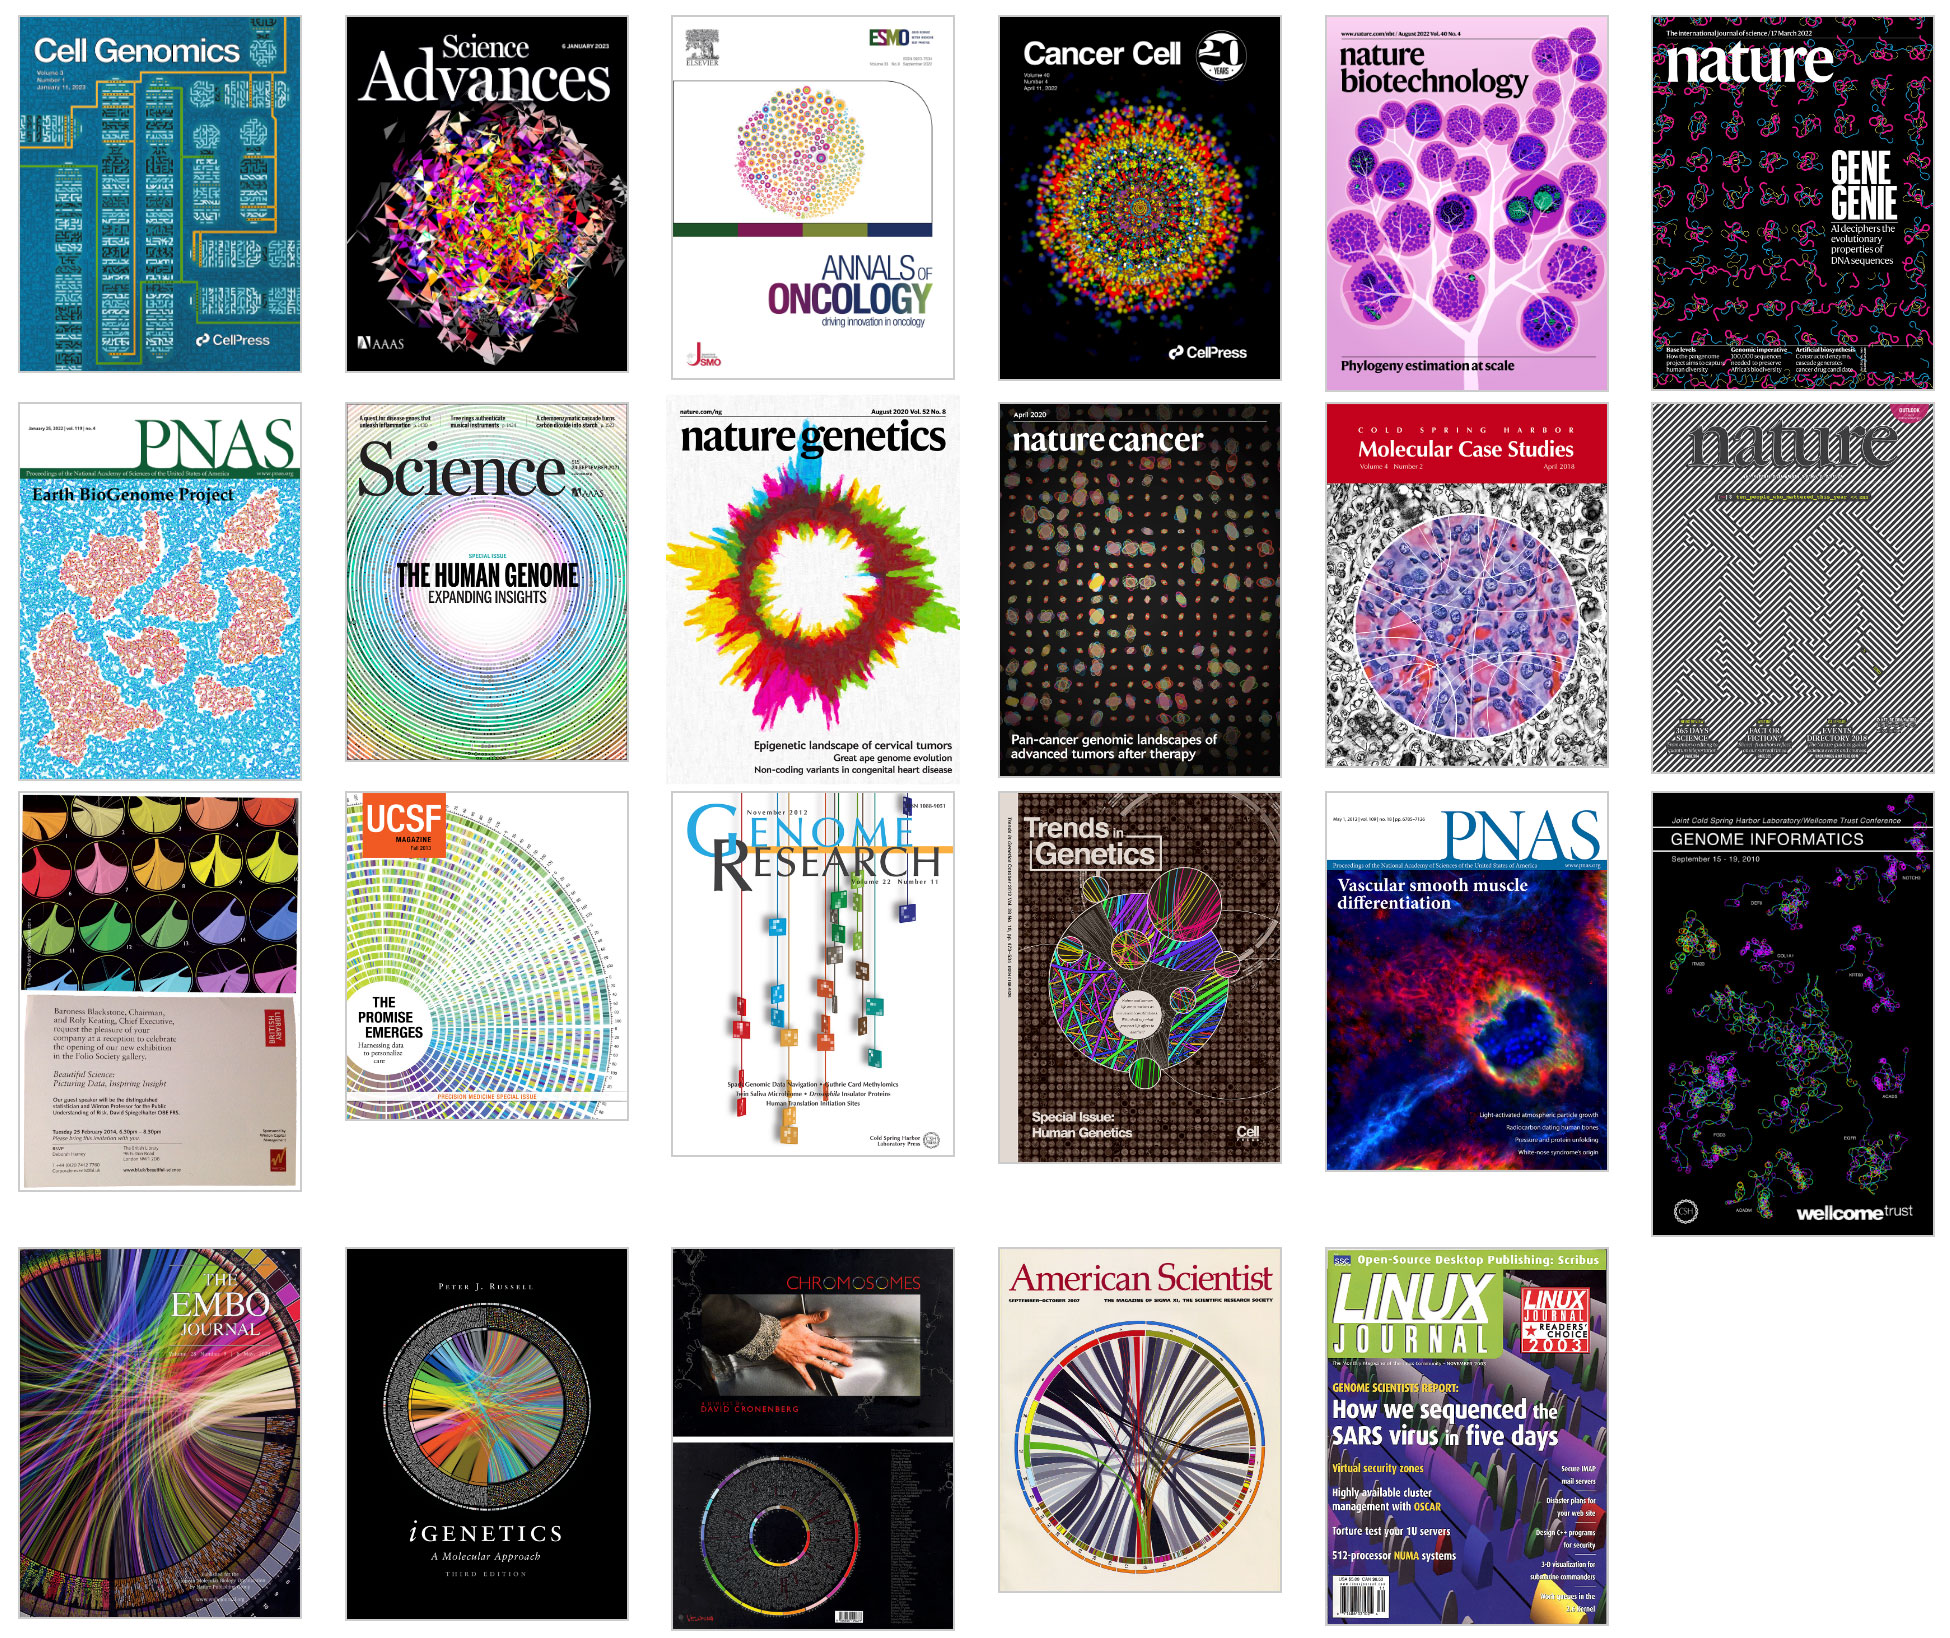
Browse my gallery of cover designs.
Consequences of missing data
Either I've been missing something or nothing has been going on. —Karen Elizabeth Gordon
Missing data are everywhere. Subjects may decline to participate in a survey or fail to answer sensitive questions. A cell culture might fail due to contamination. Instrument failures or mishandling of a sample may lead to missing observations. But why are missing data a problem?
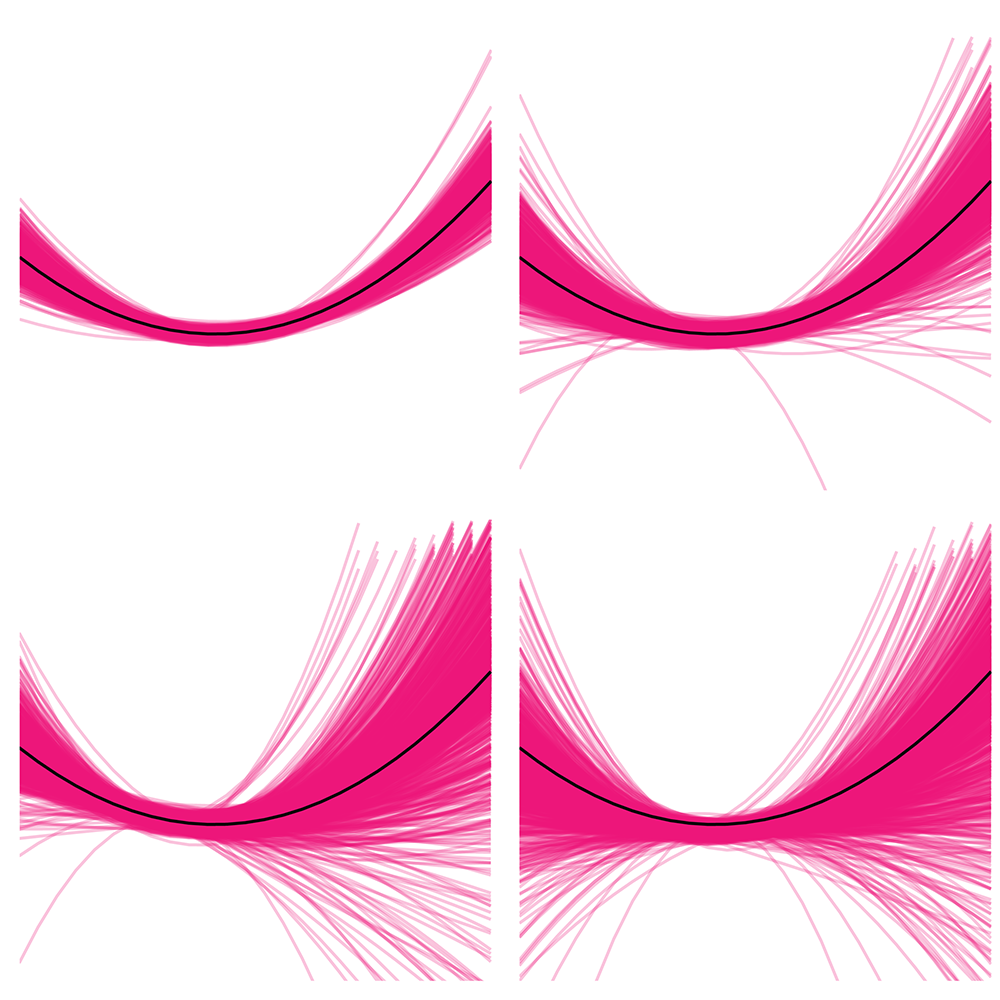
This month, we begin a series of articles about practical and statistical aspects of missing data. We'll see that missing data can increase variability and introduce bias and we will ask whether anything can be done to mitigate these consequences. It turns out that, in the case where we know nothing about the missing subjects, no mitigation is possible. We must accept higher variability and, if we have a suspicion that the missing subjects aren’t completely random, possible bias as well.
Tanujit Dey, T., Lipsitz, S.R., Fitzmaurice, G., Krzywinski, M. & Altman, N. (2026) Points of significance: Consequences of missing data. Nat. Methods 23:1661–1663.
Double Robustness
It is not certain that everything is uncertain. —Blaise Pascal
We have already explored how we can mitigate bias caused by confounding variables in observational studies using propensity score (PS) matching (PSM) and propensity score weighting (PSW). However, any statistical model is only as good as its assumptions and, if it is specified incorrectly, it can itself produce biased estimates of the treatment effect.
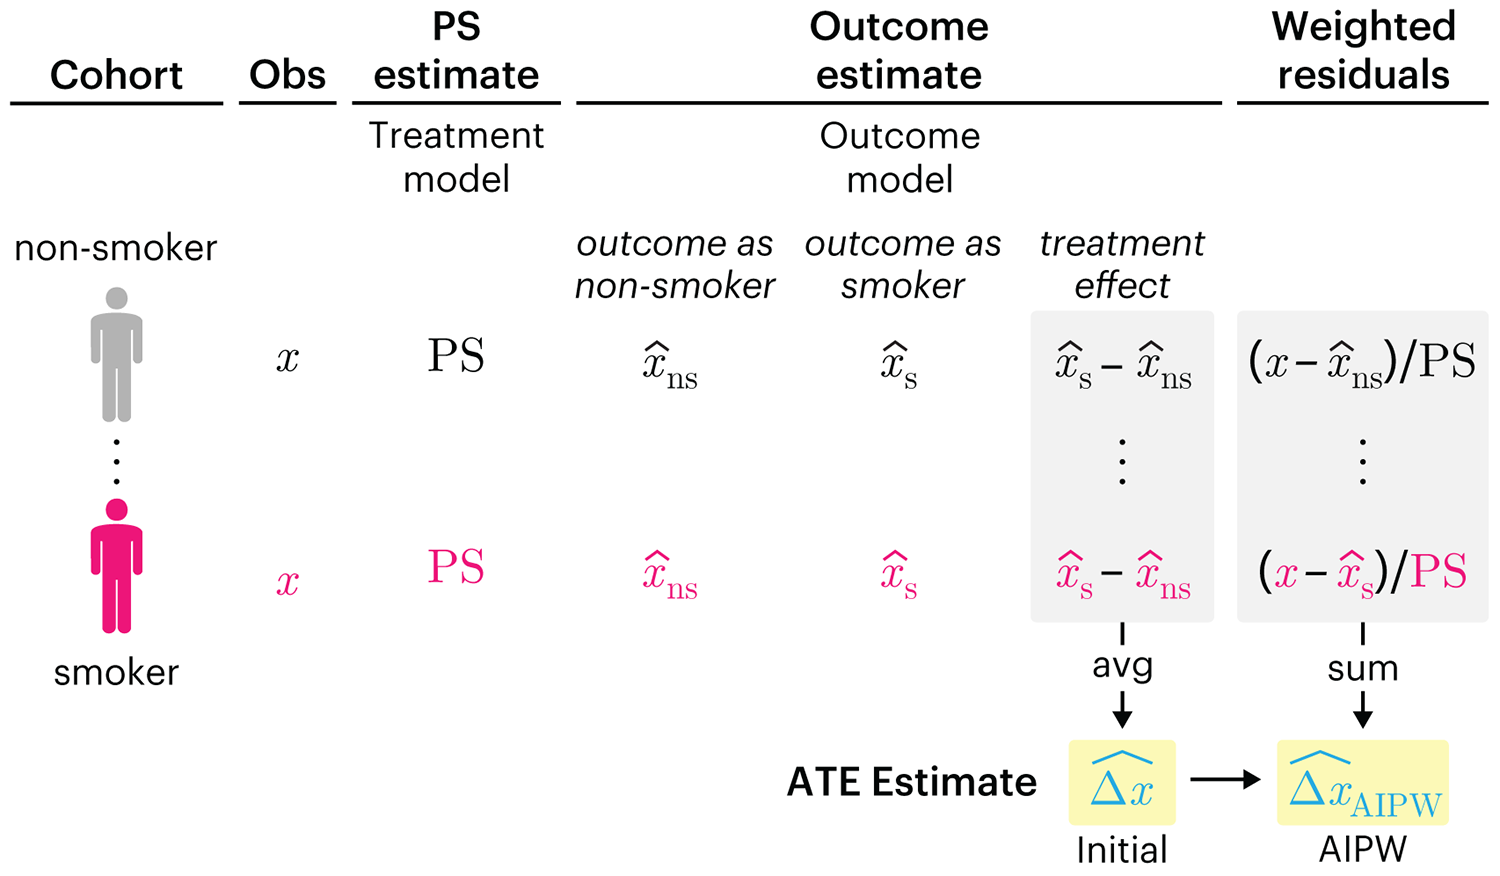
This month, we explore double robustness, a powerful statistical concept that provides a valuable “safety net” against the risk of an incorrect model. It offers two opportunities, instead of just one, to obtain a valid estimate of the treatment effect — making it possible to draw credible causal inferences from observational data without having to depend on a single set of modeling assumptions.
Kurz, C.F., Krzywinski, M. & Altman, N. (2026) Points of significance: Double Robustness. Nat. Methods 23:868–869.
Nature Biotechnology cover
My cover design on the 7 April 2026 Nature Biotechnology issue shows the dendrogram that represents a cluster of uniquely expressed (or downregulated) genes in human naive stem cells induced from such cells. Within each dendrogram block, the genomic barcode sequence (sampled from Supplementary Table 1) is depicted with a Code 39 barcode. The highlighted barcode is one of those used for cell isolation.
Ishiguro S. et al. A multi-kingdom genetic barcoding system for precise clone isolation (2026) Nature Biotechnology 44:616–629.

Browse my gallery of cover designs.
Happy 2026 π Day—
Art for the 5%
Celebrate π Day (March 14th) and enjoy the art — but only if you're part of the 5%.
Go ahead, see what you can't see.

Ishihara's Tests for Colour Deficiency
Authentic and accurate images of Ishihara's test plates photographed (and lovingly color-corrected) from the 38-plate Ishihara's Tests for Colour Deficiency.
I also provide the position, size, and color of each circle on each test plate.

