


 buy artwork
The art of Pi (`\pi`), Phi (`\phi`) and `e`
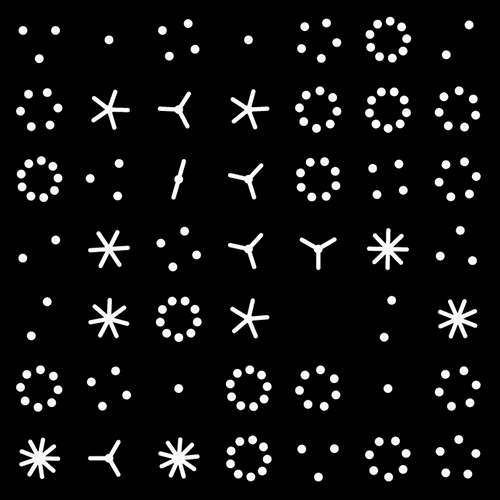


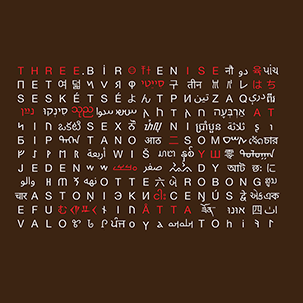
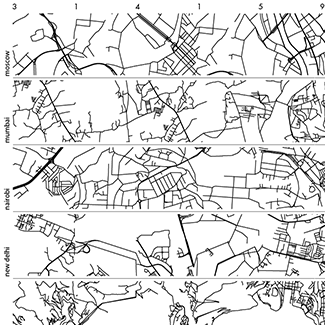
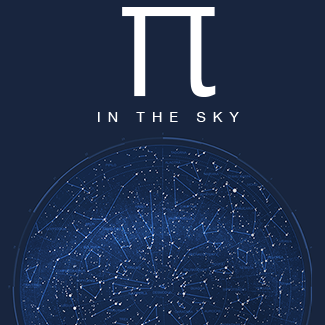
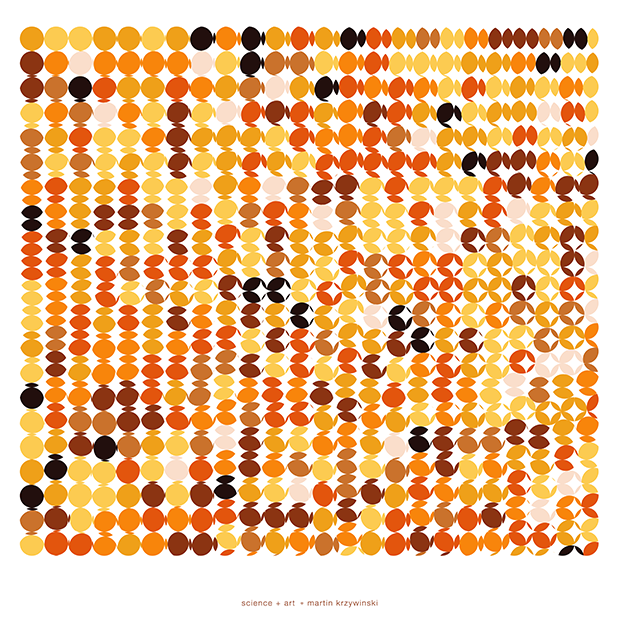
This section contains various art work based on `\pi`, `\phi` and `e` that I created over the years.
Some of the numerical art reveals interesting and unexpected observations. For example, the sequence 999999 in π at digit 762 called the Feynman Point. Or that if you calculate π to 13,099,586 digits you will find love.
`\pi` day art and `\pi` approximation day art is kept separate.

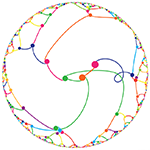
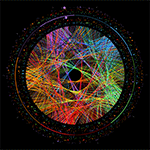
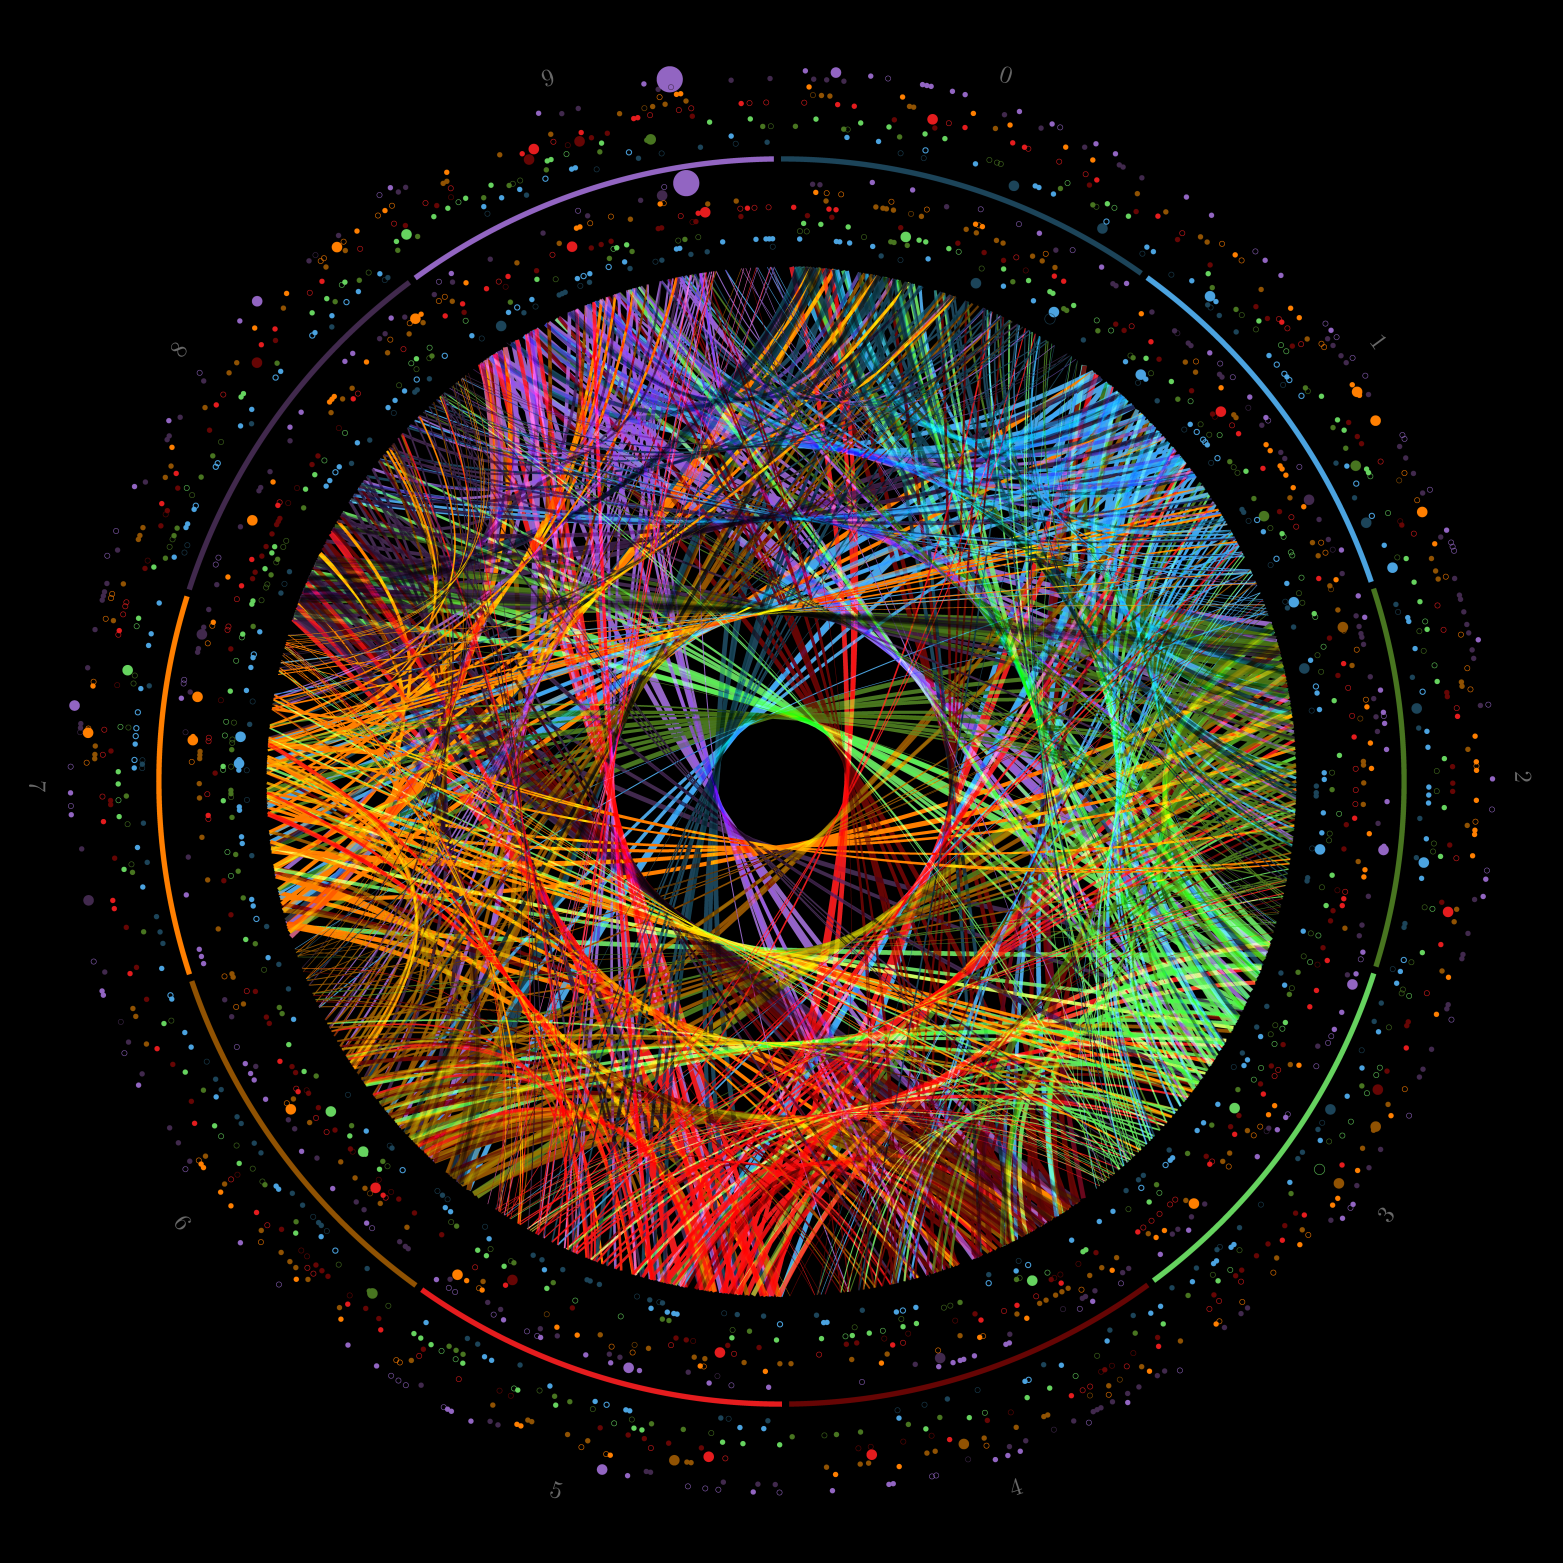
Cristian Ilies Vasile had the idea of representing the digits of `\pi` as a path traced by links between successive digits. Each digit is assigned a segment around the circle and a link between segment `i` and `j` corresponds to the appearance of `ij` in `\pi`. For example, the "14" in "3.14..." is drawn as a link between segment 1 and segment 4.
The position of the link on a digit's segment is associated with the position of the digit `\pi`. For example, the "14" link associated with the 2nd digit (1) and the 3rd digit (4) is drawn from position 2 on the 1 segment to position 3 on the 4 segment.
As more digits are added to the path, the image becomes a weaving mandala.
circos art of `\pi`, `\phi` and `e` — transition paths and bubbles
I added to Cristian's representation by showing the number of transitions between digits in a series of concentric circles placed outside the links. This summary representation counts the number of transition links within a region and addresses the question of what kind of digits appear immediately before or after a given digit in `\pi`. The approach is diagrammed below.
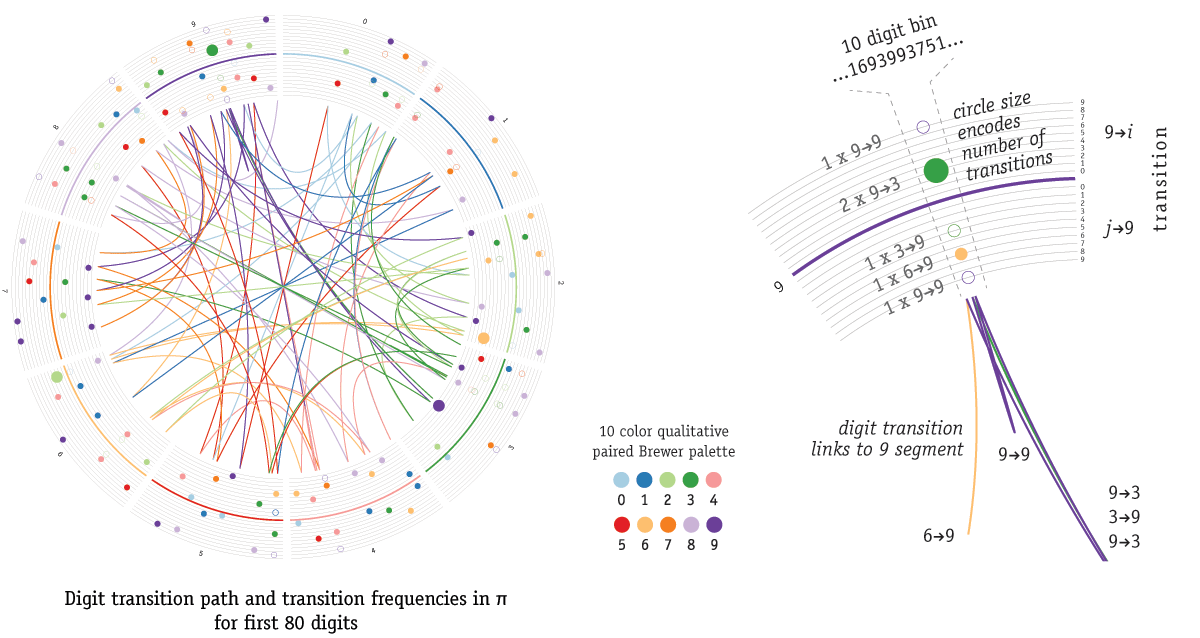
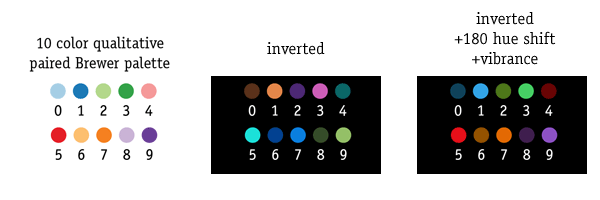
The original images were generated using the 10-color Brewer paired qualitative palette, which was later modified as shown below.
The bubbles that count the number of links quickly draw attention to regions where specific digit pairs are frequent. In the image for `\pi` below, which shows transitions for the first 1,000 digits, the large bubble on the 9 segment is due to the "999999" sequence at decimal place 762. This is the Feynman point, which I describe below.
 buy artwork
The image below shows how this representation of `\pi` compares to that of `\phi` and `e`.
 buy artwork
The transition probabilities for each 10 digit bin for the first 2,000 digits of `\pi`, `\phi` and `e` are shown in the image below.
 buy artwork
Feynman point
This sequence of 6 9's occurs significantly earlier than expected by chance. Because the distribution and sequence of digits of `\pi` is thought to be normal, we can calculate how frequently we should expect a series of 6 identical digits.
For a given digit, the chance that the next 5 digits are the same is 0.00001 (0.1 that the next digit is the same × 0.1 that the second-nex digit is the same × ...). Therefore the chance that a given position the next 5 digits are not the same is 1 - 1/0.00001 = 0.99999. From this, the chance that `k` consecutive digits don't initiate a 6-digit sequence is therefore 0.99999`k`.
If I ask what is `k` for which this value is 0.5, I need to solve 0.99999`k`, which gives `k` = 69,314. Thus, chances are even (50%) that in a 69,000 digit random sequence we'll see a run of 6 idendical digits. This calculation is an approximation.
It's fun to look for words in `\pi`. For example, love appears at 13,099,586th digit.
A tangent into randomness
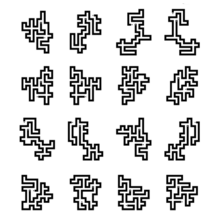
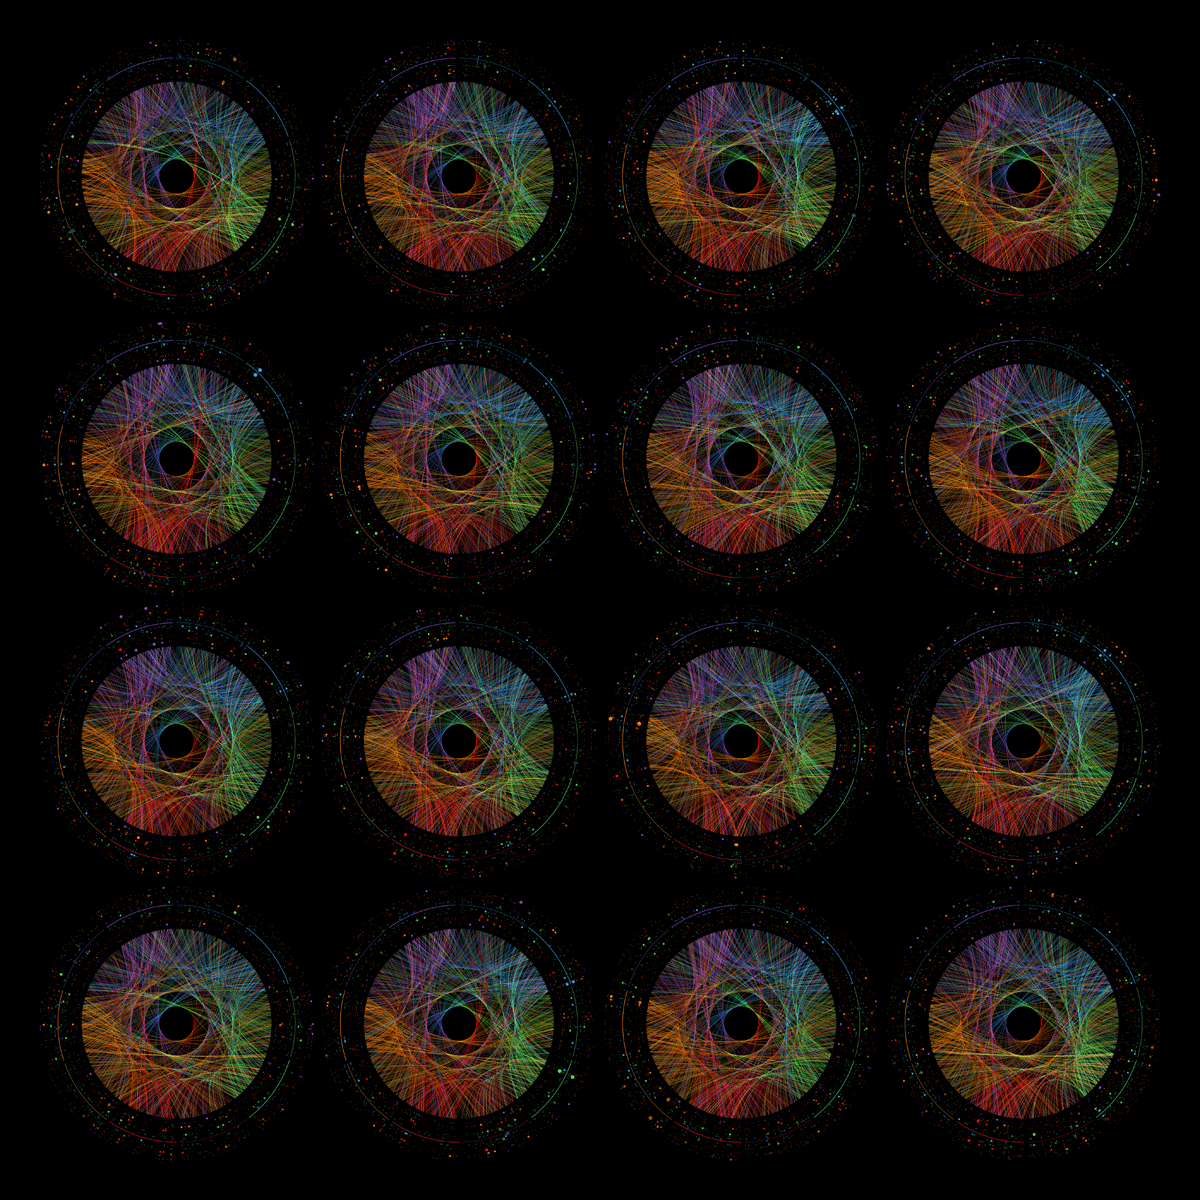
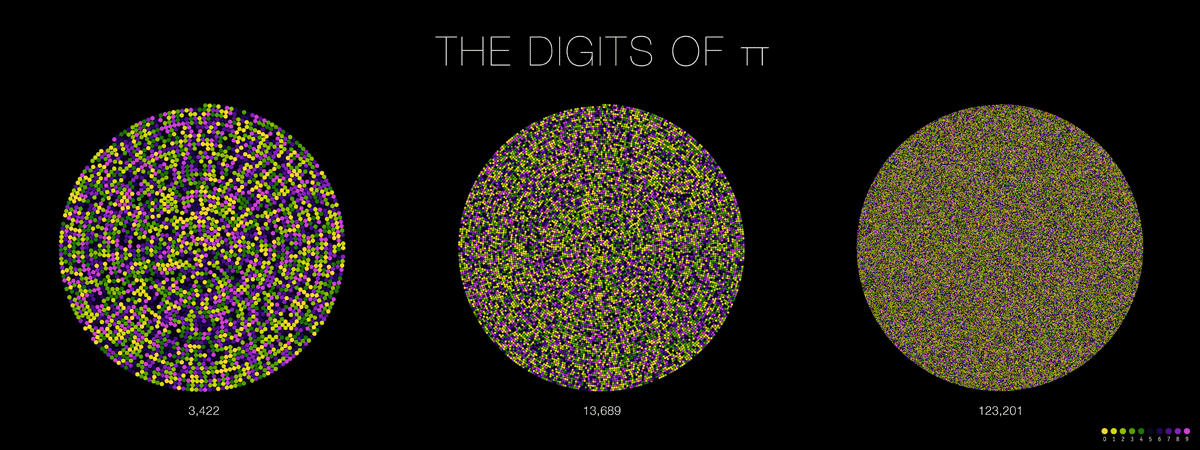
The digits of `\pi` are, as far as we know, randomly distributed. Art based on its digits therefore as a quality that is influenced by this random distribution. To provide a reference of what such a random pattern looks like, below are 16 random numbers represented in the same way. They're all different, yet strangely the same.
Circos art of `\pi`—heaps of bubbles
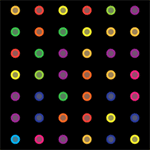
Below are more images by Cristian Ilies Vasile, where dots are used to represent the adjacency between digits. As in the image above, each digit 0-9 is represented by a colored segment. For each digit sequence `ij`, a dot is placed on the `i`th segment at the position of `i` colored by `j`.
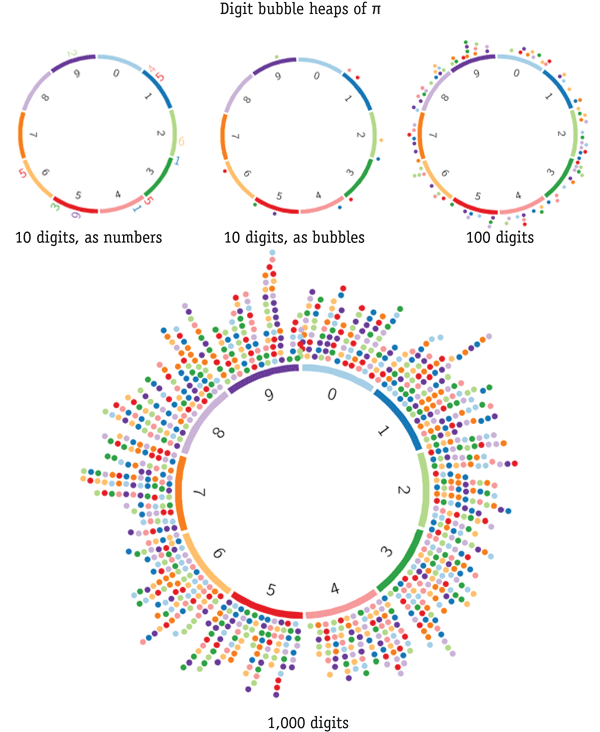
For example, for `\pi` the dot coordinates for the first 7 digits are (segment:position:label) 3:0:1 → 1:1:4 → 4:2:1 → 1:3:5 → 5:4:9 ...
segment position colored_by

3       0        1
1       1        4
4       2        1
1       3        5
5       4        9
9       5        2
2       6        6
Because there is a large number of digits, the dots stack up near their position to avoid overlapping. The layout of the dots is automated by Circos' text track layout.
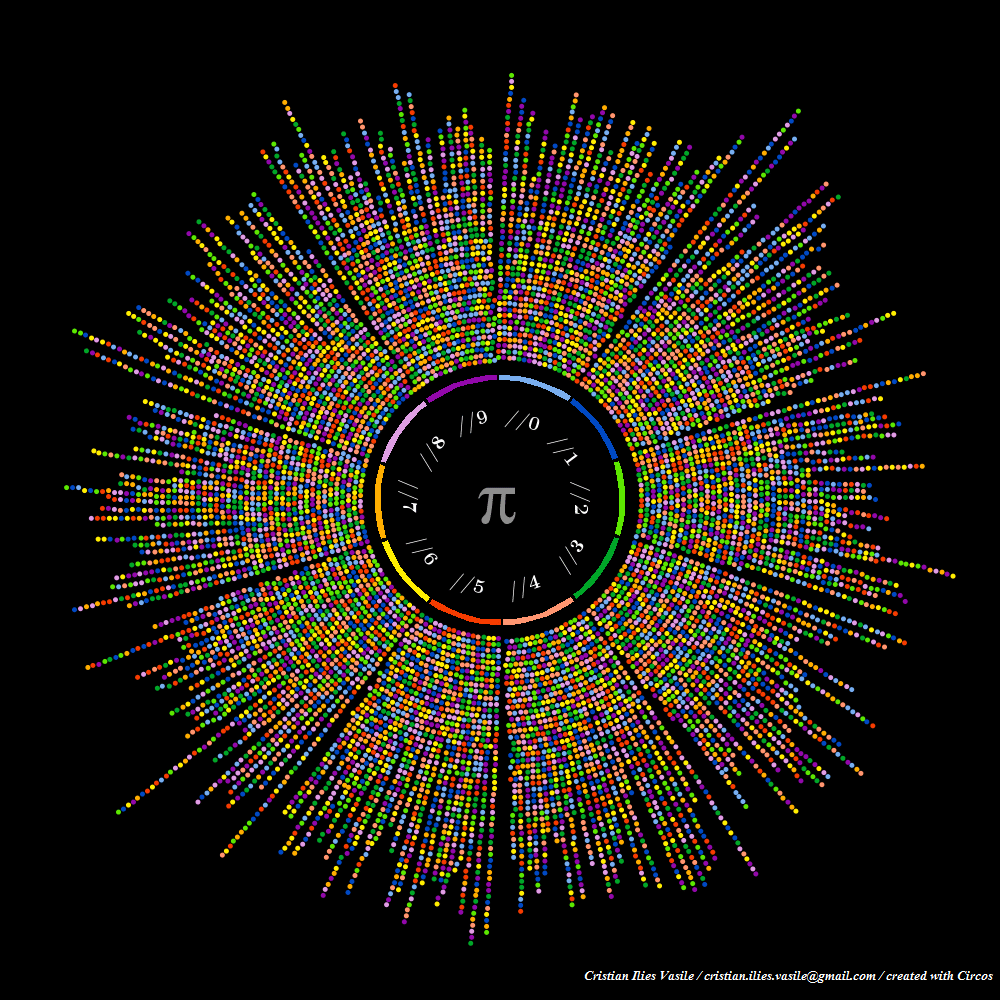 buy artwork
spiral art of `\pi`

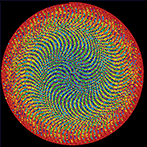
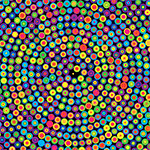
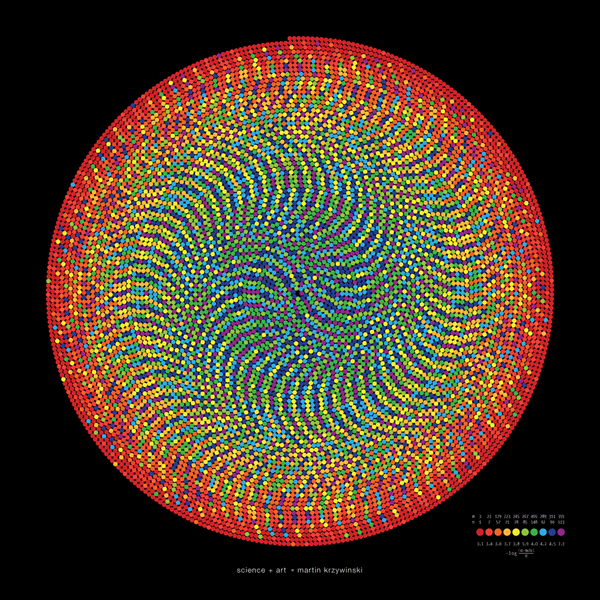
By mapping the digits onto a red-yellow-blue Brewer palette (0  9) and placing them as circles on an Archimedean spiral a dense and pleasant layout can be obtained.
Why the Archimedean spiral? This spiral is defined as `r = a + b \theta` and has the interesting property that a ray from the origin will intersect the spiral every `2 pi b`. Thus, each spiral can accomodate inscribed circles of radius `\pi b`.
Why the Brewer palette? These color schemes have some very useful perceptual properties and are commonly used to encode quantitative and categorical data.


I have use the Archimedean spiral to make art for `\pi` approximation day
 buy artwork
Beyond Belief Campaign BRCA Art
Fuelled by philanthropy, findings into the workings of BRCA1 and BRCA2 genes have led to groundbreaking research and lifesaving innovations to care for families facing cancer.
This set of 100 one-of-a-kind prints explore the structure of these genes. Each artwork is unique — if you put them all together, you get the full sequence of the BRCA1 and BRCA2 proteins.

Propensity score weighting
The needs of the many outweigh the needs of the few. —Mr. Spock (Star Trek II)
This month, we explore a related and powerful technique to address bias: propensity score weighting (PSW), which applies weights to each subject instead of matching (or discarding) them.
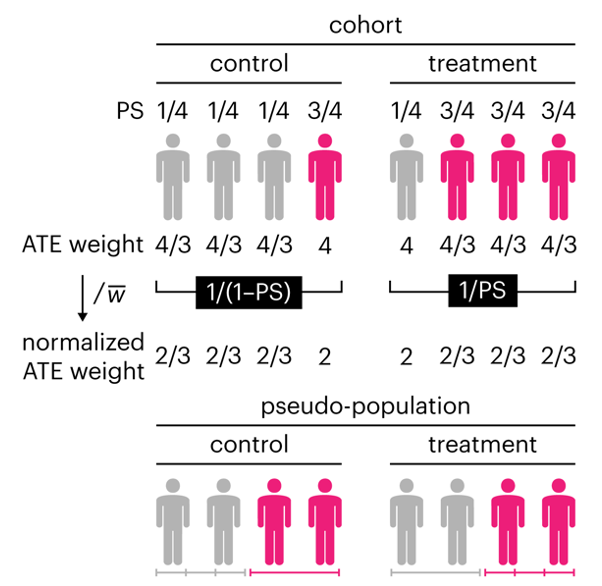
Kurz, C.F., Krzywinski, M. & Altman, N. (2025) Points of significance: Propensity score weighting. Nat. Methods 22:1–3.
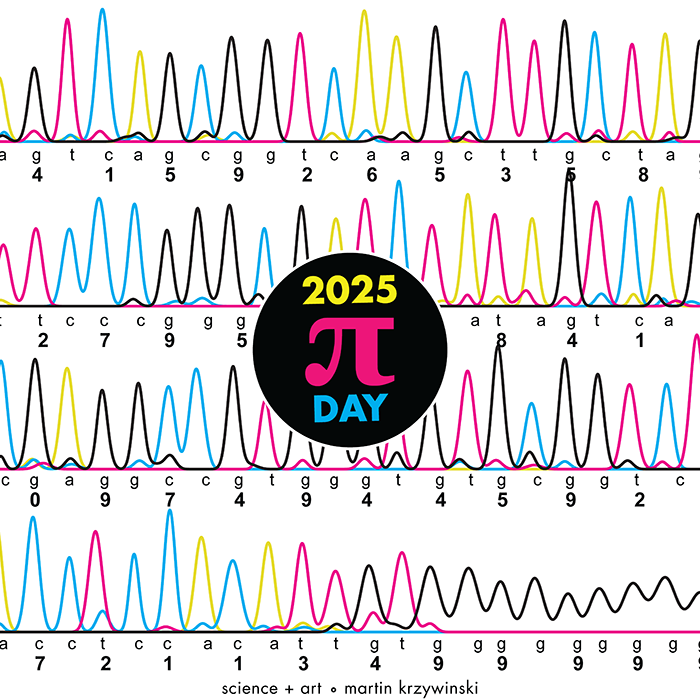
Happy 2025 π Day—
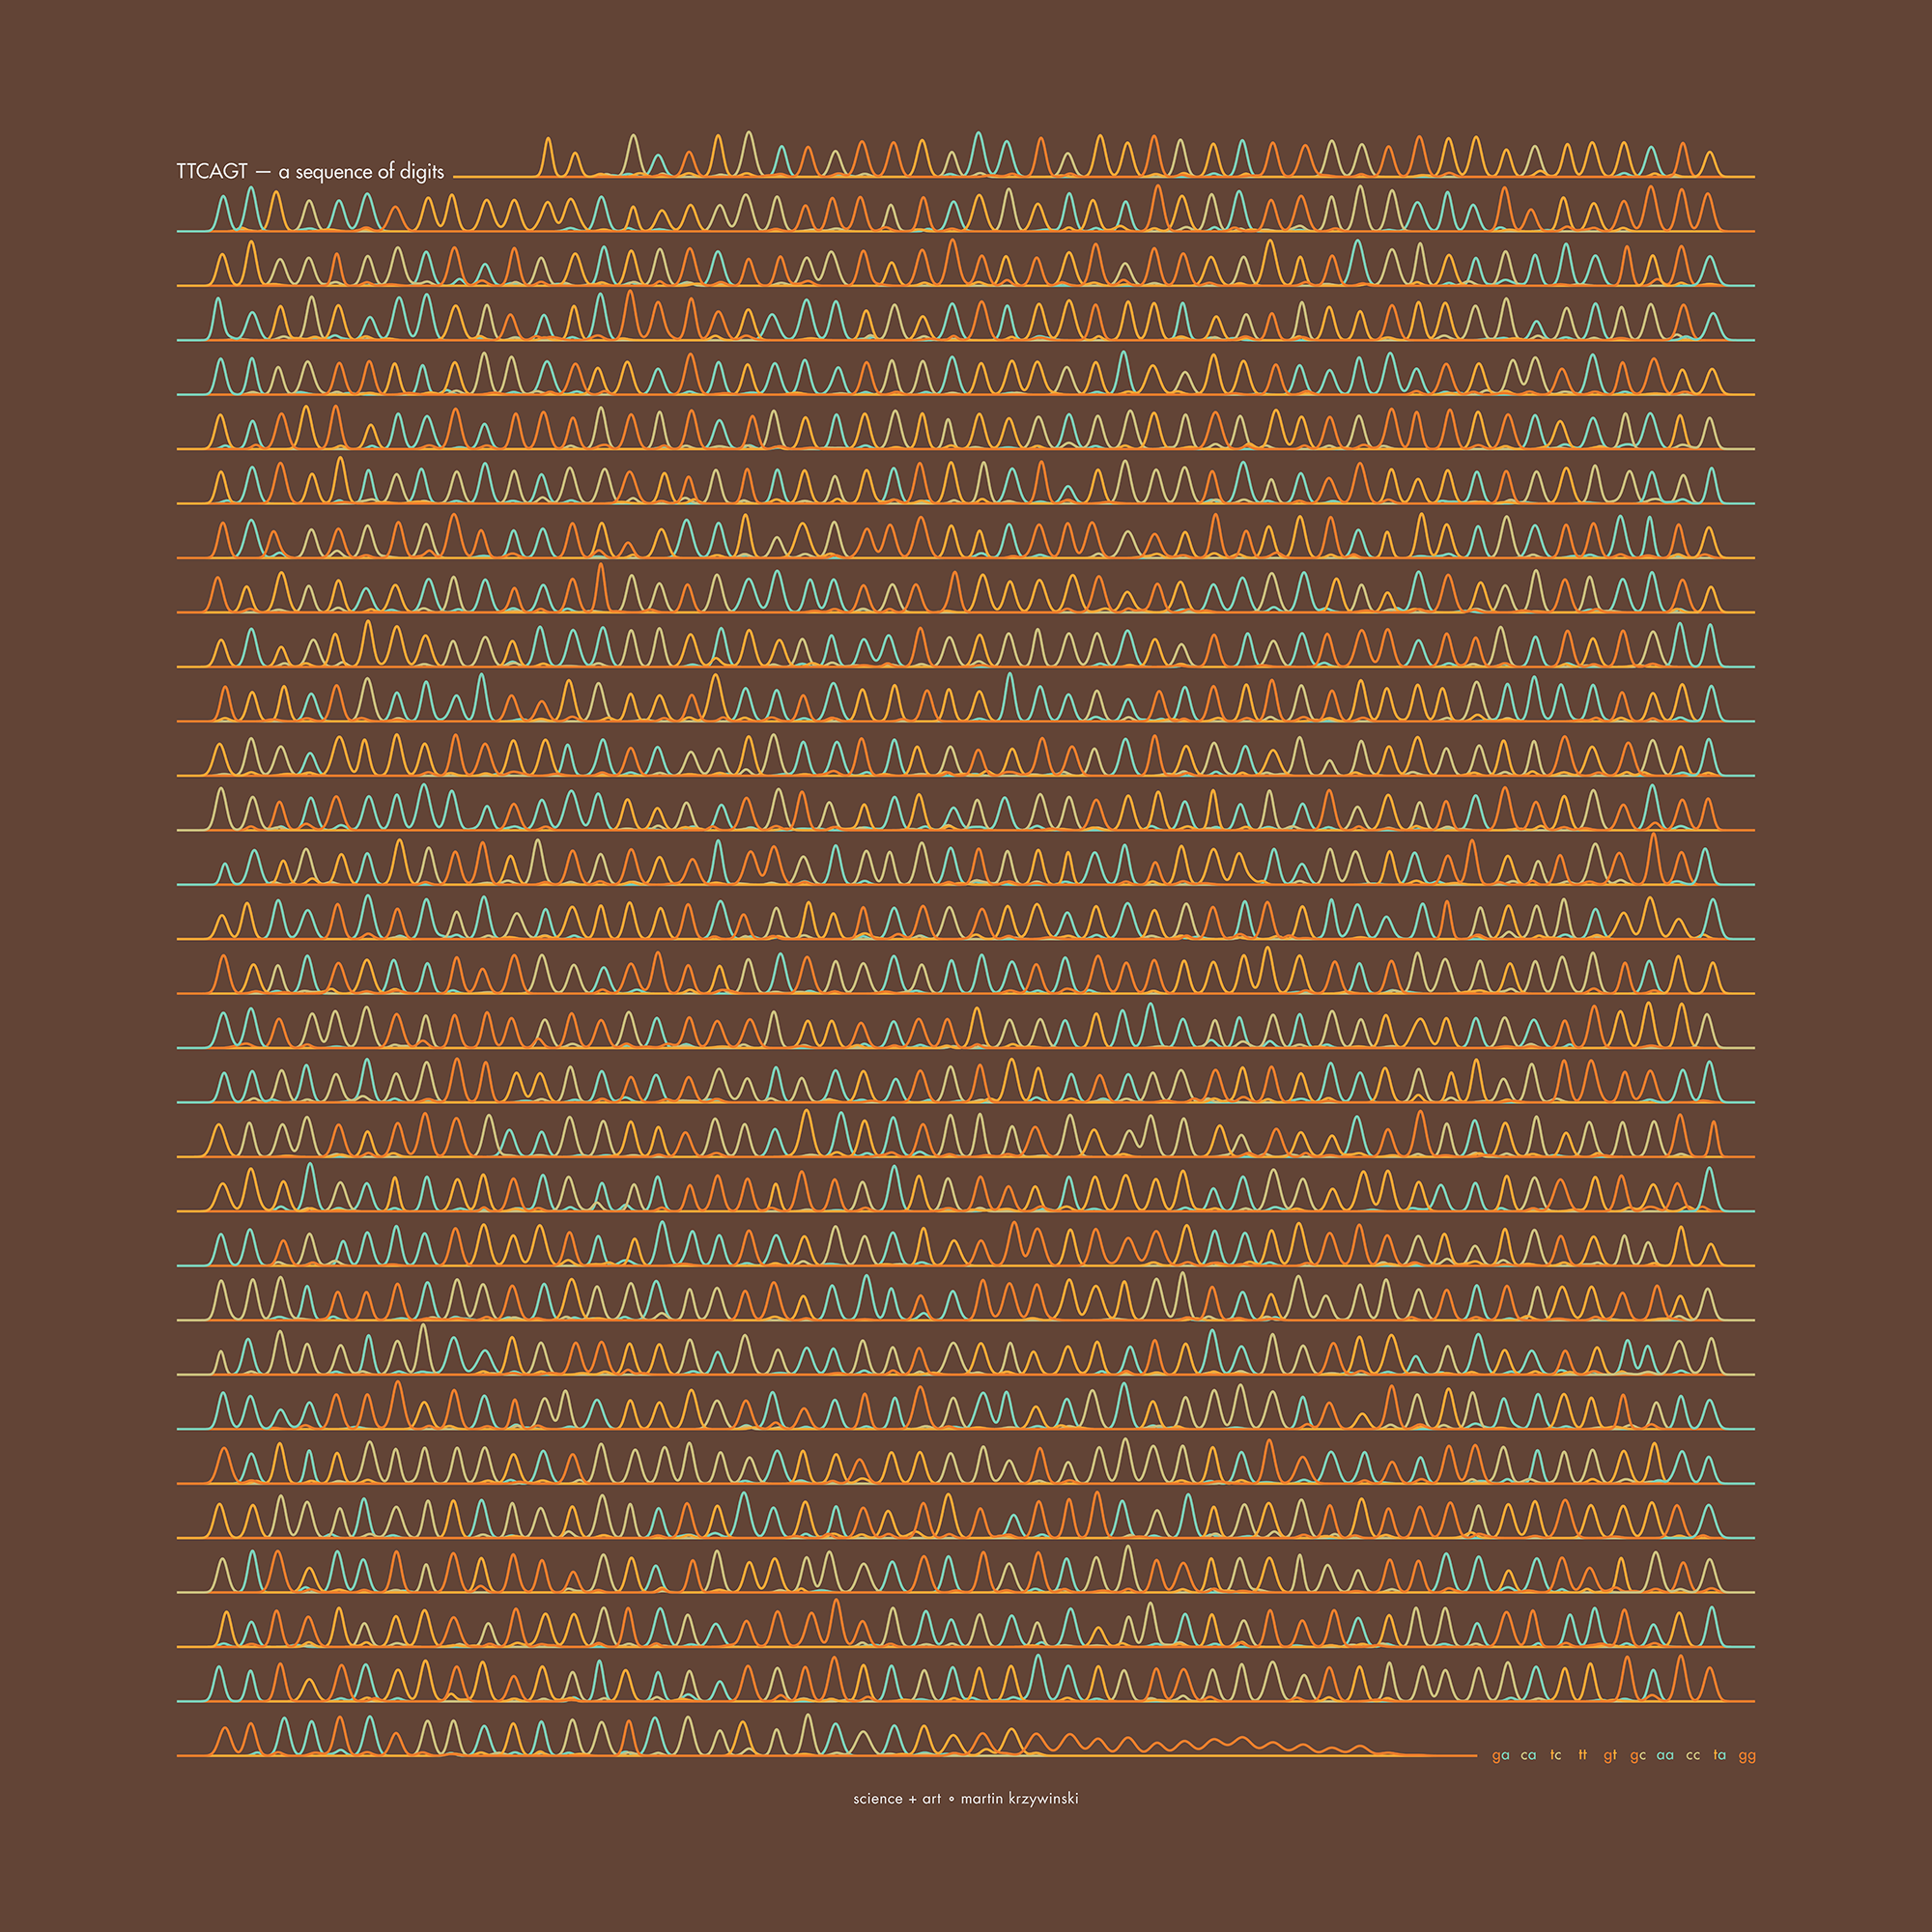
TTCAGT: a sequence of digits
Celebrate π Day (March 14th) and sequence digits like its 1999. Let's call some peaks.
Crafting 10 Years of Statistics Explanations: Points of Significance
I don’t have good luck in the match points. —Rafael Nadal, Spanish tennis player
Points of Significance is an ongoing series of short articles about statistics in Nature Methods that started in 2013. Its aim is to provide clear explanations of essential concepts in statistics for a nonspecialist audience. The articles favor heuristic explanations and make extensive use of simulated examples and graphical explanations, while maintaining mathematical rigor.
Topics range from basic, but often misunderstood, such as uncertainty and P-values, to relatively advanced, but often neglected, such as the error-in-variables problem and the curse of dimensionality. More recent articles have focused on timely topics such as modeling of epidemics, machine learning, and neural networks.
In this article, we discuss the evolution of topics and details behind some of the story arcs, our approach to crafting statistical explanations and narratives, and our use of figures and numerical simulations as props for building understanding.
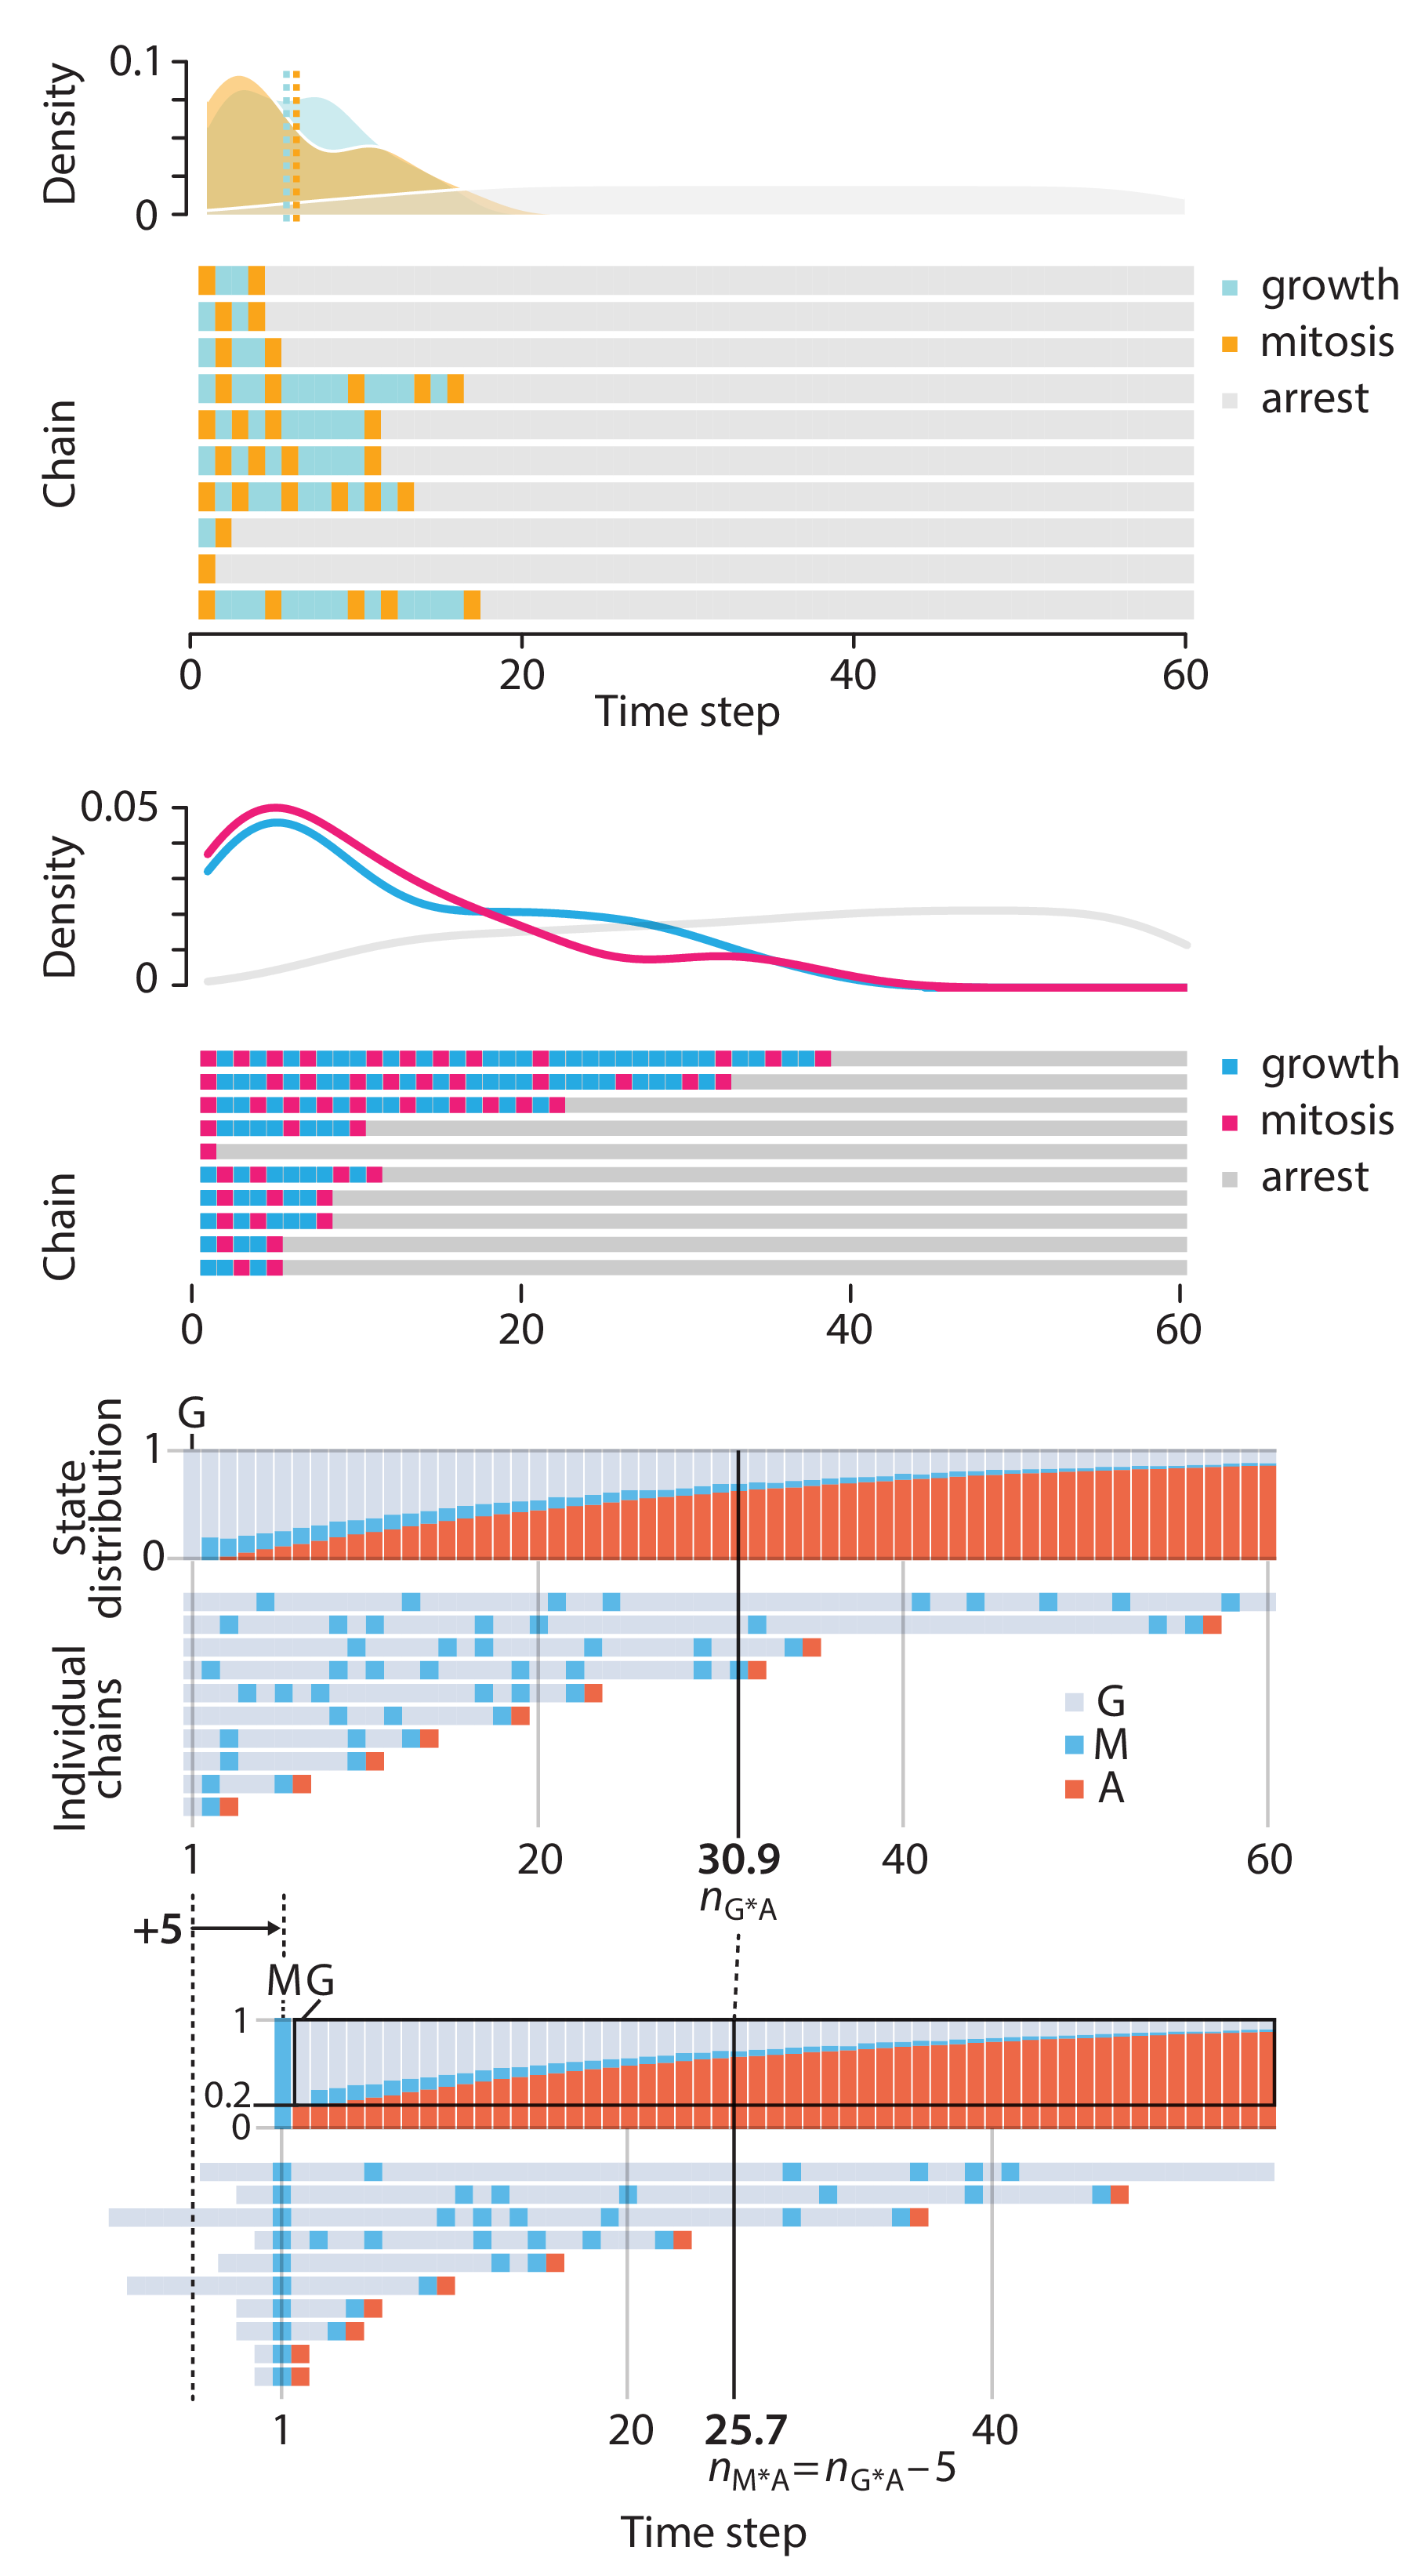
Altman, N. & Krzywinski, M. (2025) Crafting 10 Years of Statistics Explanations: Points of Significance. Annual Review of Statistics and Its Application 12:69–87.
Propensity score matching
I don’t have good luck in the match points. —Rafael Nadal, Spanish tennis player
In many experimental designs, we need to keep in mind the possibility of confounding variables, which may give rise to bias in the estimate of the treatment effect.
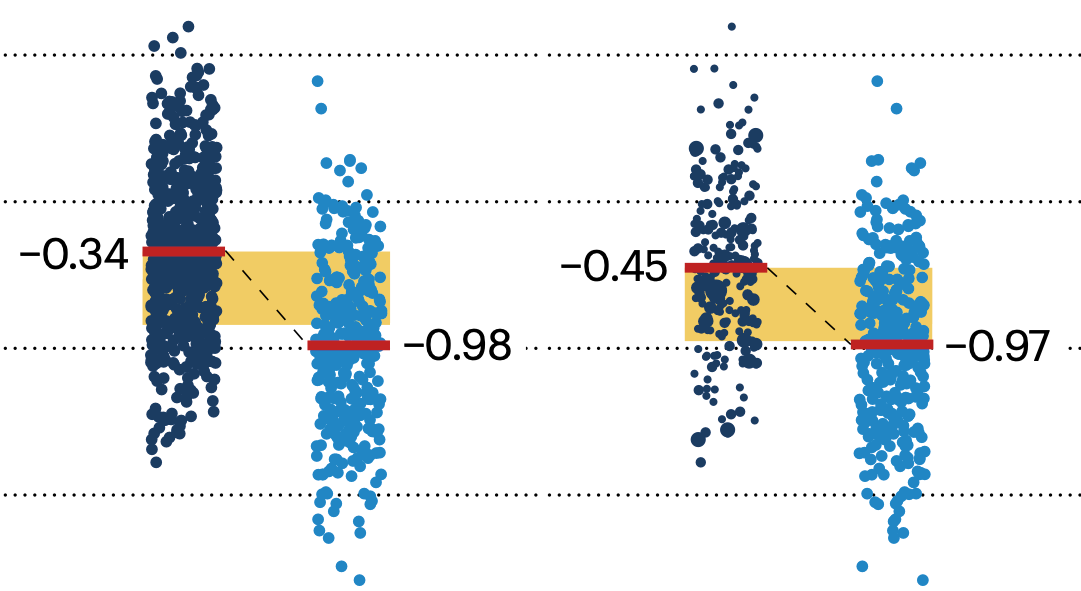
If the control and experimental groups aren't matched (or, roughly, similar enough), this bias can arise.
Sometimes this can be dealt with by randomizing, which on average can balance this effect out. When randomization is not possible, propensity score matching is an excellent strategy to match control and experimental groups.
Kurz, C.F., Krzywinski, M. & Altman, N. (2024) Points of significance: Propensity score matching. Nat. Methods 21:1770–1772.
Understanding p-values and significance
P-values combined with estimates of effect size are used to assess the importance of experimental results. However, their interpretation can be invalidated by selection bias when testing multiple hypotheses, fitting multiple models or even informally selecting results that seem interesting after observing the data.
We offer an introduction to principled uses of p-values (targeted at the non-specialist) and identify questionable practices to be avoided.
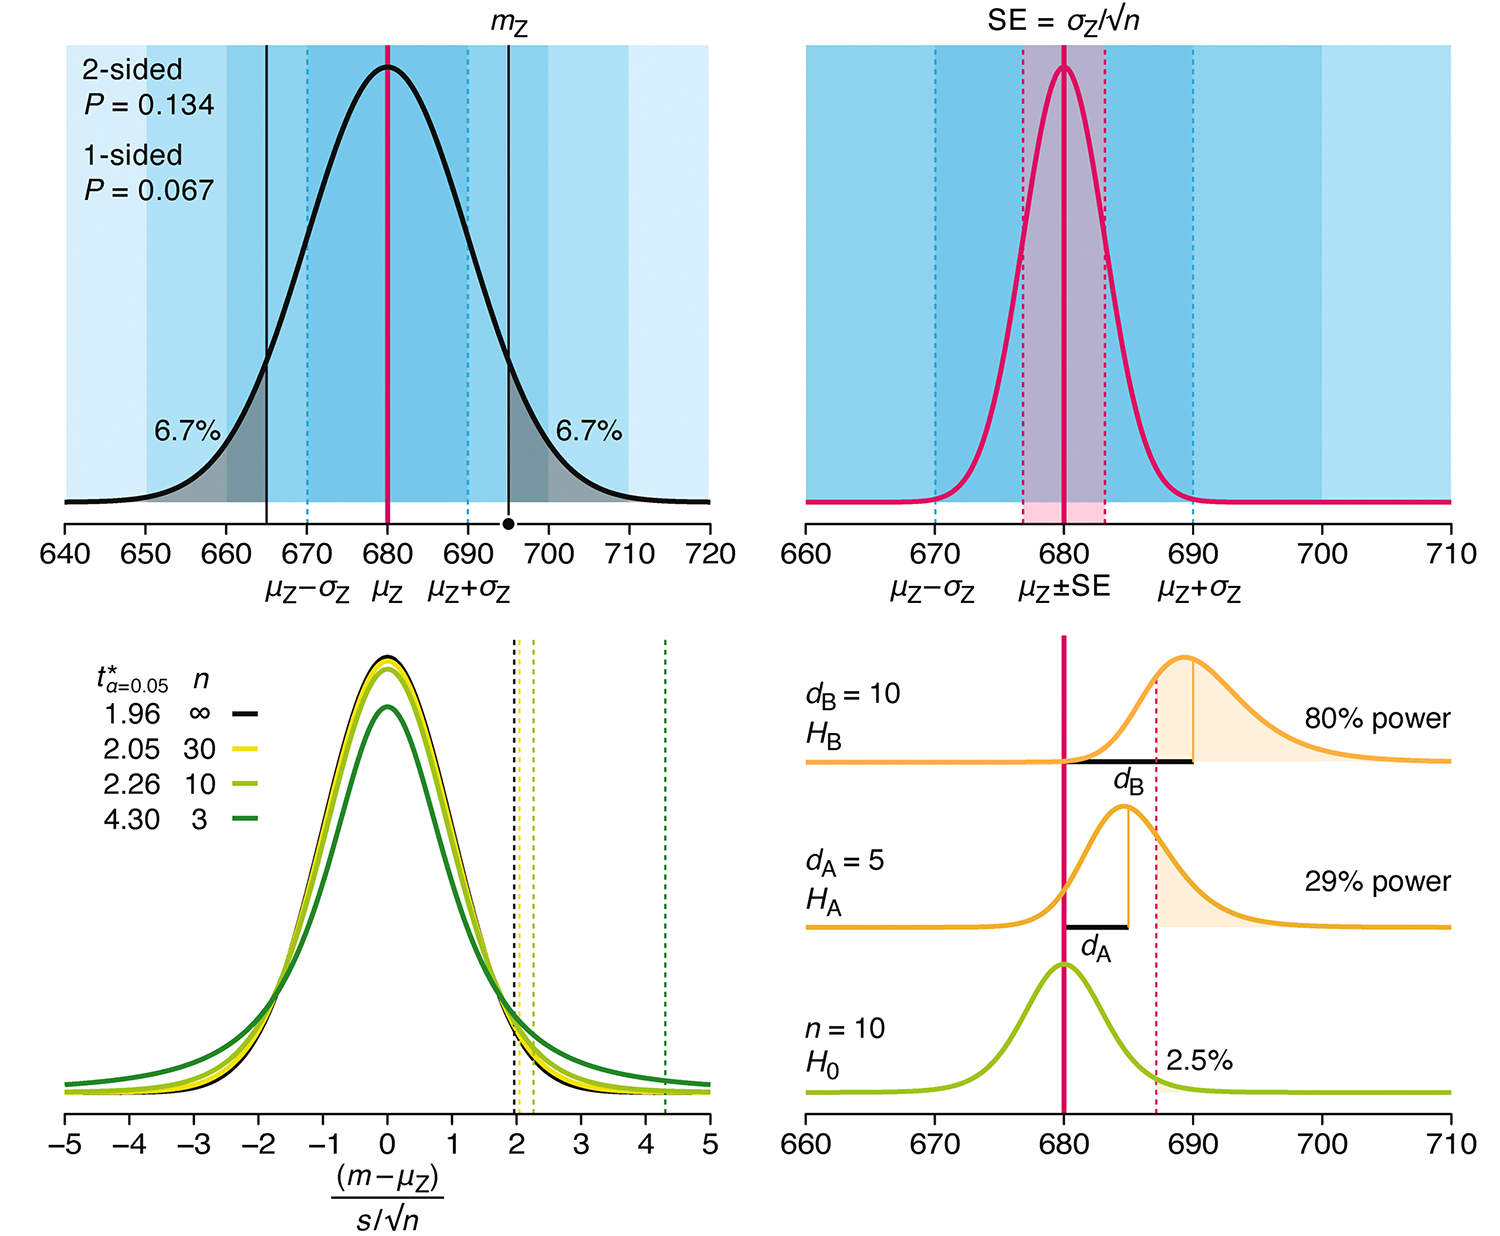
Altman, N. & Krzywinski, M. (2024) Understanding p-values and significance. Laboratory Animals 58:443–446.