null
from an undefined
place,
undefined
create (a place)
an account
of us
— Viorica Hrincu
Sometimes when you stare at the void, the void sends you a poem.
Universe—Superclusters and Voids

The average density of the universe is about `10 \times 10^{-30} \text{ g/cm}^3` or about 6 protons per cubic meter. This should put some perspective in what we mean when we speak about voids as "underdense regions".
poster of supercluster and voids in the universe
contents
- 1 · The ultimate rabbit hole
- 2 · Vast somethingness and nothingness
- 3 · Poem on the poster
- 4 · Stories on the poster
- 4.1 · The constellations and the equators
- 4.2 · Oh my God, it's full of stars
- 4.3 · Finding your way — the coordinate systems
- 4.4 · Reading the map
- 4.5 · Further than you think
- 4.6 · The cosmic yardstick
- 4.7 · The long goodbye
- 4.8 · Nothing out of nothing — voids and supervoids
- 4.9 · River in the sky — Eridanus Supervoid
- 4.10 · Far Out — J1342+0928
- 4.11 · Poster legend
It started as a two-hour project: generate a small map of superclusters for the space disc of the Sanctuary project. The plan was simplel and brief: trace this map of superclusters within 2 billion light-years and be done with it.
But nobody strapped me to the mast of my boat—the Siren call of the rabbit hole proved too appealing.
I mean... why settle for a copy of someone else's map to within (only) 2 billion light-years when you can trawl the VizieR astronomical databases and get thousands of objects out to 6 billion light-years? And by doing so, swear and fret about how to interpret these data, read about celestial coordinate systems, implement your own primitive 3D engine and write stories about the farthest reaches.
 buy artwork
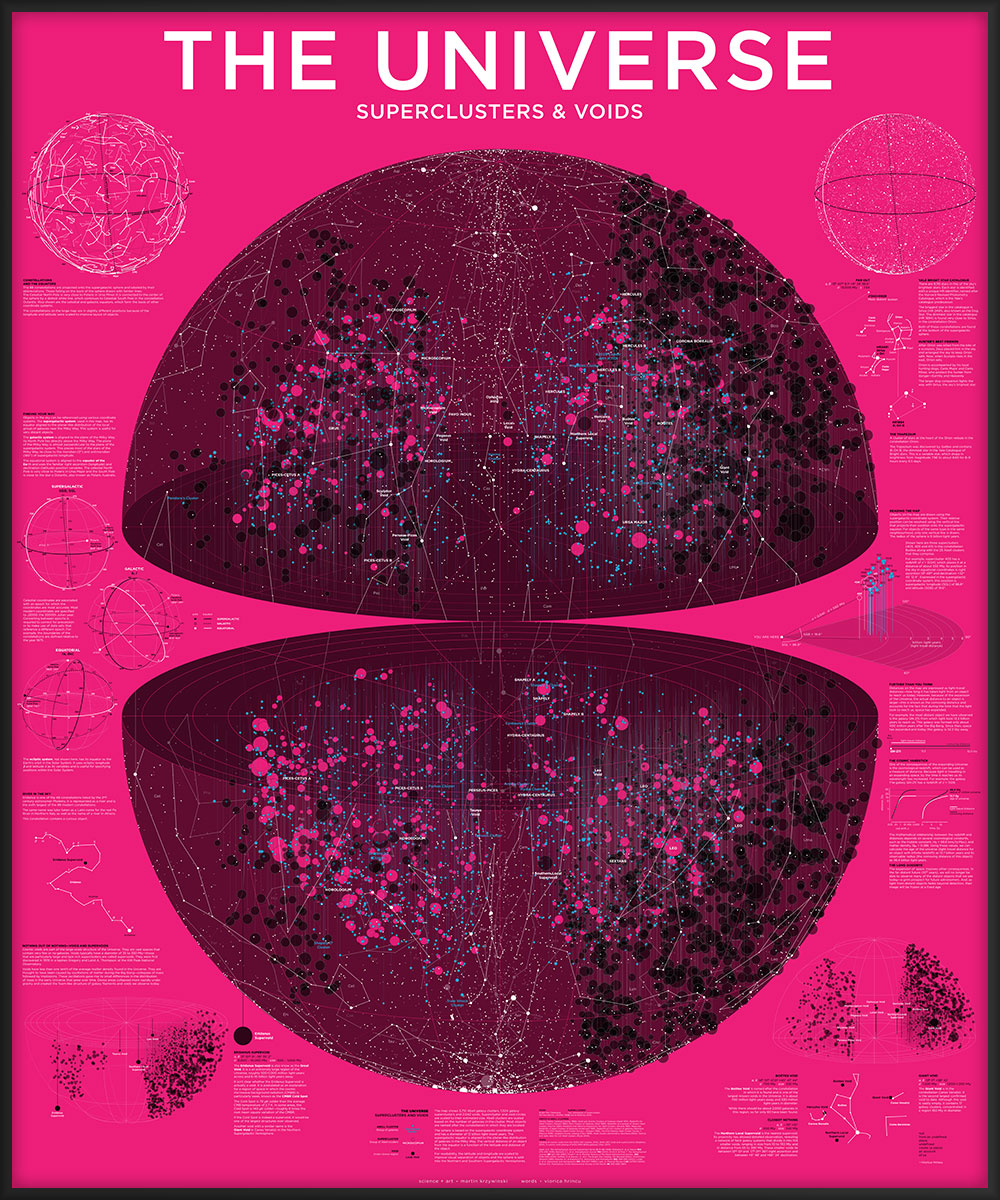
This map of the Universe shows 3,751 Abell galaxy clusters (blue), 1,024 galaxy superclusters (magenta) and 2,042 voids (black). Objects are drawn using the supergalactic coordinate system within a sphere that is 12,000 million light-years in diameter.
Around the poster are various stories about constellations, stars, sky mythology, coordinate systems and, of course, voids.

This poster is an artistic collaboration with Viorica Hrincu, a brilliantly talented poet.


The 88 constellations are projected onto the supergalactic sphere and labeled by their abbreviations. Those falling on the back of the sphere drawn with fainter lines.
The Celestial North Pole is very close to Polaris in Ursa Minor. It is connected to the center of the sphere by a dotted white line, which continues to Celestial South Pole in the constellation Octantis.
Also shown are the galactic and celestial galactic equators, which form the basis of other coordinate systems.
The lines of supergalactic longitude and latitude in this map are scaled to expand the scale at smaller supergalatic latitudes. The scale is also compressed for longitudes near the galatic equator, where observations are obscured by the stars in the Milky Way.
See my IAU Constellation Resources for more details.

The 9,096 stars in the Yale Catalogue of Bright Stars. Each star in the catalogue is assigned a unique HR designation. The HR prefix is named after the Harvard Revised Photometry Catalogue, which is the Yale’s catalogue predecessor.
The briggest star in the catalogue is Sirius (HR 2491), also known as the Dog Star. The dimmest star in the catalogue (HR 1894) is found very close to Sirius, in the constellation Orion.
Both of these constellations are found at the bottom of the supergalactic sphere.
After Orion was killed from the bite of a scorpion, Zeus placed him in the sky and arranged the sky to keep Orion safe. Now, when Scorpio rises in the east, Orion sets.
Orion is accompanied by his loyal hunting dogs, Canis Major and Canis Minor, who protect the hunter from danger—Earthly and Heavenly. The larger dog companion lights the way with Sirius, the sky’s brighest star.
A cluster of stars at the heart of the Orion nebula in the constellation Orion.
The Trapezium was discovered by Galileo and contains θ1 Ori B, the dimmest star in the Yale Catalogue of Bright stars. This is a variable star, which drops in brightness from magnitude 7.96 to about 8.65 for 8–9 hours every 6.5 days.

Objects in the sky can be referenced using various coordinate systems. The supergalactic system, used in this map, has its equator aligned to the planar-like distribution of the local group of galaxies near the Milky Way. This system is useful for very distant objects.
The galactic system is aligned to the plane of the Milky Way. Its North Pole lies directly above the Milky Way. The plane of the MIlky Way is almost perpendicular to the plane of the supergalactic system. This places most of the stars of the Milky Way lie close to the meridian (0°) and antimeridian (180°) of supergalactic longitude.
The equatorial system is aligned to the equator of the Earth and uses the familiar right ascension (longitude) and declination (latitude) position variables. The celestial North Pole is very close to Polaris in Ursa Major and the South Pole is close to the star σ Octantis, also known as Polaris Australis.
Celestial coordinates are associated with an epoch for which the coordinates are most accurate. Most modern coordinates are specified to J2000, the 2000th Julian year. Converting between epochs is required to correct for precession or to make use of data sets that reference a different epoch. For example, the boundaries of the constellations are defined relative to the year 1875.
The ecliptic system, not shown here, has its equator as the Earth’s orbit in the Solar System. It uses ecliptic longitude β and latitude λ as its variables and is useful for specifying positions within the Solar System.

Objects on the map are drawn using the supergalactic coordinate system. Their relative position can be resolved using the vertical line that projects their position onto the supergalactic equator. For objects of the same type in the same neighbourhood, only one vertical line is drawn. The radius of the sphere is 6 billion light-years.
Shown here are three superclusters (403, 409 and 411) in the constellation Boötes along with the 25 Abell clusters that they comprise.
For example, supercluster 403 has a redshift of z = 0.041, which places it at a distance of about 550 Mly. Its position in the sky in equatorial coordinates is right ascension 13h 49m and declination +32° 40’ 12.4”. Expressed in the supergalactic coordinate system, this position is supergalactic longitude (SGL) of 86.8° and latitude (SGB) of 19.6°.
Distances on the map are expressed as light-travel distances—how long it has taken light from an object to reach us today. However, because of the expansion of the Universe, the actual distance to an object is larger—this is known as the comoving distance and accounts for the fact that during the time that the light took to reach us, space has expanded.
For example, the most distant object we have observed is the galaxy GN-Z11, from which light took 13.3 billion years to reach us. This galaxy was formed only about 400 million years after the Big Bang. Since then, space has expanded and today this galaxy is 32.2 Gly away.

One of the consequences of the expanding Universe is the cosmological redshift, which can be used as a measure of distance. Because light is travelling in an expanding space, by the time it reaches us its wavelength has increased. For example, the galaxy The galaxy GN-Z11 has a redshift of `z` = 11.09.
The mathematical relationship between the redshift and distances depends on several cosmological constants, such as the Hubble constant, `H_0` = 68.6 kms/(s·Mpc), and matter density, `\Omega_M = 0.286`. Using these values, we can calculate the age of the universe (light-travel distance for an object with infinite redshift) as 13.7 billion years and its observable radius (the comoving distance of this object) as 46.4 billion light-years.
The expansion of space imposes other consequences. In the far-distant future (`10^{11}` years), we will no longer be able to observe many of the distant objects that we see today—a grim prospect for future astronomers. And, as light from distant objects fades beyond detection, their image will be frozen at a fixed age.
Cosmic voids are part of the large-scale structure of the Universe. They are vast spaces that contain very few or no galaxies. Voids typically have a diameter of 35 to 350 Mly—those that are particularly large and lack rich superclusters are called supervoids. They were first discovered in 1978 in a tephen Gregory and Laird A. Thompson at the Kitt Peak National Observatory.
Voids have less than one tenth of the average matter density found in the Universe. They are thought to have been caused by oscillations of matter during the Big Bang—collapses of mass followed by implosions. These oscillations gave rise to small differences in the distribution of mass in the early Universe that grew over time. Dense areas collapsed more rapidly under gravity and created the foam-like structure of galaxy filaments and voids we observe today.

The Boötes Void is named after the constellation in which it is found and is one of the largest-known voids in the Universe. It is about 700 million light-years away and 330 million light-years in diameter. While there should be about 2,000 galaxies in this region, so far only 60 have been found.
The Northern Local Supervoid is the closest supervoid to us. Its proximity has allowed detailed observation, revealing a network of faint galaxy systems that divide it into 103 smaller voids, ranging in size from 10 to 130 Mly and in distance from 55 to 390 Mly. These smaller voids lie between 12h 12m 12s and 17h 21m 36s) right ascension and between +5° 48’ and +66° 24’ declination.
The Giant Void is in the constellation Canes Venatici. It is the second largest confirmed void to date. Although this void is vastly empty, it contains 17 galaxy clusters, concentrated in a region 160 Mly in diameter.
Eridanus is one of the 48 constellations listed by the 2nd century astronomer Ptolemy. It is represented as a river and is the sixth largest of the 88 modern constellations. The same name was later taken as a Latin name for the real Po River in Northern Italy as well as the name of a river in Athens.
This constellation contains a curious object.

The Eridanus Supervoid is also know as the Great Void, not to be confused with the Giant Void in Canes Venatici in the Northern hemisphere.
This supervoid is a an extremely large region of the Universe, roughly 500–1,000 million light-years across and 6–10 billion light-years away.
The Eridanus Supervoid hasn’t been observed directly as a void—it is postulated as an explanation for a region of space in which the cosmic microwave background radiation (CMBR) is particularly weak, known as the CMBR Cold Spot.
The Cold Spot is 70 μK colder than the average CMB temperature of 2.7 K. In some areas, the cold spot is 140 μK colder—roughly 8 times the root mean square variation of the CMBR. If the Cold Spot is indeed a supervoid, it would be one of the largest structures ever observed.

The quasar J1342+0928 is the most distant quasar, far outside the map’s sphere. Currently, the furthest observed object is the galaxy GN-Z11, which is 13.4 billion light-years away.

The map shows 3,751 Abell galaxy clusters, 1,024 galaxy superclusters and 2,042 voids. Supercluster and void circles are scaled to their estimated size. Abell clusters are scaled based on the number of galaxies in the cluster. Most objects are named after the constellation in which they are located. The sphere is based on the supergalactic coordinate system and has a diameter of 12 billion light-travel years. The supergalactic equator is aligned to the planar-like distribution of galaxies in the Milky Way. The vertical distance of an object from the equator is a function of the latitude and distance of the object. For readability, the latitude and longitude are scaled to improve visual separation of objects and the sphere is split into the Northern and Southern Supergalactic Hemispheres.
Propensity score matching
I don’t have good luck in the match points. —Rafael Nadal, Spanish tennis player
In many experimental designs, we need to keep in mind the possibility of confounding variables, which may give rise to bias in the estimate of the treatment effect.

If the control and experimental groups aren't matched (or, roughly, similar enough), this bias can arise.
Sometimes this can be dealt with by randomizing, which on average can balance this effect out. When randomization is not possible, propensity score matching is an excellent strategy to match control and experimental groups.
Kurz, C.F., Krzywinski, M. & Altman, N. (2024) Points of significance: Propensity score matching. Nat. Methods 21:1770–1772.
Nasa to send our human genome discs to the Moon
We'd like to say a ‘cosmic hello’: mathematics, culture, palaeontology, art and science, and ... human genomes.


Comparing classifier performance with baselines
All animals are equal, but some animals are more equal than others. —George Orwell
This month, we will illustrate the importance of establishing a baseline performance level.
Baselines are typically generated independently for each dataset using very simple models. Their role is to set the minimum level of acceptable performance and help with comparing relative improvements in performance of other models.

Unfortunately, baselines are often overlooked and, in the presence of a class imbalance, must be established with care.
Megahed, F.M, Chen, Y-J., Jones-Farmer, A., Rigdon, S.E., Krzywinski, M. & Altman, N. (2024) Points of significance: Comparing classifier performance with baselines. Nat. Methods 21:546–548.
Happy 2024 π Day—
sunflowers ho!
Celebrate π Day (March 14th) and dig into the digit garden. Let's grow something.

How Analyzing Cosmic Nothing Might Explain Everything
Huge empty areas of the universe called voids could help solve the greatest mysteries in the cosmos.
My graphic accompanying How Analyzing Cosmic Nothing Might Explain Everything in the January 2024 issue of Scientific American depicts the entire Universe in a two-page spread — full of nothing.
The graphic uses the latest data from SDSS 12 and is an update to my Superclusters and Voids poster.
Michael Lemonick (editor) explains on the graphic:
“Regions of relatively empty space called cosmic voids are everywhere in the universe, and scientists believe studying their size, shape and spread across the cosmos could help them understand dark matter, dark energy and other big mysteries.
To use voids in this way, astronomers must map these regions in detail—a project that is just beginning.
Shown here are voids discovered by the Sloan Digital Sky Survey (SDSS), along with a selection of 16 previously named voids. Scientists expect voids to be evenly distributed throughout space—the lack of voids in some regions on the globe simply reflects SDSS’s sky coverage.”
voids
Sofia Contarini, Alice Pisani, Nico Hamaus, Federico Marulli Lauro Moscardini & Marco Baldi (2023) Cosmological Constraints from the BOSS DR12 Void Size Function Astrophysical Journal 953:46.
Nico Hamaus, Alice Pisani, Jin-Ah Choi, Guilhem Lavaux, Benjamin D. Wandelt & Jochen Weller (2020) Journal of Cosmology and Astroparticle Physics 2020:023.
Sloan Digital Sky Survey Data Release 12
Alan MacRobert (Sky & Telescope), Paulina Rowicka/Martin Krzywinski (revisions & Microscopium)
Hoffleit & Warren Jr. (1991) The Bright Star Catalog, 5th Revised Edition (Preliminary Version).
H0 = 67.4 km/(Mpc·s), Ωm = 0.315, Ωv = 0.685. Planck collaboration Planck 2018 results. VI. Cosmological parameters (2018).
constellation figures
stars
cosmology
Error in predictor variables
It is the mark of an educated mind to rest satisfied with the degree of precision that the nature of the subject admits and not to seek exactness where only an approximation is possible. —Aristotle
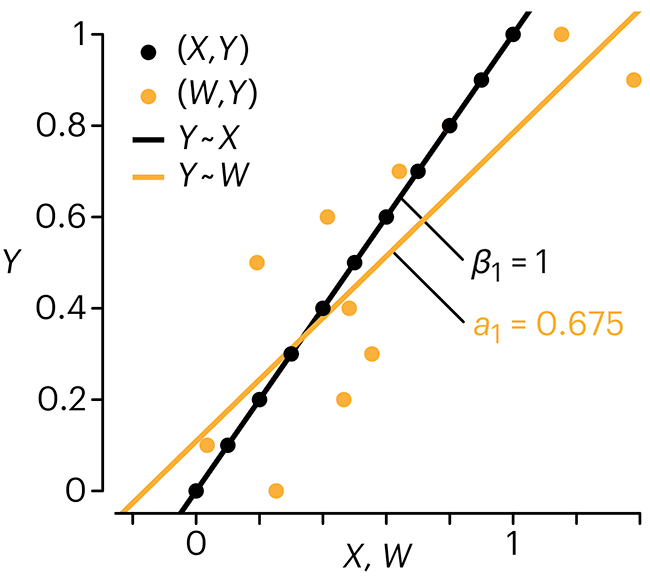
In regression, the predictors are (typically) assumed to have known values that are measured without error.
Practically, however, predictors are often measured with error. This has a profound (but predictable) effect on the estimates of relationships among variables – the so-called “error in variables” problem.

Error in measuring the predictors is often ignored. In this column, we discuss when ignoring this error is harmless and when it can lead to large bias that can leads us to miss important effects.
Altman, N. & Krzywinski, M. (2024) Points of significance: Error in predictor variables. Nat. Methods 21:4–6.
Background reading
Altman, N. & Krzywinski, M. (2015) Points of significance: Simple linear regression. Nat. Methods 12:999–1000.
Lever, J., Krzywinski, M. & Altman, N. (2016) Points of significance: Logistic regression. Nat. Methods 13:541–542 (2016).
Das, K., Krzywinski, M. & Altman, N. (2019) Points of significance: Quantile regression. Nat. Methods 16:451–452.


