

Art of the Personalized Oncogenomics Program
Nature uses only the longest threads to weave her patterns, so that each small piece of her fabric reveals the organization of the entire tapestry.
— Richard Feynman
contents


As individuals, we all have slightly different genomes. If you compare the genomes of two people, you will find about 3 million base pair differences, which is about 0.1% of the genome.
This variation exists not only within the population but potentially also, to a lesser extent, among our cells, which number around 40 trillion. That's roughly 10,000 cells for each base in your 3 billion base genome. And each has a role to play.
| POG cases, by tissue type | |||
|---|---|---|---|
| n | % | ||
| Gastrointestinal ● | 141 | 25 | |
| Breast ● | 138 | 25 | |
| Thoracic ● | 57 | 10 | |
| Gynecologic ● | 45 | 8.3 | |
| Soft tissue ● | 44 | 8.1 | |
| Skin ● | 11 | 2.0 | |
| Urologic ● | 8 | 1.5 | |
| Hematologic ● | 7 | 1.3 | |
| Head and neck ● | 6 | 1.1 | |
| Endocrine ● | 5 | 0.9 | |
| Central nervous system ● | 5 | 0.9 | |
| Other ● | 78 | 14 | |
| ALL | 545 | ||
One consequence of this complexity and variation is that changes in the genome (through mutation or other processes) can have very different effects, depending on both the change and the genome. Cancer is a phenomena in which cells' ability to organize themselves as they divide is altered due to changes in the genome. It is an incredibly complex biological phenomenon—considering all the genomes in the population and all the possible changes that may arise, there is truly an inexhaustible number of ways in which the genome can break.
Cancers are classified according to their site of origin, such as lung, breast, liver, or colon. This is a coarse grouping—within each group there are many subtypes with differences in response to treatment and overall behaviour.
The design of the POG art highlights the diversity and similarity among cases. The diversity is what makes the study of cancer difficult and the similarities are what makes inference possible.

Each case is represented by three concentric rings. The width of each ring represents the extent to which the case is similar (as measured by correlation) to cancers of the type encoded by the color of the ring (see Methods).
In additional to the posters, I've created remixes for your desktop at 4k resolution.


This year, the cyclists in the Ride to Conquer Cancer will not only have the chance to raise money for research (as they've always done) but also do so while wearing data (as they've never done before).
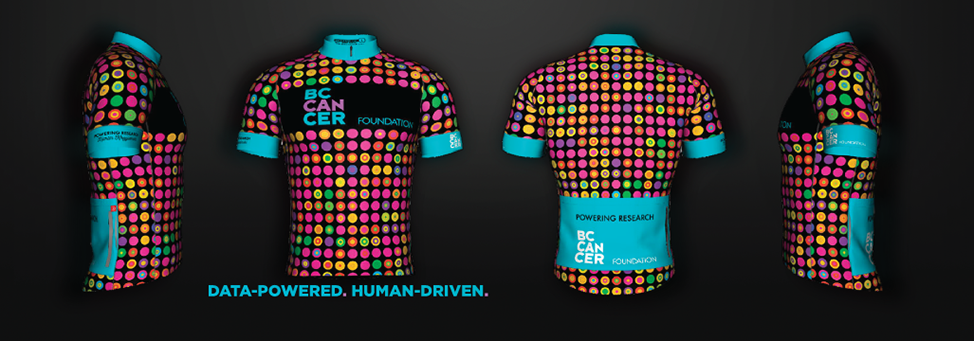
You can purchase your own data-powered and human-driven cycling jersey.
Propensity score weighting
It is not certain that everything is uncertain. —Blaise Pascal
We have already explored how we can mitigate bias caused by confounding variables in observational studies using propensity score (PS) matching (PSM) and propensity score weighting (PSW). However, any statistical model is only as good as its assumptions and, if it is specified incorrectly, it can itself produce biased estimates of the treatment effect.

This month, we explore double robustness, a powerful statistical concept that provides a valuable “safety net” against the risk of an incorrect model. It offers two opportunities, instead of just one, to obtain a valid estimate of the treatment effect — making it possible to draw credible causal inferences from observational data without having to depend on a single set of modeling assumptions.
Kurz, C.F., Krzywinski, M. & Altman, N. (2026) Points of significance: Double Robustness. Nat. Methods 23:868–869.
Nature Biotechnology cover
My cover design on the 7 April 2026 Nature Biotechnology issue shows the dendrogram that represents a cluster of uniquely expressed (or downregulated) genes in human naive stem cells induced from such cells. Within each dendrogram block, the genomic barcode sequence (sampled from Supplementary Table 1) is depicted with a Code 39 barcode. The highlighted barcode is one of those used for cell isolation.
Ishiguro S. et al. A multi-kingdom genetic barcoding system for precise clone isolation (2026) Nature Biotechnology 44:616–629.

Browse my gallery of cover designs.

Happy 2026 π Day—
Art for the 5%
Celebrate π Day (March 14th) and enjoy the art — but only if you're part of the 5%.
Go ahead, see what you can't see.

Ishihara's Tests for Colour Deficiency
Authentic and accurate images of Ishihara's test plates photographed (and lovingly color-corrected) from the 38-plate Ishihara's Tests for Colour Deficiency.
I also provide the position, size, and color of each circle on each test plate.


Symmetric alternatives to the ordinary least squares regression
What immortal hand or eye, could frame thy fearful symmetry? — William Blake, "The Tyger"
This month, we look at symmetric regression, which, unlike simple linear regression, it is reversible — remaining unaltered when the variables are swapped.
Simple linear regression can summarize the linear relationship between two variables `X` and `Y` — for example, when `Y` is considered the response (dependent) and `X` the predictor (independent) variable.
However, there are times when we are not interested (or able) to distinguish between dependent and independent variables — either because they have the same importance or the same role. This is where symmetric regression can help.

Luca Greco, George Luta, Martin Krzywinski & Naomi Altman (2025) Points of significance: Symmetric alternatives to the ordinary least squares regression. Nat. Methods 22:1610–1612.
Beyond Belief Campaign BRCA Art
Fuelled by philanthropy, findings into the workings of BRCA1 and BRCA2 genes have led to groundbreaking research and lifesaving innovations to care for families facing cancer.
This set of 100 one-of-a-kind prints explore the structure of these genes. Each artwork is unique — if you put them all together, you get the full sequence of the BRCA1 and BRCA2 proteins.
