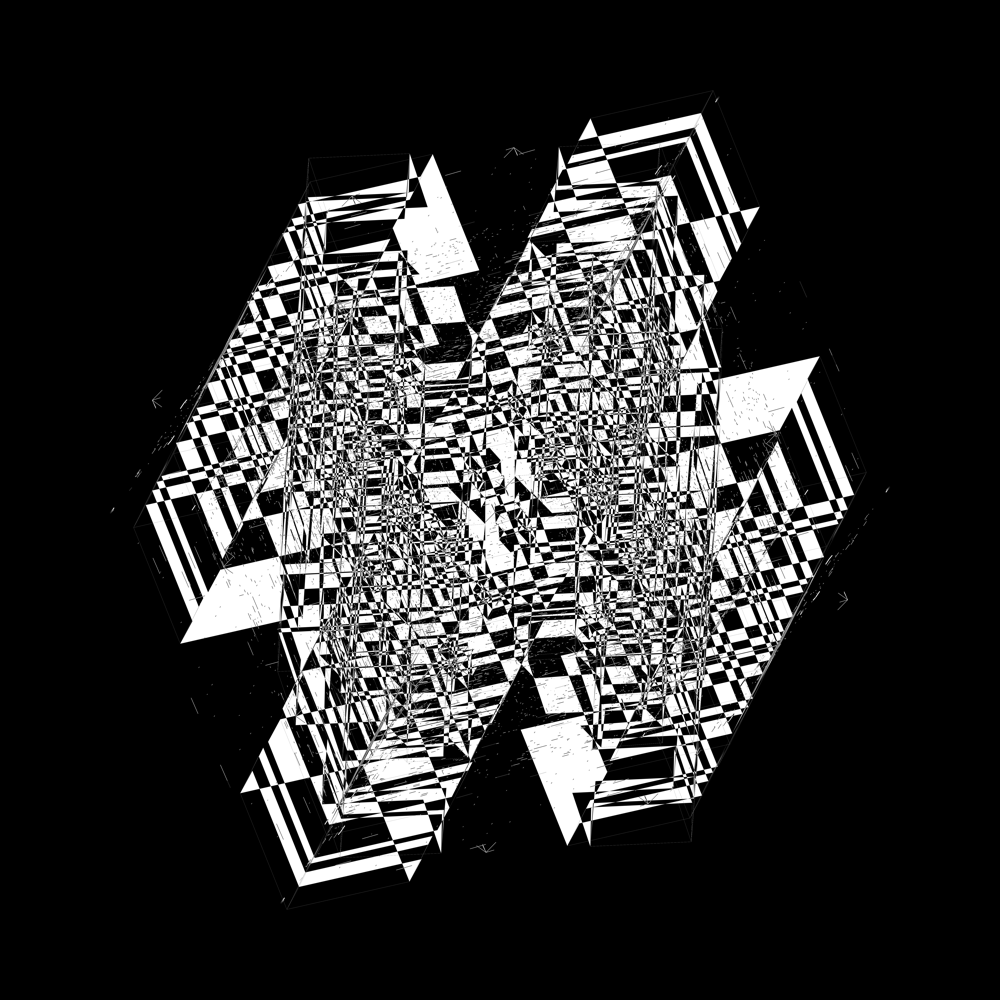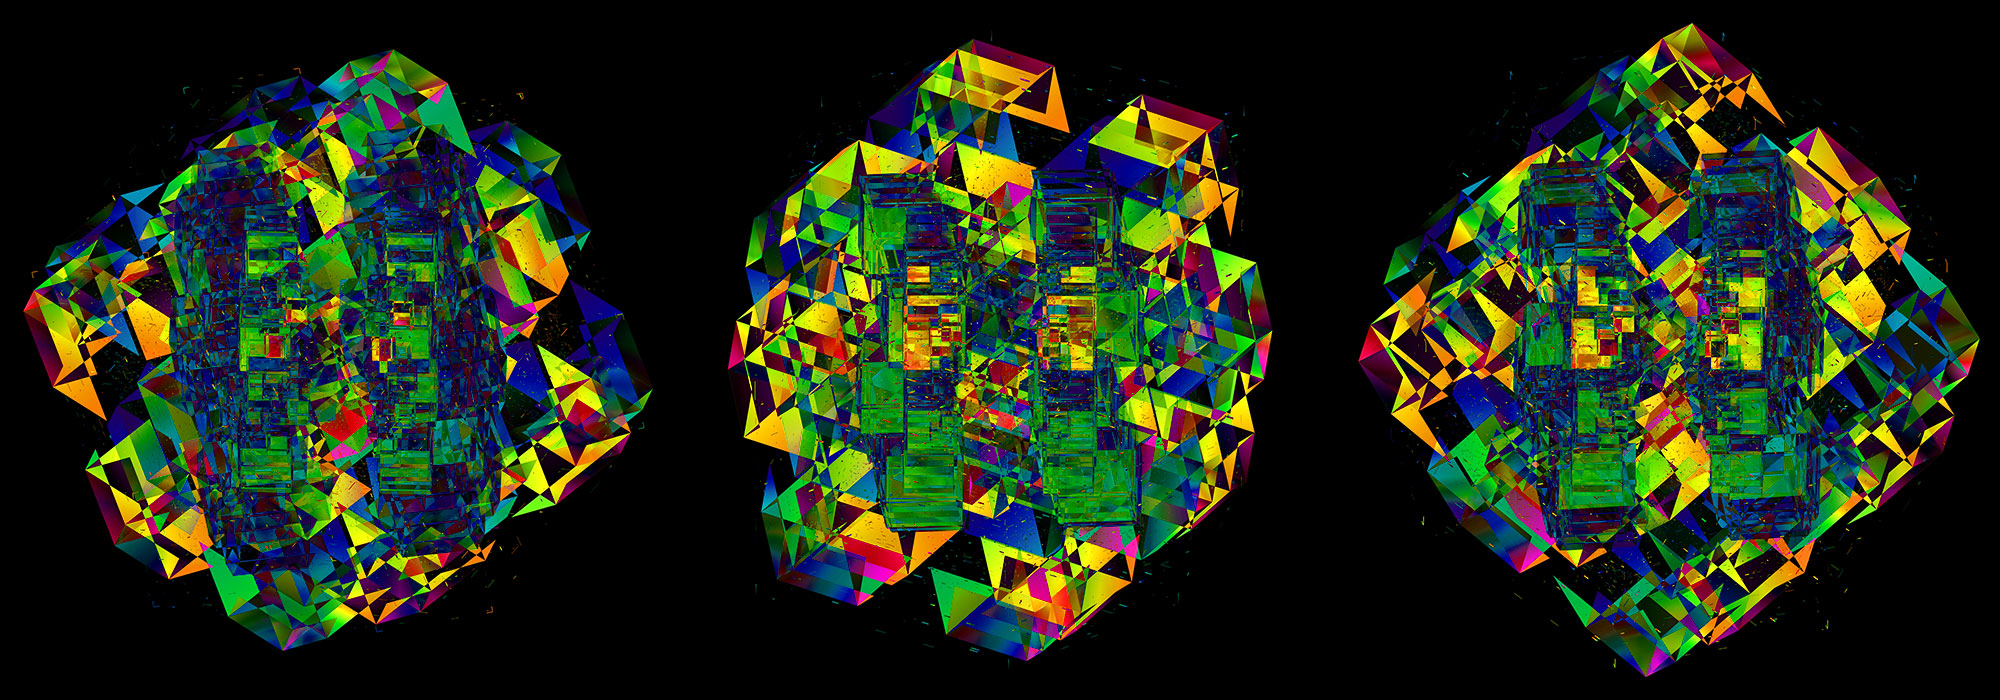
Max Cooper's Ascent — Making of the Music video
Enter the 5th dimension
contents
We know you're Yearning for the Infinite, but do you yearn for dimensions too?
Welcome to Ascent from Max Cooper's latest album Unspoken Words.
So, go ahead — ascend to higher dimensions. You may forget to come back.
An early version of the Ascent video premiered at Max's Live at the Acropolis show.
The video expands on visual elements first presented at the And& festival in Leuven.
The “Ascent” digital art collection by Max Cooper and Martin Krzywinski comprises vast images of transcendence in 75 million pixels on billboards in NYC, LA, Miami, London, Berlin and Leuven.
The collection is the latest of the NFT collections curated by Mesh Lab.
They look superb in print.
 buy artwork
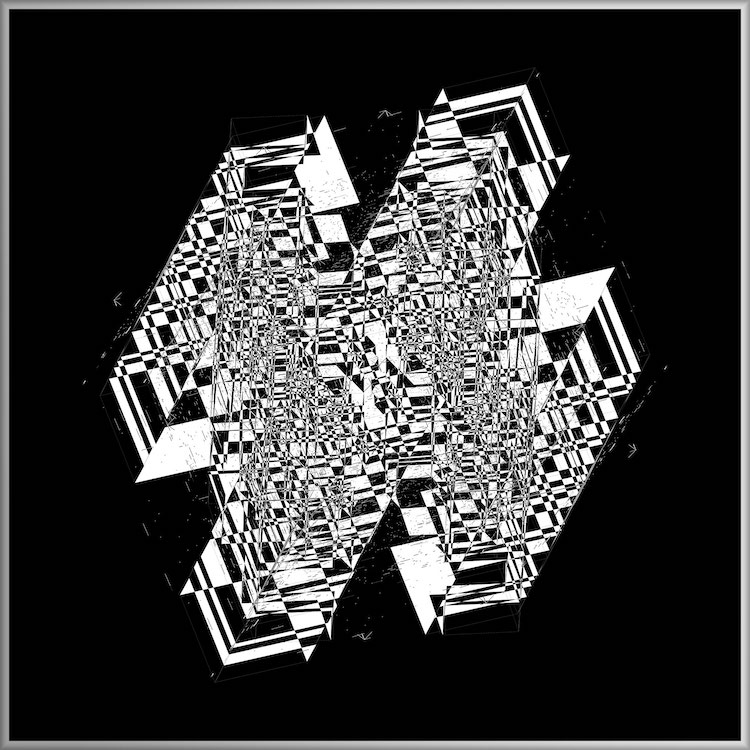
The video builds on work I did with Max for Transcendence from the Yearning for the Infinite, which itself was based on my 2015 Pi Day art.
In 5 minutes and 55 seconds (8,520 frames), the video takes you from zero to 5 dimensions and back again.
To help you interpret what you are seeing, I walk you through the video. I also present the animation system I built for the video, which was coded from scratch.
The entire animation is built up from about 170 keyframes. Each keyframe defines (a) which objects are shown (b) the dimensionality, size and rotation of each object and (c) the zoom and rotation of the camera itself.
The walkthrough will take you through some of the important keyframes in the video — where new elements are introduced or interesting things happen.

c c0 s [w] 0.815
c c0 s [xyz] 0.15
The keyframe definitions are shown in yellow boxes under the frame — these are commands that the animation system parses as it builds the scene over time. The grey boxes show position and zoom of the camera and the actual angles and sizes of objects.
Right now, all this looks confusing — not to worry, it will all be explained in the walkthrough!
If you like math to a heavy beat and a lot of screen flashing, check out Aleph, our 6 minute video on the story of transfinite numbers.
The video is unique in that it demonstrates Cantor's diagnoal argument to proove that rationals are countable and that reals are not countable.
Mesh was founded in 2016 to explore the intersection of music, science and art. With a growing global audience and engaged community of practitioners and activists, the platform has conceived work by leading creatives in the fields of music, digital art, film, installation, code, architecture, developing collaborations and commissions with business, arts and science institutions.
Typically, Mesh projects begin with a scientific stimulus which leads to a creative expression, incorporating a variety of digital media including AR, AI, VR, NFT, spatial audio as well as physical structures and live experiences. Collaborators and commissioners include The Babraham Institute, Zaha Hadid Architects, Dolby, L-Acoustics and PepsiCo, and have been exhibited and performances at Barbican Arts Centre, Odeon of Herodes Atticus at the Acropolis and will host an interactive art installation during Art Basel in Miami from 1—2 December.
Beyond Belief Campaign BRCA Art
Fuelled by philanthropy, findings into the workings of BRCA1 and BRCA2 genes have led to groundbreaking research and lifesaving innovations to care for families facing cancer.
This set of 100 one-of-a-kind prints explore the structure of these genes. Each artwork is unique — if you put them all together, you get the full sequence of the BRCA1 and BRCA2 proteins.
Propensity score weighting
The needs of the many outweigh the needs of the few. —Mr. Spock (Star Trek II)
This month, we explore a related and powerful technique to address bias: propensity score weighting (PSW), which applies weights to each subject instead of matching (or discarding) them.
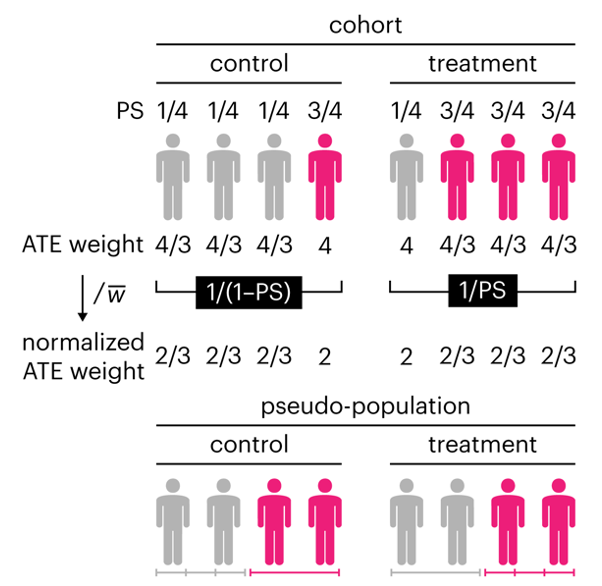
Kurz, C.F., Krzywinski, M. & Altman, N. (2025) Points of significance: Propensity score weighting. Nat. Methods 22:1–3.
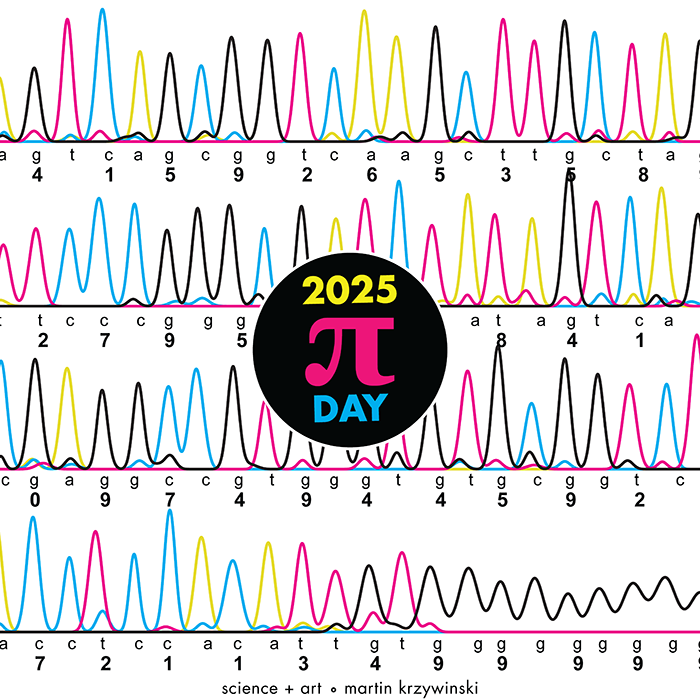
Happy 2025 π Day—
TTCAGT: a sequence of digits
Celebrate π Day (March 14th) and sequence digits like its 1999. Let's call some peaks.
Crafting 10 Years of Statistics Explanations: Points of Significance
I don’t have good luck in the match points. —Rafael Nadal, Spanish tennis player
Points of Significance is an ongoing series of short articles about statistics in Nature Methods that started in 2013. Its aim is to provide clear explanations of essential concepts in statistics for a nonspecialist audience. The articles favor heuristic explanations and make extensive use of simulated examples and graphical explanations, while maintaining mathematical rigor.
Topics range from basic, but often misunderstood, such as uncertainty and P-values, to relatively advanced, but often neglected, such as the error-in-variables problem and the curse of dimensionality. More recent articles have focused on timely topics such as modeling of epidemics, machine learning, and neural networks.
In this article, we discuss the evolution of topics and details behind some of the story arcs, our approach to crafting statistical explanations and narratives, and our use of figures and numerical simulations as props for building understanding.
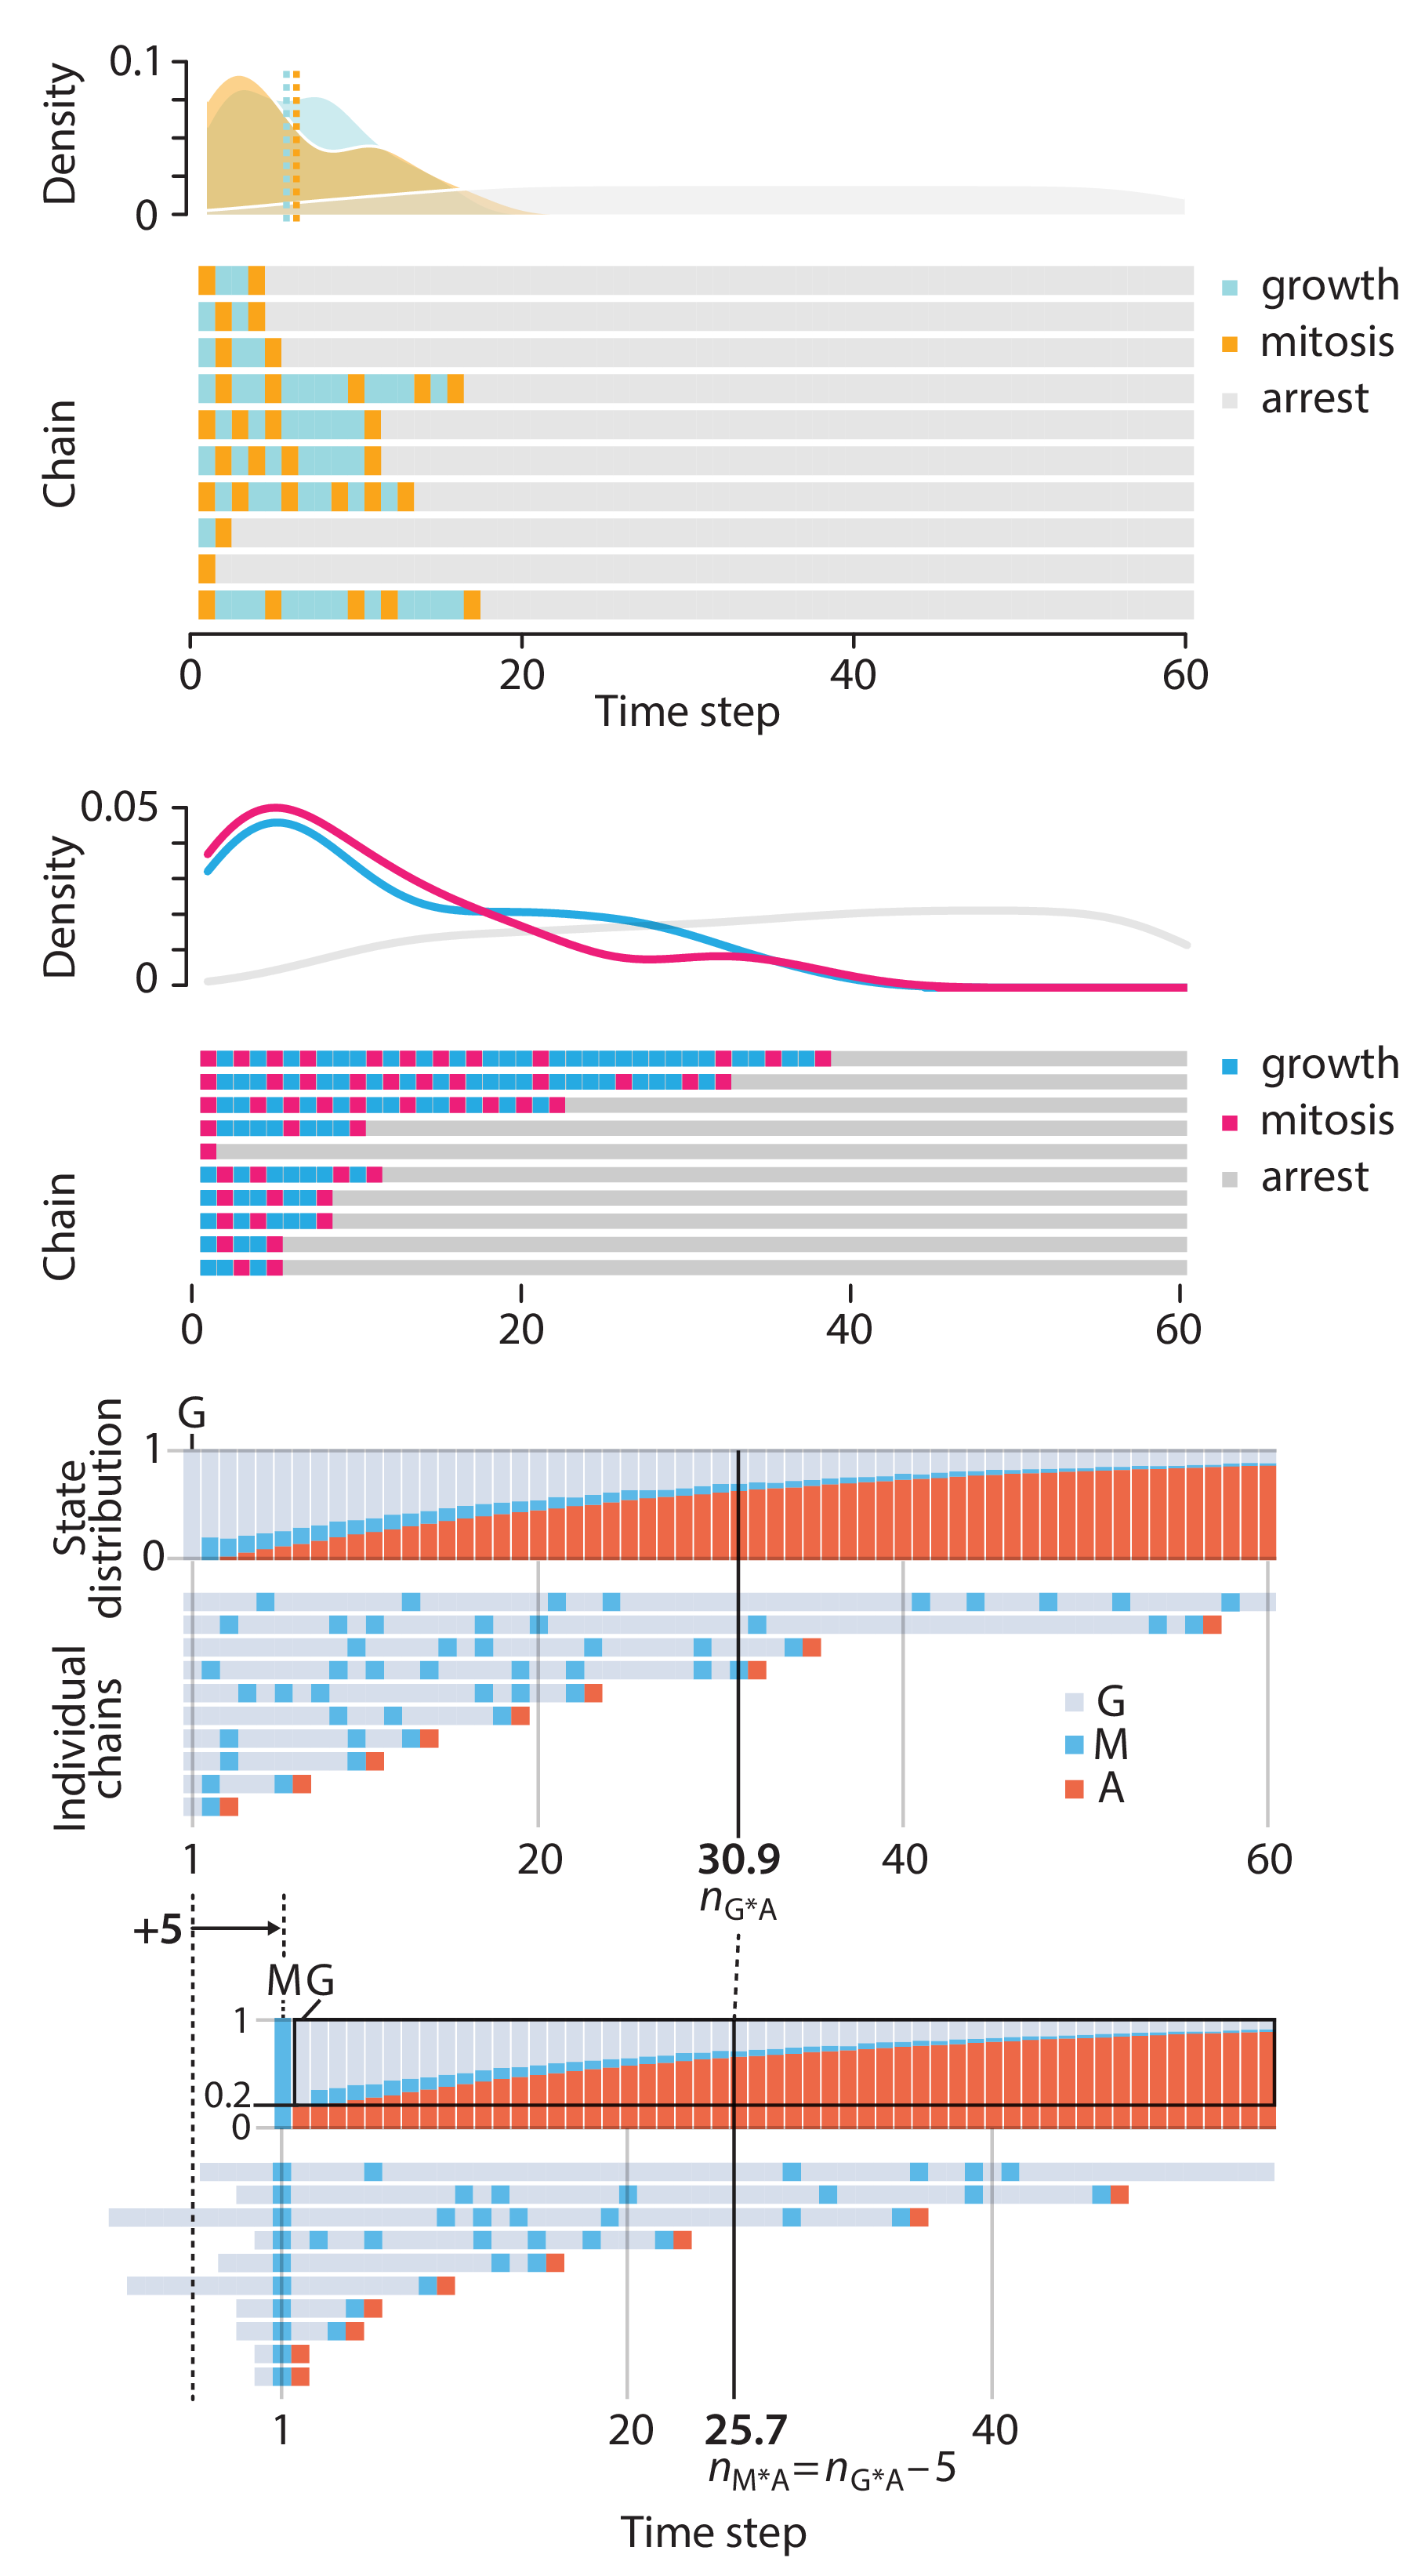
Altman, N. & Krzywinski, M. (2025) Crafting 10 Years of Statistics Explanations: Points of Significance. Annual Review of Statistics and Its Application 12:69–87.
Propensity score matching
I don’t have good luck in the match points. —Rafael Nadal, Spanish tennis player
In many experimental designs, we need to keep in mind the possibility of confounding variables, which may give rise to bias in the estimate of the treatment effect.

If the control and experimental groups aren't matched (or, roughly, similar enough), this bias can arise.
Sometimes this can be dealt with by randomizing, which on average can balance this effect out. When randomization is not possible, propensity score matching is an excellent strategy to match control and experimental groups.
Kurz, C.F., Krzywinski, M. & Altman, N. (2024) Points of significance: Propensity score matching. Nat. Methods 21:1770–1772.
Understanding p-values and significance
P-values combined with estimates of effect size are used to assess the importance of experimental results. However, their interpretation can be invalidated by selection bias when testing multiple hypotheses, fitting multiple models or even informally selecting results that seem interesting after observing the data.
We offer an introduction to principled uses of p-values (targeted at the non-specialist) and identify questionable practices to be avoided.
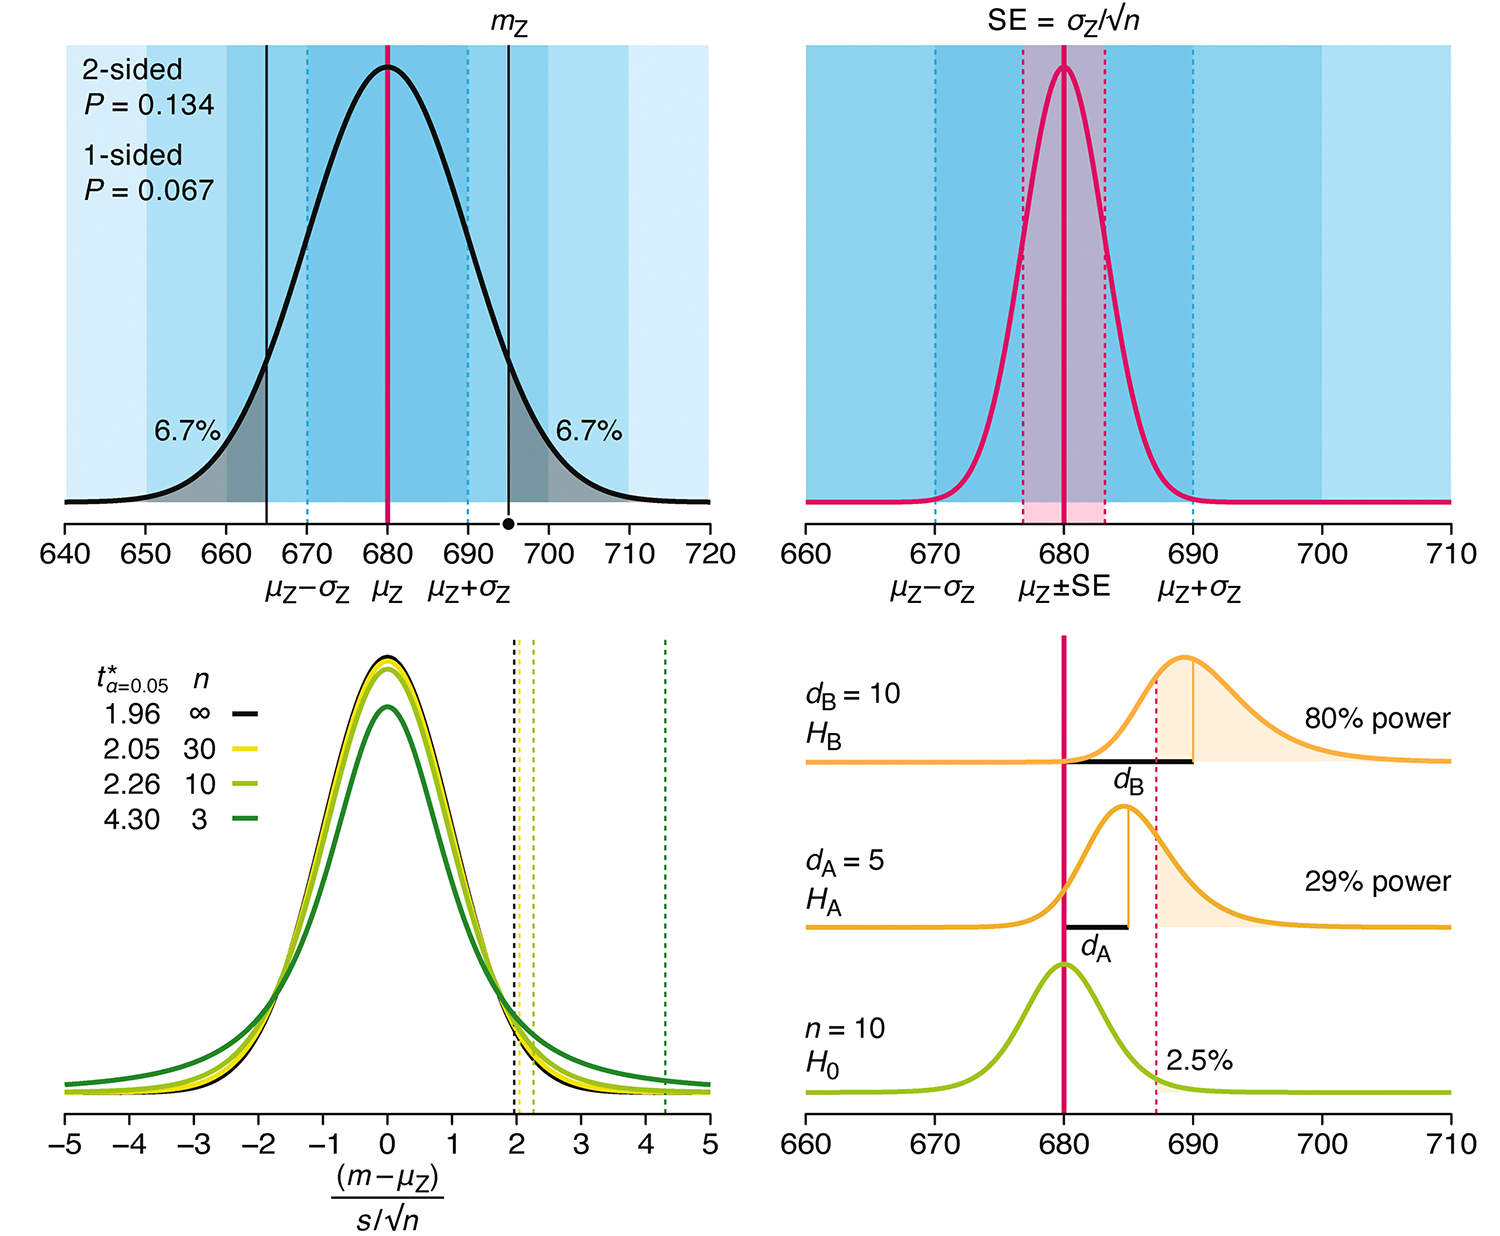
Altman, N. & Krzywinski, M. (2024) Understanding p-values and significance. Laboratory Animals 58:443–446.

