Search Globe — Global Visualization of Google Searches by Language
contents
- 1 · Data annotations — geotagged and ranked
- 2 · Google search volume
- 3 · Observations on the data
- 3.1 · I'm an illegal alien
- 3.2 · Chinese takeout
- 3.3 · English around the world
- 3.3.1 · English in South America
- 3.3.2 · English in Asia
- 3.3.3 · English in the Far North
- 3.3.4 · English in the Far South
- 3.4 · Most remote locations
- 3.4.1 · Most remote
- 3.4.2 · Most remote — nearest city searching in the same language
- 3.4.3 · Most remote — nearest city searching in a different language
- 3.5 · Top 10 locations
- 3.6 · Top 100 locations
Shown here is a globe visualization of world-wide Google searches, categorized by one of 21 languages. The visualization is created with WebGL toolkit and bundled data from Chrome Experiments.
I have annotated the data with geographical information from MaxMind, to include city, region, and country for each search location. The closest city was determined by finding the entry in the MaxMind data set (2.8M cities) with the smallest haversine distance to the coordinates of the search term. Note that latitude and longitude were provided to 3 decimal places in the original data file but are available to 7 decimal places in the MaxMind set.
The annotated data file includes new fields
rank(1-indexed rank of magnitude of search data point)cumulative_value(fractional total of all search terms with equal or smaller magnitude)language_name(name of the search language)city(closest city to latitude/longitude of search data point)region(region of closest city)country(country of closest city)city_latitude, city_longitude(coordinates of closest city)
Thanks to Evan Applegate from UC Davis for requesting an explanation of the additional fields. They were not obvious.
View all languages or individual data for the following languages: Arabic Belgian Chinese Dutch English Finnish French German Indonesian Italian Japanese Korean Norwegian Polish Portuguese Romanian Russian Spanish Swedish Thai Turkish
View top 5%, 10%, 15% of data.
View top 10 20 50 100 search locations.
View search density.
Showing all languages.

The color legend was created based on the color scheme used in the original webgl-globe code.
There are 11 locations in the US with searches in Spanish: Dillard, Douglas, Flint Hill, Floyds Knobs, Great Falls, Orrs Island, Redwood Estates, Simpsonville, Spanish Fork, Spanish Fort, and Washington. Conspicuously, Los Angeles is missing.

The northern-most town in Mexico with a Spanish search is Mexicali (Baja Californa, lat 32.65 long -115.47).
The Chinese takeover (but not takeout) has been largely overestimated. Only two towns in the US participate in Chinese language searches: Williamsport and Evensville.

With the exception of Albouystown (Demerara-Mahaica, Guyana) and Paramaribo (Suriname), South America shows no English searches.

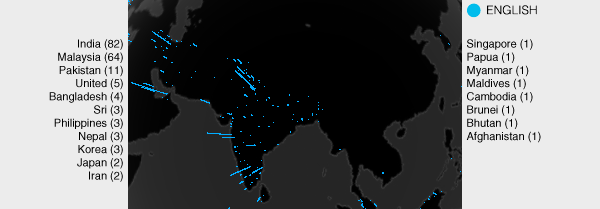
Asia shows interesting patterns. Namely, no English searches are seen from China. No doubt, political firewalls are the cause. By country, India leads with 82 searches, followed by Malaysia (64) and Pakistan (11). The full list is India (82), Malaysia (64), Pakistan (11), United (5), Bangladesh (4), Sri (3), Philippines (3), Nepal (3), Korea (3), Japan (2), Iran (2), Singapore (1), Papua (1), Myanmar (1), Maldives (1), Cambodia (1), Brunei (1), Bhutan (1), Afghanistan (1).
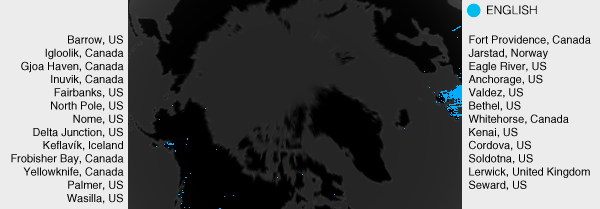
There are 25 locations with English language searches at latitude ≥ 60°. There are 15 cities in Alaska with searches (Anchorage, Barrow, Bethel, Cordova, Delta Junction, Eagle River, Fairbanks, Kenai, Nome, North Pole, Palmer, Seward, Soldotna, Valdez, Wasilla), of which Barrow is furthest north (lat 71.29°). The other 10 cities are mostly in Canada: Lerwick (Shetland Islands, United Kingdom, lat 60.160°), Whitehorse (Yukon Territory, Canada, lat 60.720°), Jarstad (Sogn og Fjordane, Norway, lat 61.360°), Fort Providence (Northwest Territories, Canada, lat 61.380°), Yellowknife (Northwest Territories, Canada, lat 62.450°), Frobisher Bay (Nunavut, Canada, lat 63.750°), Keflavík Gullbringusysla Iceland lat 64.010°), Inuvik (Northwest Territories, Canada, lat 68.340°), Gjoa Haven (Nunavut, Canada, lat 68.630°), Igloolik (Nunavut, Canada, lat 69.380°).
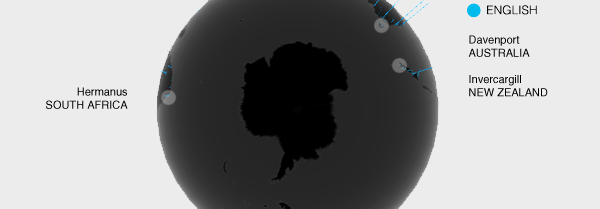
New Zealand and Australia dominate search loations in the far south. The southermost English search is from Invercargill (Southland, New Zealand, lat -46.4° — compare this to the northmost search from Barrow in Alaska at lat 71.29°). In Australia, the southermost search is from Davenport (Tasmania, Australia, lat -41.17°). In South Africa, the southermost search is from Hermanus (Western Cape, South Africa, lat -34.42°).
What is the most remote search location? Here, I define distance between locations by the haversine distance.
I tabulate three types of remote locations, by language, by finding
- most remote, regardless of language of nearest city
- most remote, with nearest city searching in the same language
- most remote, with nearest city searching in a different language
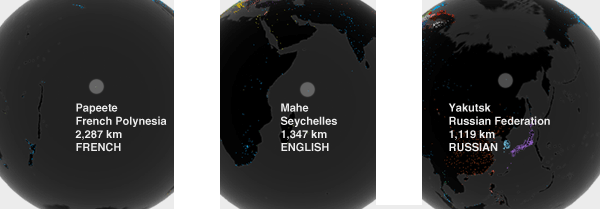
Cities, by language, most distant from their closest city.
The most remote search location of alll is Papeete, whose closest search data point is 2,287 km away — Fusi in American Samoa. Also interesting is the Belgian-speakinng Westerschelling in the Netherlands, which has the smallest maximum distance to its nearest city, by language. It is 25 km from Harlingen, Netherlands.
- French Papeete (French Polynesia, lat -17.540° long -149.570°) 2287 km from English Fusi (American Samoa, United States)
- English Mahé (Beau Vallon, Seychelles, lat -4.620° long 55.440°) 1347 km from English Hamar (Banaadir, Somalia)
- Russian Yakutsk (Sakha, Russian Federation, lat 62.040° long 129.750°) 1119 km from Chinese Kuchiku (Heilongjiang, China)
- Dutch Godthaab (Vestgronland, Greenland, lat 64.180° long -51.720°) 818 km from English Frobisher Bay (Nunavut, Canada)
- Portuguese Boa Vista (Roraima, Brazil, lat 2.820° long -60.670°) 522 km from English Albouystown (Demerara-Mahaica, Guyana)
- Indonesian Lette (Indonesia, lat -5.150° long 119.410°) 516 km from Indonesian Balikpapan (Kalimantan Timur, Indonesia)
- Spanish San Juan de Miraflores (Loreto, Peru, lat -3.760° long -73.270°) 458 km from Spanish San Martin (San Martin, Peru)
- Chinese Hotan (Xinjiang, China, lat 37.110° long 79.920°) 431 km from Chinese Kaschgar (Xinjiang, China)
- Arabic Ara`ar (Al Hudud ash Shamaliyah, Saudi Arabia, lat 30.980° long 41.030°) 390 km from Arabic Hael (Ha'il, Saudi Arabia)
- Japanese Nase (Kagoshima, Japan, lat 28.380° long 129.490°) 248 km from Japanese Nago (Okinawa, Japan)
- Thai Amphoe Muang Ranong (Ranong, Thailand, lat 9.970° long 98.640°) 225 km from Thai Amphoe Muang Nakhon Si Thammarat (Nakhon Si Thammarat, Thailand)
- Turkish Thospia (Van, Turkey, lat 38.490° long 43.380°) 177 km from English Sangar-e Beru Khan (Azarbayjan-e Bakhtari, Iran)
- Norwegian Guovdagæidno (Finnmark, Norway, lat 69.010° long 23.040°) 107 km from Norwegian Bosekop (Finnmark, Norway)
- Swedish Lofsdalen (Jamtlands Lan, Sweden, lat 62.120° long 13.270°) 106 km from Norwegian Nybergsund (Hedmark, Norway)
- Finnish Kansela (Oulu, Finland, lat 65.970° long 29.170°) 98 km from Finnish Märkäjärvi (Lapland, Finland)
- Romanian Sisesti (Gorj, Romania, lat 45.060° long 23.300°) 68 km from Romanian Drobeta-Turnu Severin (Mehedinti, Romania)
- Italian Nuoro (Sardegna, Italy, lat 40.320° long 9.330°) 60 km from Italian Santu Lussurgiu (Sardegna, Italy)
- Polish Vlodava (Poland, lat 51.550° long 23.550°) 45 km from Polish Bielawin (Poland)
- Korean Bontoku (Kyongsang-bukto, Korea, lat 36.410° long 129.370°) 43 km from Korean Eijitsu (Kyongsang-bukto, Korea)
- German Monplaisir (Brandenburg, Germany, lat 53.060° long 14.270°) 39 km from German Prenzlau (Brandenburg, Germany)
- Belgian Westerschelling (Friesland, Netherlands, lat 53.360° long 5.220°) 25 km from Belgian Harlingen (Friesland, Netherlands)
Cities, by language, most distant from their closest city, in which people speak (i.e. search) in the same language.
English searches are the most spread out on the globe. Of all search languuages, Mahe in Seychelles is furthest from its same-language nearest loccation of all other languages. It is 1,347 from Hamar in Somalia, in which English searches are found.
- English Mahé (Beau Vallon, Seychelles, lat -4.620° long 55.440°) 1347 km from English Hamar (Banaadir, Somalia)
- Indonesian Lette (Indonesia, lat -5.150° long 119.410°) 516 km from Indonesian Balikpapan (Kalimantan Timur, Indonesia)
- Spanish San Juan de Miraflores (Loreto, Peru, lat -3.760° long -73.270°) 458 km from Spanish San Martin (San Martin, Peru)
- Chinese Hotan (Xinjiang, China, lat 37.110° long 79.920°) 431 km from Chinese Kaschgar (Xinjiang, China)
- Arabic Ara`ar (Al Hudud ash Shamaliyah, Saudi Arabia, lat 30.980° long 41.030°) 390 km from Arabic Hael (Ha'il, Saudi Arabia)
- Japanese Nase (Kagoshima, Japan, lat 28.380° long 129.490°) 248 km from Japanese Nago (Okinawa, Japan)
- Thai Amphoe Muang Ranong (Ranong, Thailand, lat 9.970° long 98.640°) 225 km from Thai Amphoe Muang Nakhon Si Thammarat (Nakhon Si Thammarat, Thailand)
- Norwegian Guovdagæidno (Finnmark, Norway, lat 69.010° long 23.040°) 107 km from Norwegian Bosekop (Finnmark, Norway)
- Finnish Kansela (Oulu, Finland, lat 65.970° long 29.170°) 98 km from Finnish Märkäjärvi (Lapland, Finland)
- Romanian Sisesti (Gorj, Romania, lat 45.060° long 23.300°) 68 km from Romanian Drobeta-Turnu Severin (Mehedinti, Romania)
- Italian Nuoro (Sardegna, Italy, lat 40.320° long 9.330°) 60 km from Italian Santu Lussurgiu (Sardegna, Italy)
- Polish Vlodava (Poland, lat 51.550° long 23.550°) 45 km from Polish Bielawin (Poland)
- Korean Bontoku (Kyongsang-bukto, Korea, lat 36.410° long 129.370°) 43 km from Korean Eijitsu (Kyongsang-bukto, Korea)
- German Monplaisir (Brandenburg, Germany, lat 53.060° long 14.270°) 39 km from German Prenzlau (Brandenburg, Germany)
- Belgian Westerschelling (Friesland, Netherlands, lat 53.360° long 5.220°) 25 km from Belgian Harlingen (Friesland, Netherlands)
Cities, by language, most distant from their closest city, which is foreign (i.e. searching in a different language).
- French Papeete (French Polynesia, lat -17.540° long -149.570°) 2287 km from English Fusi (American Samoa, United States)
- Russian Yakutsk (Sakha, Russian Federation, lat 62.040° long 129.750°) 1119 km from Chinese Kuchiku (Heilongjiang, China)
- Dutch Godthaab (Vestgronland, Greenland, lat 64.180° long -51.720°) 818 km from English Frobisher Bay (Nunavut, Canada)
- Portuguese Boa Vista (Roraima, Brazil, lat 2.820° long -60.670°) 522 km from English Albouystown (Demerara-Mahaica, Guyana)
- Turkish Thospia (Van, Turkey, lat 38.490° long 43.380°) 177 km from English Sangar-e Beru Khan (Azarbayjan-e Bakhtari, Iran)
- Swedish Lofsdalen (Jamtlands Lan, Sweden, lat 62.120° long 13.270°) 106 km from Norwegian Nybergsund (Hedmark, Norway)
About 10% of all searches come from the top 10 locations.
- English New York (United States)
- French Paris (France)
- Turkish Istanbul (Turkey)
- English London (United Kingdom)
- Portuguese Sao Paolo (Brazil)
- English Miami (United States)
- German Berlin (Germany)
- Spanish Madrid (Spain)
- Spanish Mexico City (Mexico)
- Thai Bangkok (Thailand)
I am surprised to see Miami here (bored retirees?) as well as Istanbul — I don't have a theory for that one.

38% of all searches come from the top 100 locations (out of 22,826), with English dominating (33/100) followed by Spanish (11/100).
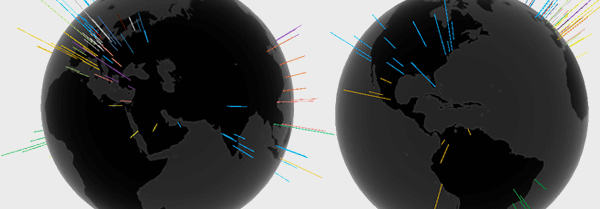
The full breakdown for the top 100 locations by language is English (33), Spanish (11), German (8), Japanese (6), Dutch (6), Portuguese (5), French (5), Turkish (4), Italian (4), Chinese (4), Russian (3), Arabic (3), Polish (2), Thai (1), Swedish (1), Romanian (1), Korean (1), Indonesian (1), Finnish (1).
By country, the top 100 locations fall in United States (11), Germany (6), India (6), Japan (6), Brazil (5), United Kingdom (5), Italy (4), Turkey (4), Australia (3), France (3), Mexico (3), Russian Federation (3), Canada (2), China (2), Colombia (2), Poland (2), Saudi Arabia (2), Spain (2), Vietnam (2), Algeria (1), Argentina (1), Austria (1), Chile (1), Egypt (1), Finland (1), Greece (1), Hong Kong (1), Hungary (1), Indonesia (1), Ireland (1), Israel (1), Korea (1), Malaysia (1), Peru (1), Philippines (1), Romania (1), Serbia (1), Singapore (1), Sweden (1), Switzerland (1), Taiwan (1), Thailand (1), Tunisia (1), Ukraine (1), United Arab Emirates (1), Venezuela (1)
The top 100 locations are
- English New York (New York, United States)
- French Saint-Merri (Ile-de-France, France)
- Turkish Küçükpazar (Istanbul, Turkey)
- English City of London (Essex, United Kingdom)
- Portuguese Liberdade (Sao Paulo, Brazil)
- English Miami (Florida, United States)
- German Berlin (Berlin, Germany)
- Spanish Entrevías (Madrid, Spain)
- Spanish Ciudad de México (Distrito Federal, Mexico)
- Thai Amphoe Bang Rak (Krung Thep, Thailand)
- Spanish Bogotá (Cundinamarca, Colombia)
- English City of Sydney (New South Wales, Australia)
- Spanish Hacienda Huachipa (Lima, Peru)
- Spanish San Telmo (Distrito Federal, Argentina)
- Italian Roma (Lazio, Italy)
- Polish Powisle (Poland)
- Italian Mailand (Lombardia, Italy)
- English South Melbourne (Victoria, Australia)
- English Los Angeles (California, United States)
- Portuguese São Cristavem (Rio de Janeiro, Brazil)
- Russian Moscou (Moscow City, Russian Federation)
- Turkish Maltepe (Ankara, Turkey)
- Indonesian Pasarmanggis (Jakarta Raya, Indonesia)
- Dutch Ho Chi Minh City (Ho Chi Minh, Vietnam)
- Spanish Barcelona (Catalonia, Spain)
- English Toronto (Ontario, Canada)
- Spanish La Reina (Region Metropolitana, Chile)
- Spanish Los Caobas (Distrito Federal, Venezuela)
- English Chicago (Illinois, United States)
- Russian KievPetrovsky Port (Kyyivs'ka Oblast', Ukraine)
- Arabic Az Zahra' (Ar Riyad, Saudi Arabia)
- Dutch Xóm Trong (Vietnam)
- German München (Bayern, Germany)
- English Connaught Place (Delhi, India)
- Portuguese Venda Nova (Minas Gerais, Brazil)
- Dutch Afini (Attiki, Greece)
- English Bangalore (Karnataka, India)
- English Kampong Haji Abdullah Hukum (Kuala Lumpur, Malaysia)
- German Hamburg (Hamburg, Germany)
- Chinese Beijing (Beijing, China)
- Arabic Rawd al Faraj (Al Qahirah, Egypt)
- English Singapore City (Singapore)
- English Houston (Texas, United States)
- English Paddington (Essex, United Kingdom)
- Turkish Azmir (Izmir, Turkey)
- Japanese Nishi-okubo (Tokyo, Japan)
- English Spring Hill (Victoria, Australia)
- English Bombay Wadala (Maharashtra, India)
- Dutch Hakiriah (Tel Aviv, Israel)
- French Fourvière (Rhone-Alpes, France)
- Chinese Shanghaishih (Shanghai, China)
- Arabic Bani Malik (Makkah, Saudi Arabia)
- English Daira (Dubai, United Arab Emirates)
- Dutch Kiyabo (Manila, Philippines)
- German Inner City (Wien, Austria)
- Italian Naples (Campania, Italy)
- English Montreal (Quebec, Canada)
- English Kilmainham (Dublin, Ireland)
- German Alt-Wiedikon (Zurich, Switzerland)
- Japanese Kyobashi (Osaka, Japan)
- Dutch Buda (Budapest, Hungary)
- Romanian Bucarest (Bucuresti, Romania)
- Chinese Central District (Hong Kong)
- Japanese Sengendai (Kanagawa, Japan)
- Japanese Hibiyakoen (Tokyo, Japan)
- English Thousand Lights (Tamil Nadu, India)
- English San Francisco (California, United States)
- English Farragut Square (District of Columbia, United States)
- English Victoria Park (Manchester, United Kingdom)
- Swedish Norrmalm (Stockholms Lan, Sweden)
- German Frankford-on-Main (Hessen, Germany)
- German Augusta Ubiorum (Nordrhein-Westfalen, Germany)
- Chinese Fantzupo (T'ai-pei, Taiwan)
- Korean Kyedong (Seoul-t'ukpyolsi, Korea)
- English Lambeth (Lambeth, United Kingdom)
- German Stutengarten (Baden-Wurttemberg, Germany)
- Japanese Sarugakucho (Tokyo, Japan)
- English Seattle (Washington, United States)
- Finnish Gloet (Southern Finland, Finland)
- Italian Borgo Po (Piemonte, Italy)
- Spanish Guadalajara (Jalisco, Mexico)
- Spanish Alpujarra (Antioquia, Colombia)
- French Toulouse (Midi-Pyrenees, France)
- English San Diego (California, United States)
- English Dallas (Texas, United States)
- English Denver (Colorado, United States)
- English Dorcol (Serbia)
- English Aston (Essex, United Kingdom)
- English Romanovskiy (Moskva, Russian Federation)
- Polish Kleparz (Poland)
- Russian Aptekarskiy (Leningrad, Russian Federation)
- Spanish Monterrey (Nuevo Leon, Mexico)
- French El Bia (Alger, Algeria)
- French Al `Umran (Tunisia)
- Portuguese Bahia (Bahia, Brazil)
- Portuguese Brasília (Distrito Federal, Brazil)
- Turkish Adana (Adana, Turkey)
- Japanese Edo (Tokyo, Japan)
- English Bhaganagar (Andhra Pradesh, India)
- English Mali and Munjeri (Maharashtra, India)
Propensity score weighting
The needs of the many outweigh the needs of the few. —Mr. Spock (Star Trek II)
This month, we explore a related and powerful technique to address bias: propensity score weighting (PSW), which applies weights to each subject instead of matching (or discarding) them.
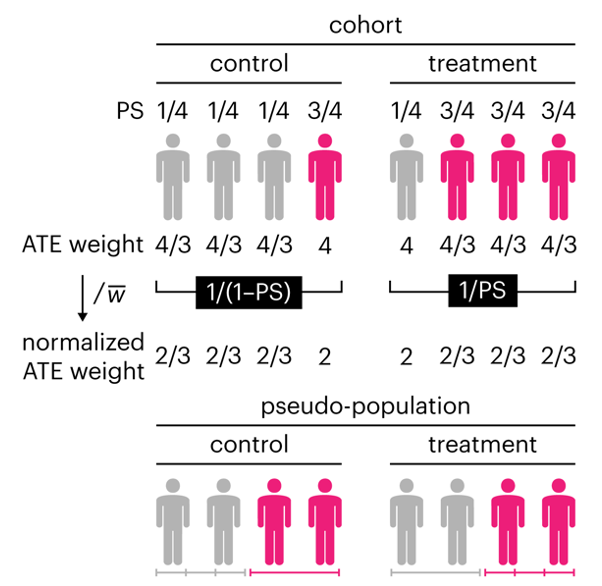
Kurz, C.F., Krzywinski, M. & Altman, N. (2025) Points of significance: Propensity score weighting. Nat. Methods 22:1–3.
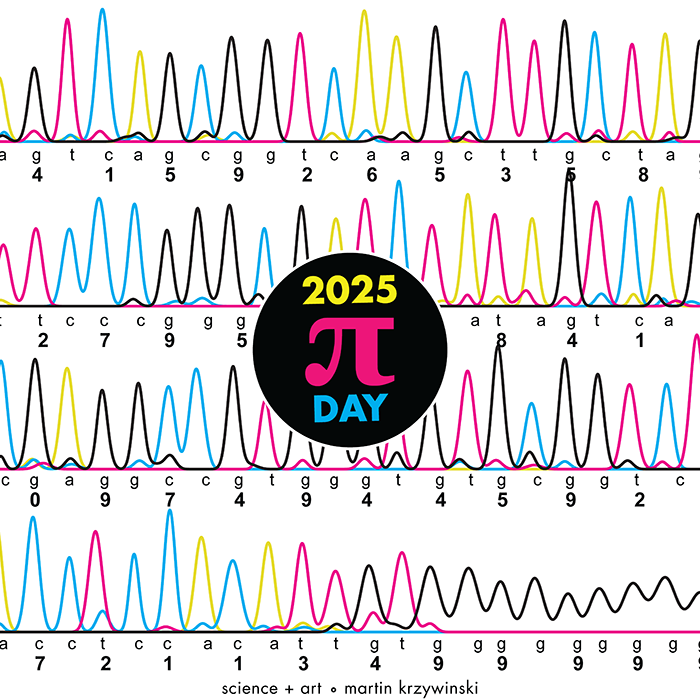
Happy 2025 π Day—
TTCAGT: a sequence of digits
Celebrate π Day (March 14th) and sequence digits like its 1999. Let's call some peaks.
Crafting 10 Years of Statistics Explanations: Points of Significance
I don’t have good luck in the match points. —Rafael Nadal, Spanish tennis player
Points of Significance is an ongoing series of short articles about statistics in Nature Methods that started in 2013. Its aim is to provide clear explanations of essential concepts in statistics for a nonspecialist audience. The articles favor heuristic explanations and make extensive use of simulated examples and graphical explanations, while maintaining mathematical rigor.
Topics range from basic, but often misunderstood, such as uncertainty and P-values, to relatively advanced, but often neglected, such as the error-in-variables problem and the curse of dimensionality. More recent articles have focused on timely topics such as modeling of epidemics, machine learning, and neural networks.
In this article, we discuss the evolution of topics and details behind some of the story arcs, our approach to crafting statistical explanations and narratives, and our use of figures and numerical simulations as props for building understanding.
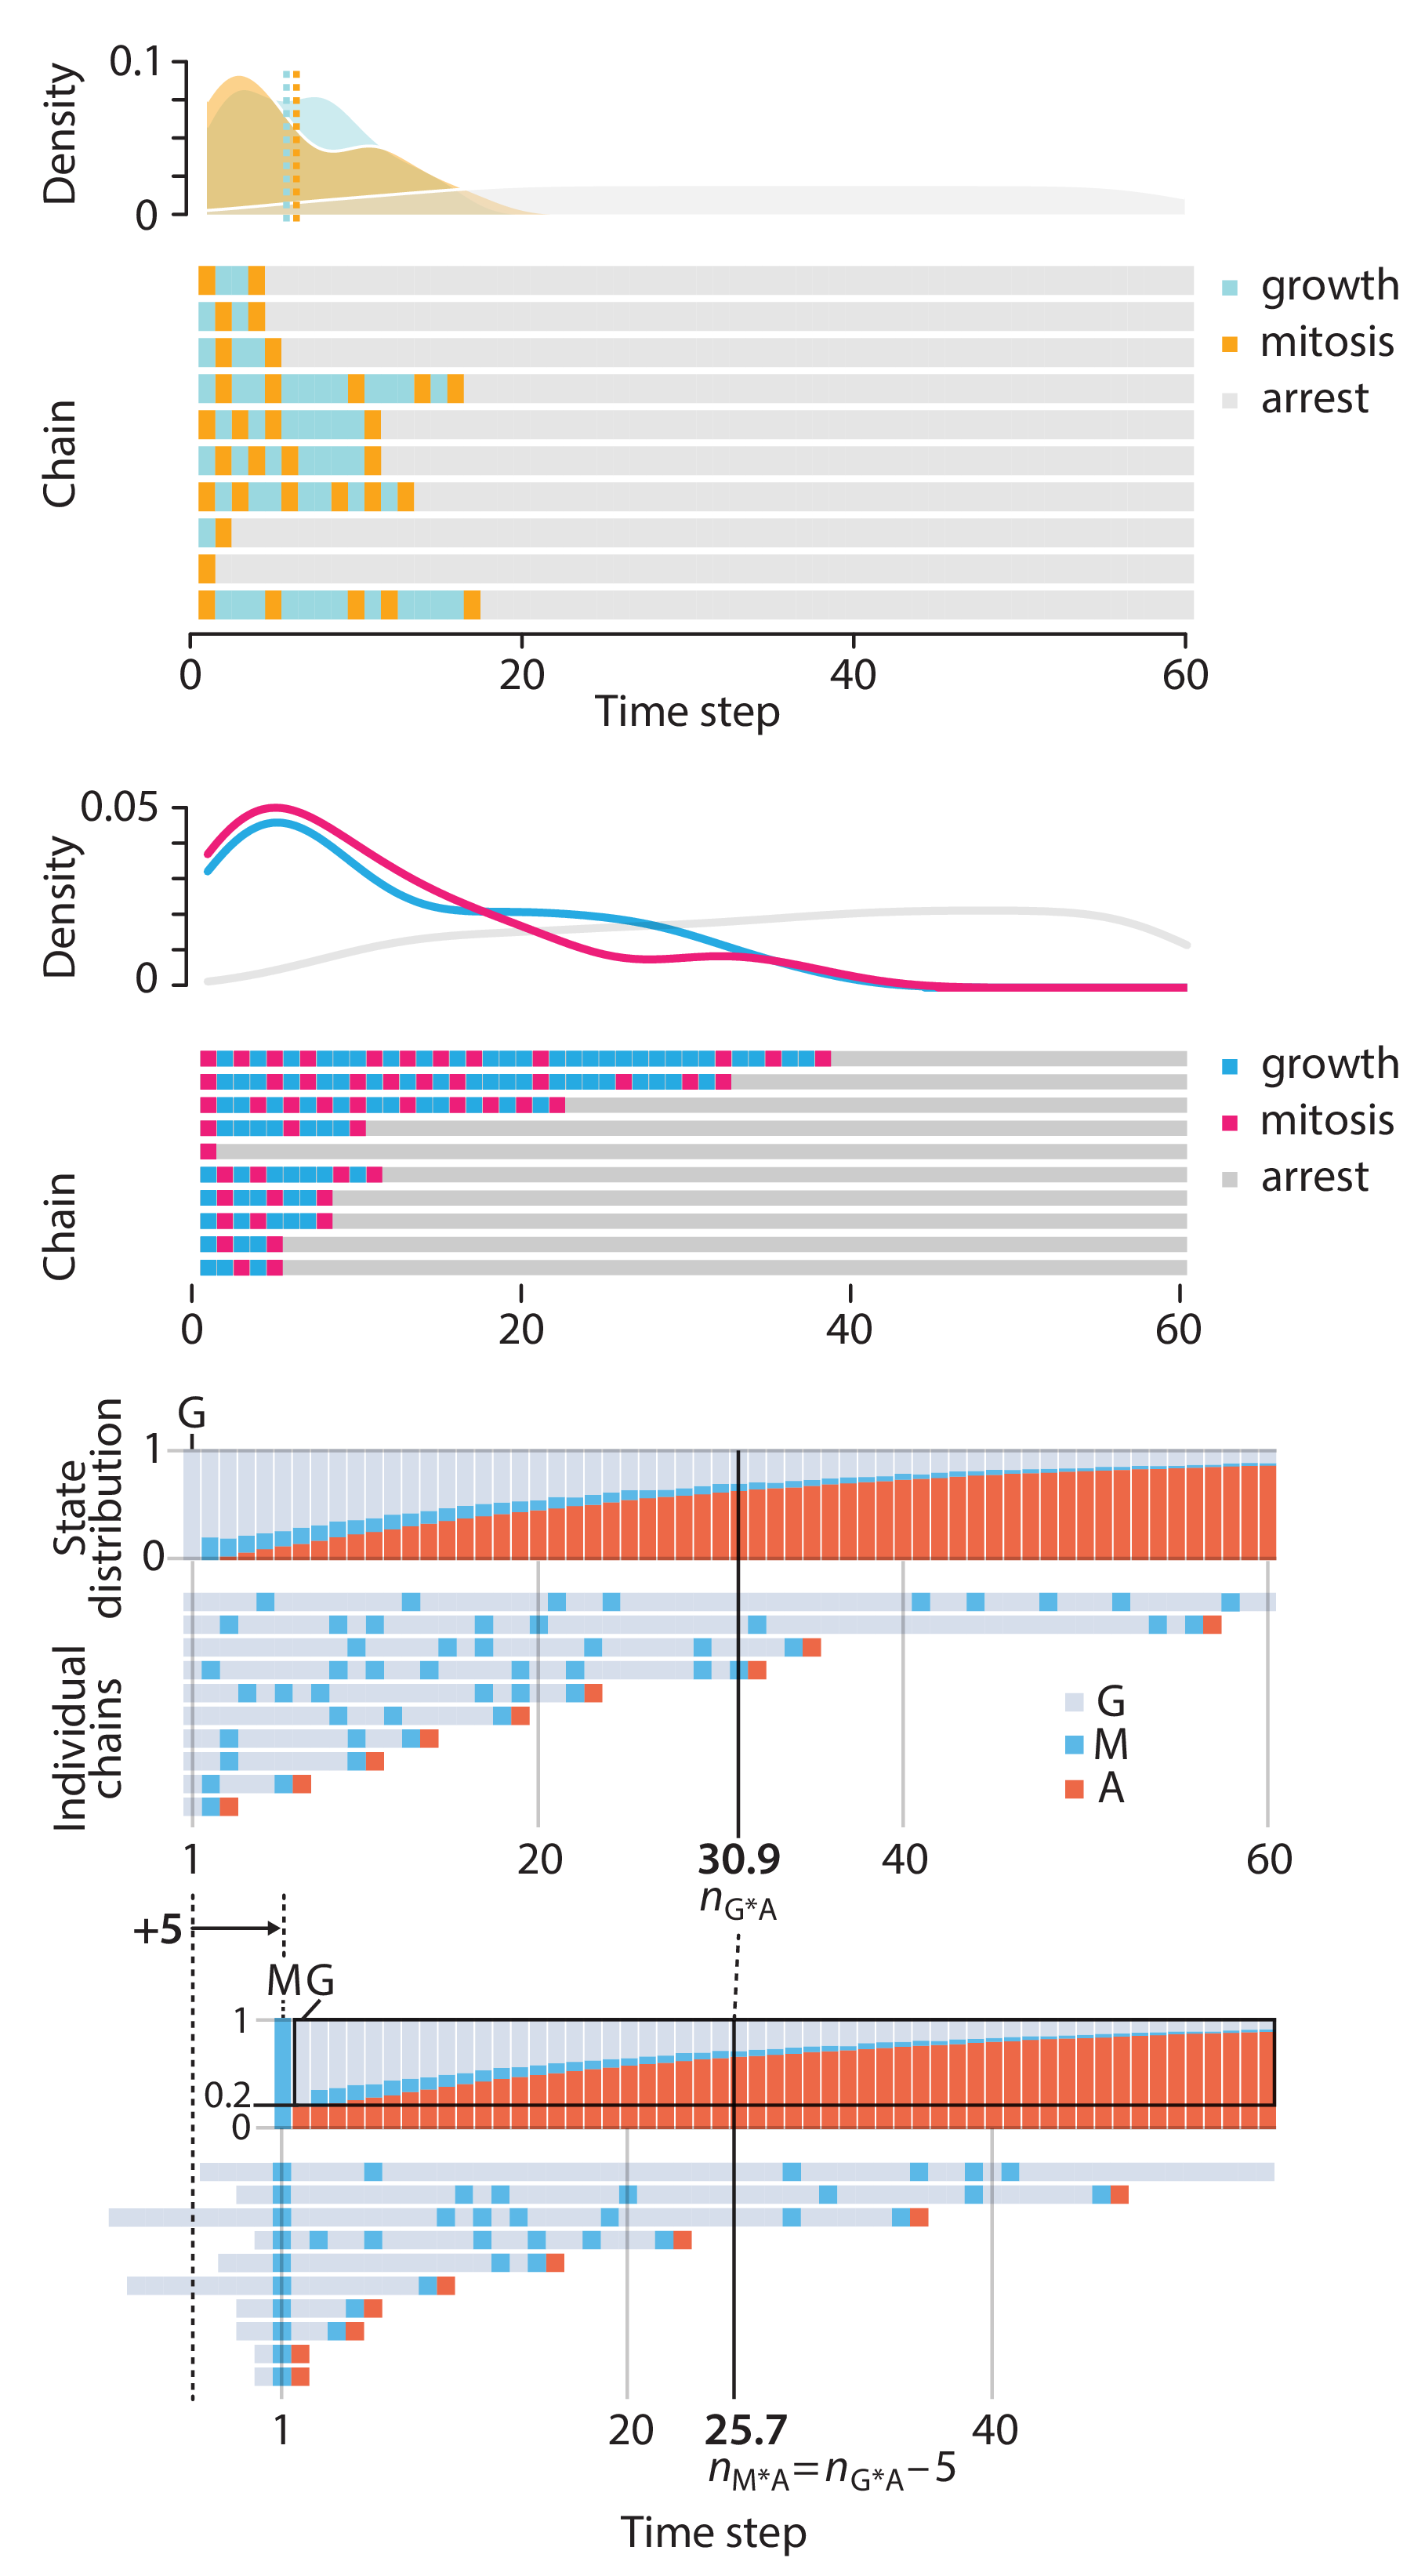
Altman, N. & Krzywinski, M. (2025) Crafting 10 Years of Statistics Explanations: Points of Significance. Annual Review of Statistics and Its Application 12:69–87.
Propensity score matching
I don’t have good luck in the match points. —Rafael Nadal, Spanish tennis player
In many experimental designs, we need to keep in mind the possibility of confounding variables, which may give rise to bias in the estimate of the treatment effect.

If the control and experimental groups aren't matched (or, roughly, similar enough), this bias can arise.
Sometimes this can be dealt with by randomizing, which on average can balance this effect out. When randomization is not possible, propensity score matching is an excellent strategy to match control and experimental groups.
Kurz, C.F., Krzywinski, M. & Altman, N. (2024) Points of significance: Propensity score matching. Nat. Methods 21:1770–1772.
Understanding p-values and significance
P-values combined with estimates of effect size are used to assess the importance of experimental results. However, their interpretation can be invalidated by selection bias when testing multiple hypotheses, fitting multiple models or even informally selecting results that seem interesting after observing the data.
We offer an introduction to principled uses of p-values (targeted at the non-specialist) and identify questionable practices to be avoided.
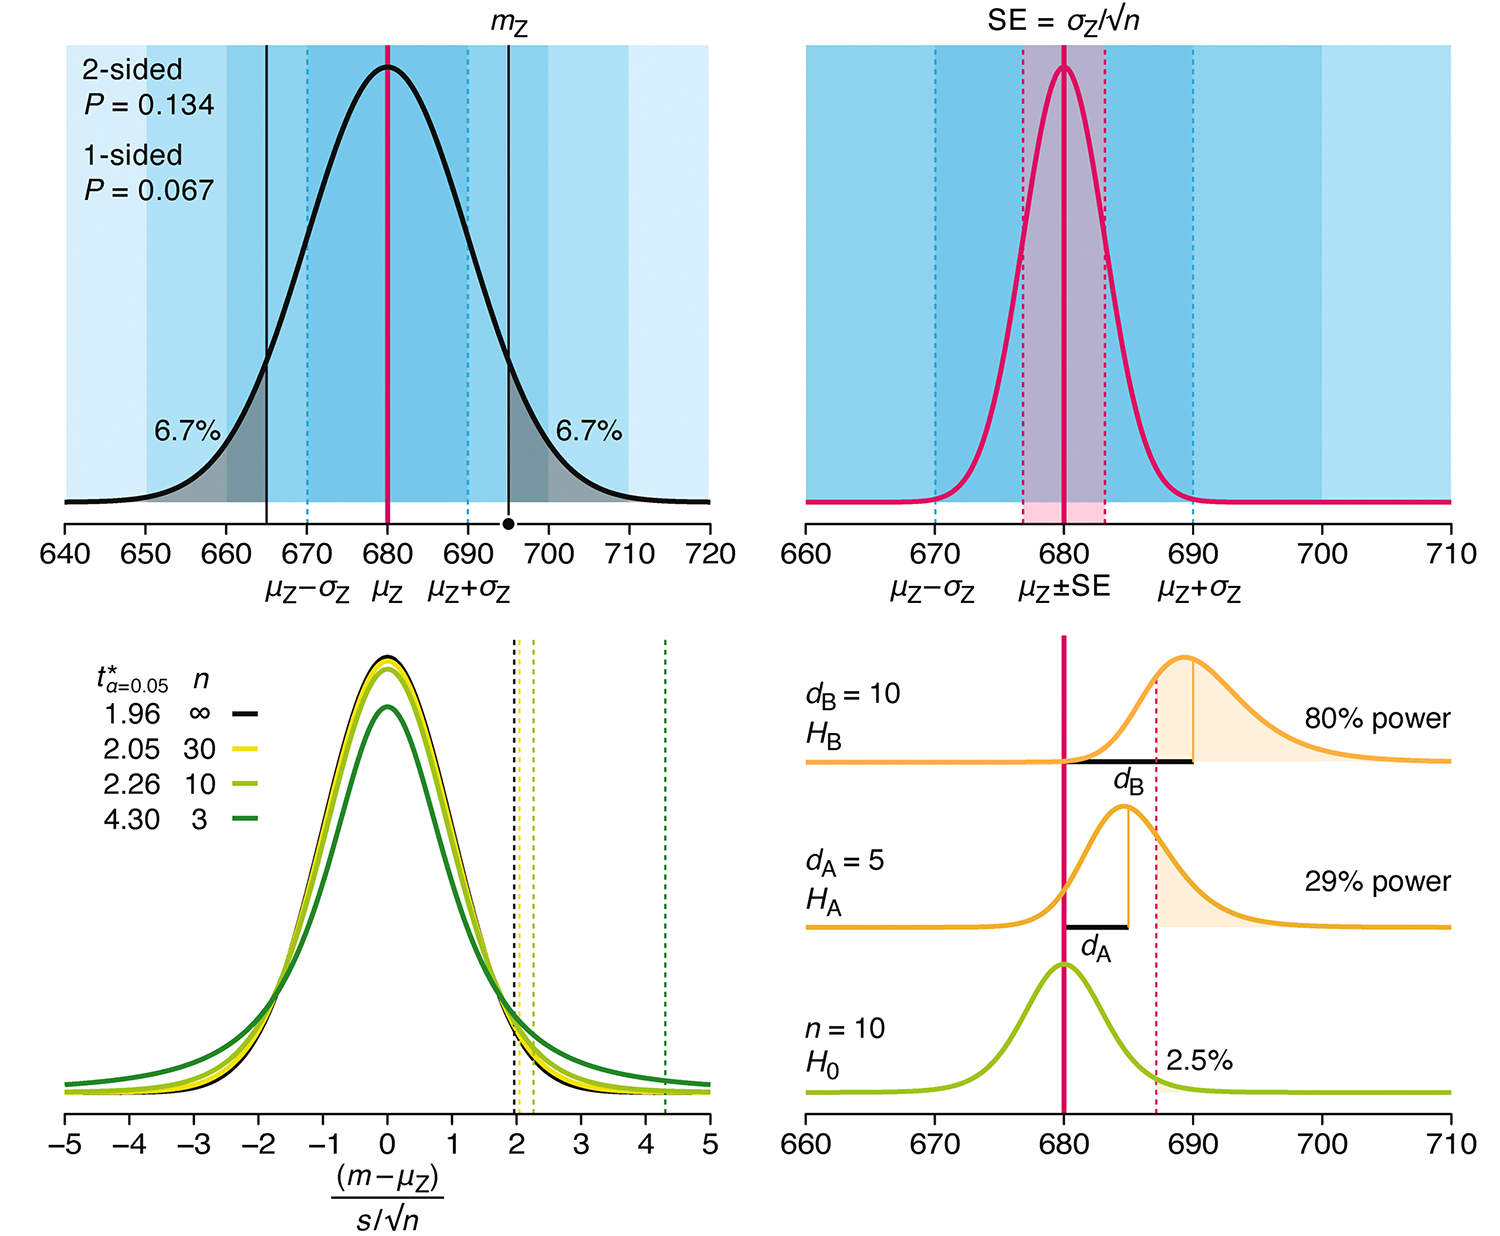
Altman, N. & Krzywinski, M. (2024) Understanding p-values and significance. Laboratory Animals 58:443–446.
Depicting variability and uncertainty using intervals and error bars
Variability is inherent in most biological systems due to differences among members of the population. Two types of variation are commonly observed in studies: differences among samples and the “error” in estimating a population parameter (e.g. mean) from a sample. While these concepts are fundamentally very different, the associated variation is often expressed using similar notation—an interval that represents a range of values with a lower and upper bound.
In this article we discuss how common intervals are used (and misused).
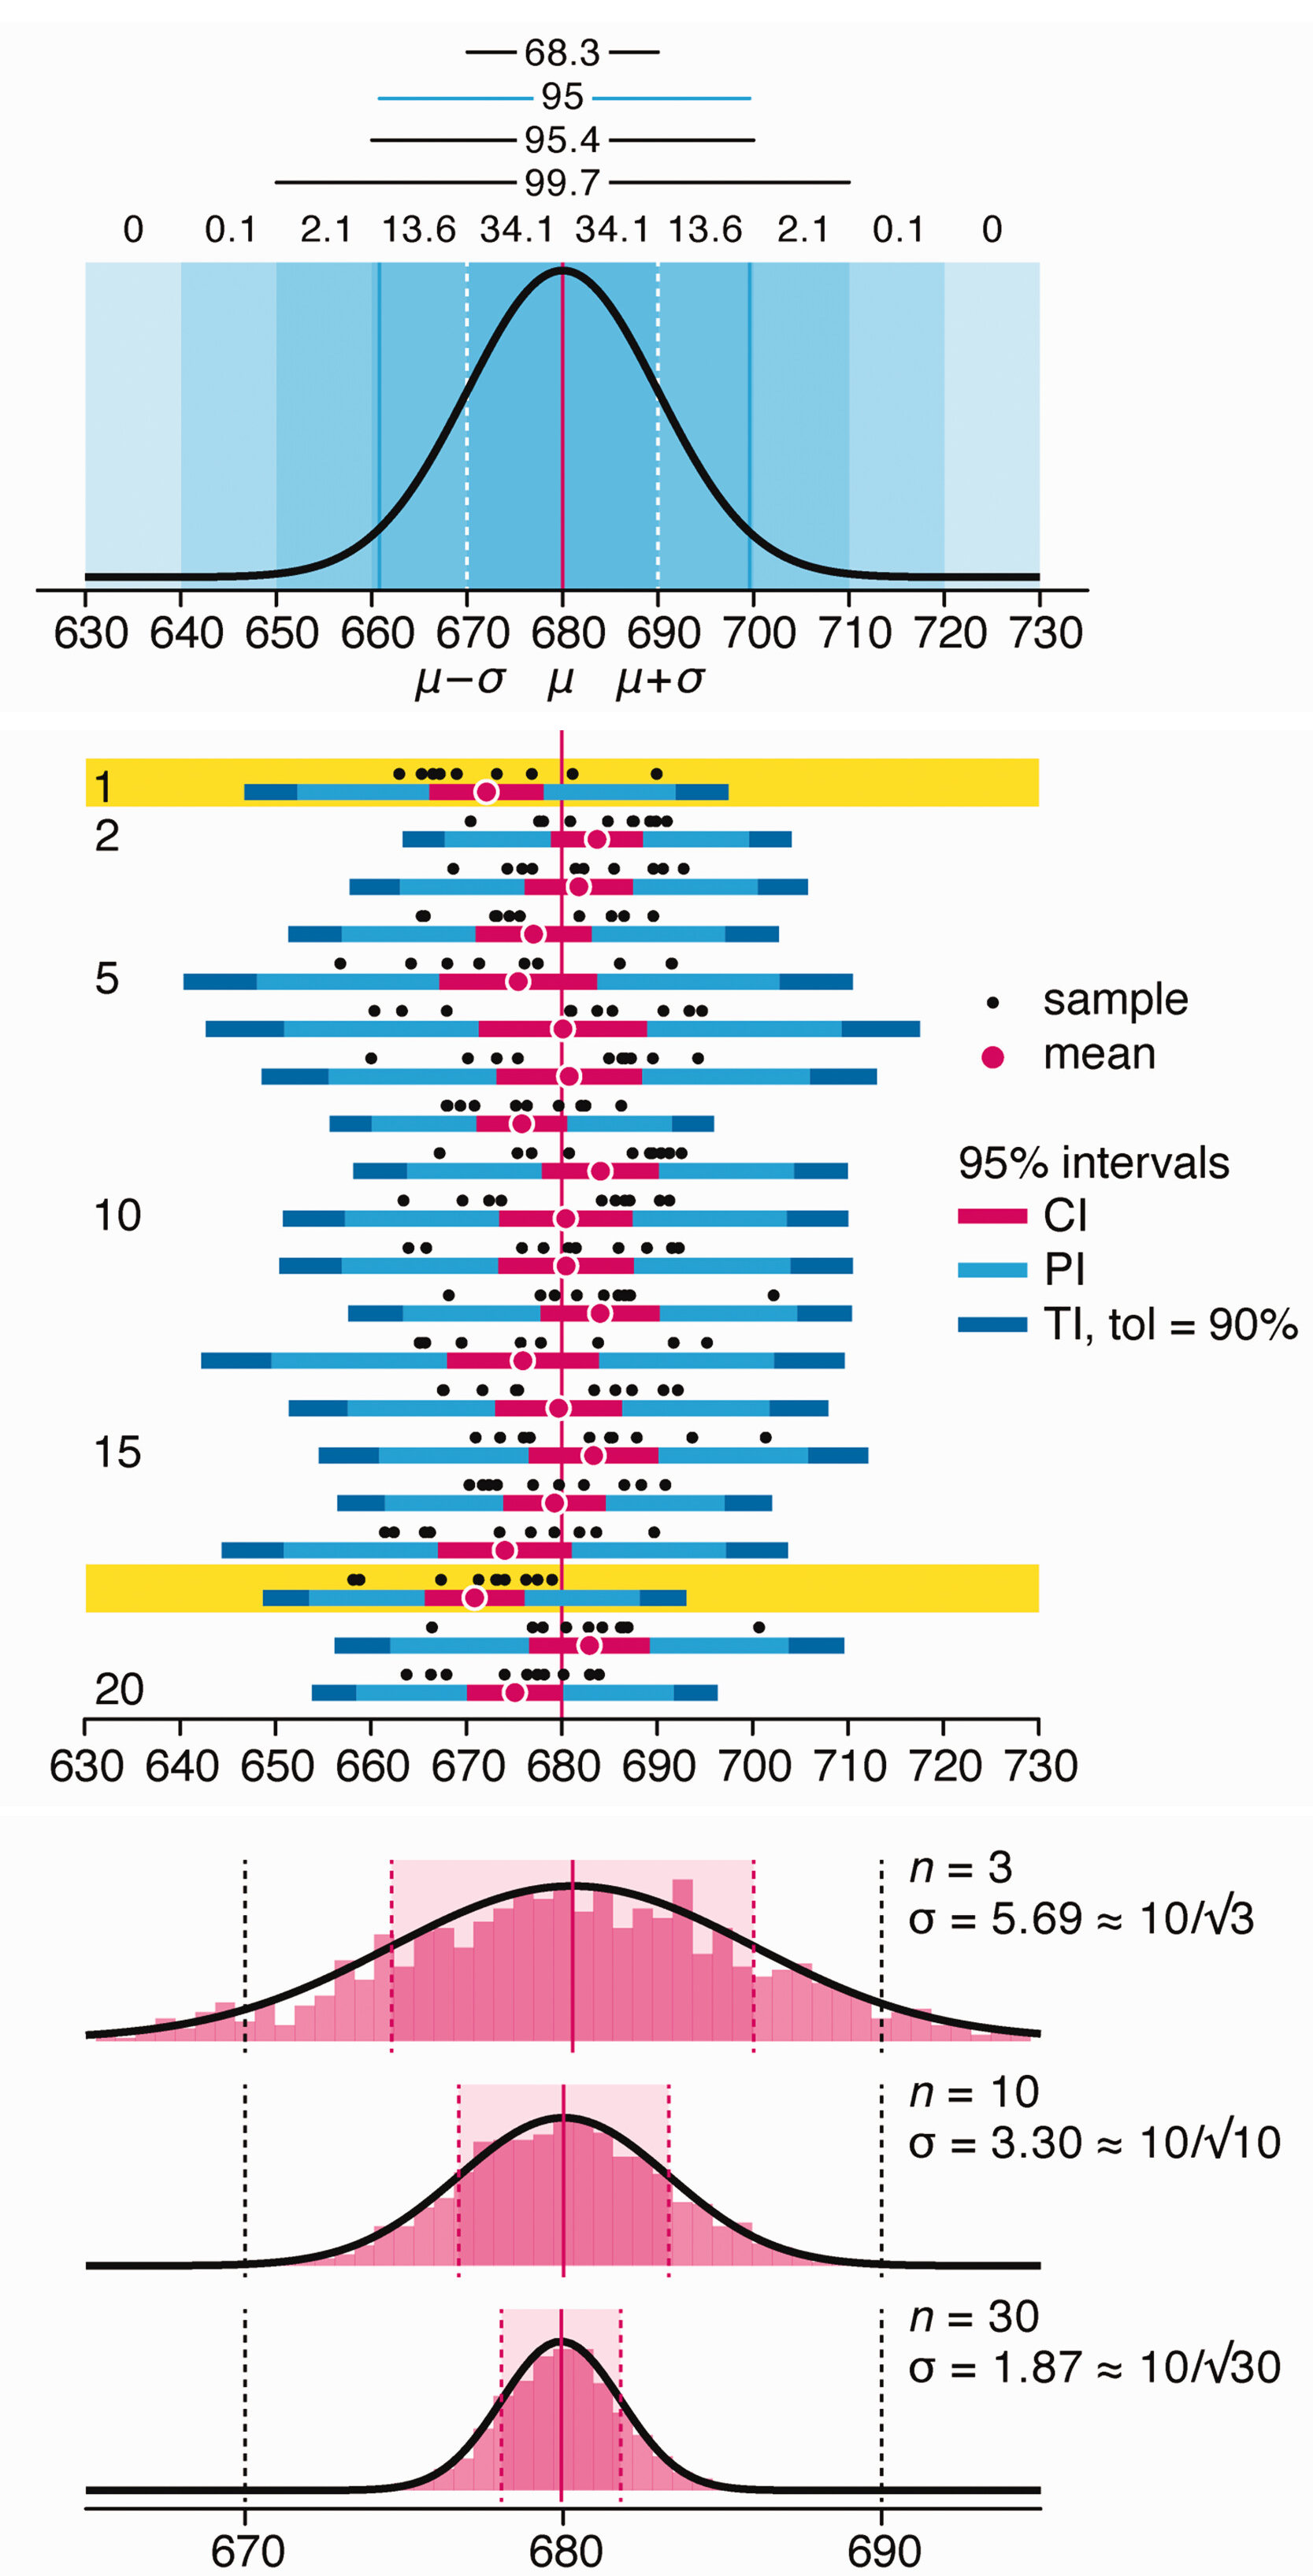
Altman, N. & Krzywinski, M. (2024) Depicting variability and uncertainty using intervals and error bars. Laboratory Animals 58:453–456.


