


The trees along this city street,
Save for the traffic and the trains,
Would make a sound as thin and sweet
As trees in country lanes.
And people standing in their shade
Out of a shower, undoubtedly
Would hear such music as is made
Upon a country tree.
Oh, little leaves that are so dumb
Against the shrieking city air,
I watch you when the wind has come,—
I know what sound is there.
— Edna St. Vincent Millay
Nature Biotechnology Cover
11 April 2022, Issue 40, Volume 4
Konno, N. et al. Deep distributed computing to reconstruct extremely large lineage trees (2022) Nature Biotechnology 40:566–575.

The cover design accompanies the paper by Konno et al., which presents a highly efficient distributed computing method for the reconstruction of evolutionary trees from very large datasets.
The cover is a rearrangement of the very large phylogenetic data set depicted in Figure 2a in the paper. You can browse this data set using the HiView server.

The source of inspiration for the cover design came from previous work, where I drew trees from data.
I receive email. One day, I received this one.
I am a Norwegian biology student that has recently become a huge fan of your data art! It's beautiful, really!
What I wanted to ask you, if it's possible for you to help me a little bit on the way of a project I'm starting.
I have had the pleasure of working with a PhD-student here at the university in Bergen, she has taught me so much, and given me a lot of experience in the field, as well as opened up some big career "doors" for me.
She is supposed to deliver her PhD in November and I want to give here a gift to say thank you for all she has done for me.
My idea is this: some sort of visualization of the data she is using in here PhD. She is studying plant communities in Norway, and I have access to the data (plant heights, carbon in the air, thickness of leafs, number of individuals and so on), but i'm not sure how I can make it look beautiful.
So to clarify, I'm not looking for a diagram that is useful or anything, but just pretty to look at, and that is a memory of all the data she has collected, and worked with for the last 4 years. Maybe a diagram in different colors, depending on what the value is, in just a random order... or something...
So do you have any idea of how I can do this? What program do you use when you make your diagrams?
Understand if you dont have the time to answer this, but thank you anyway for reading, and for all you have created!
—Ruben Thormodsæter
I love Norway and I love people that love people who love science.
Since the dataset was a list of 376 individual plants, each annotated with species/genus and growth parameters such as height, mass and so on, and Ruben wanted something that is “not ... useful or anything” but rather “pretty to look at” based on “all the data she has collected and worked with for the last 4 years”.
I thought it would be both useful and pretty to represent the plant data by ... growing trees — in silico. One way to do this is to use an L-system.
So, here's the data
id,year,site,genus,species,height,mass,thick,plot,drought,plotmass,green
AA86T,2019,Lygra,Erica,tetralix,27,0.02115,0.166,1.3,0,,0.675
AA96C,2019,Lygra,Agrostis,capillaris,9,0.01477,0.107,3.3,90,186.39,0.7025
AA99C,2019,Lygra,Pedicularis,sylvatica,4,0.01806,0.064,2.3,50,80.92,0.695625
AB12C,2019,Lygra,Avenella,flexuosa,6.5,0.03173,0.154,3.3,90,186.39,0.7025
AB17C,2019,Lygra,Carex,pilulifera,10,0.04504,0.154,2.3,50,80.92,0.695625
AB30O,2019,Lygra,Vaccinium,myrtillus,9,0.02605,0.116,2.1,0,111.11,0.636875
...
and here's the final poster.


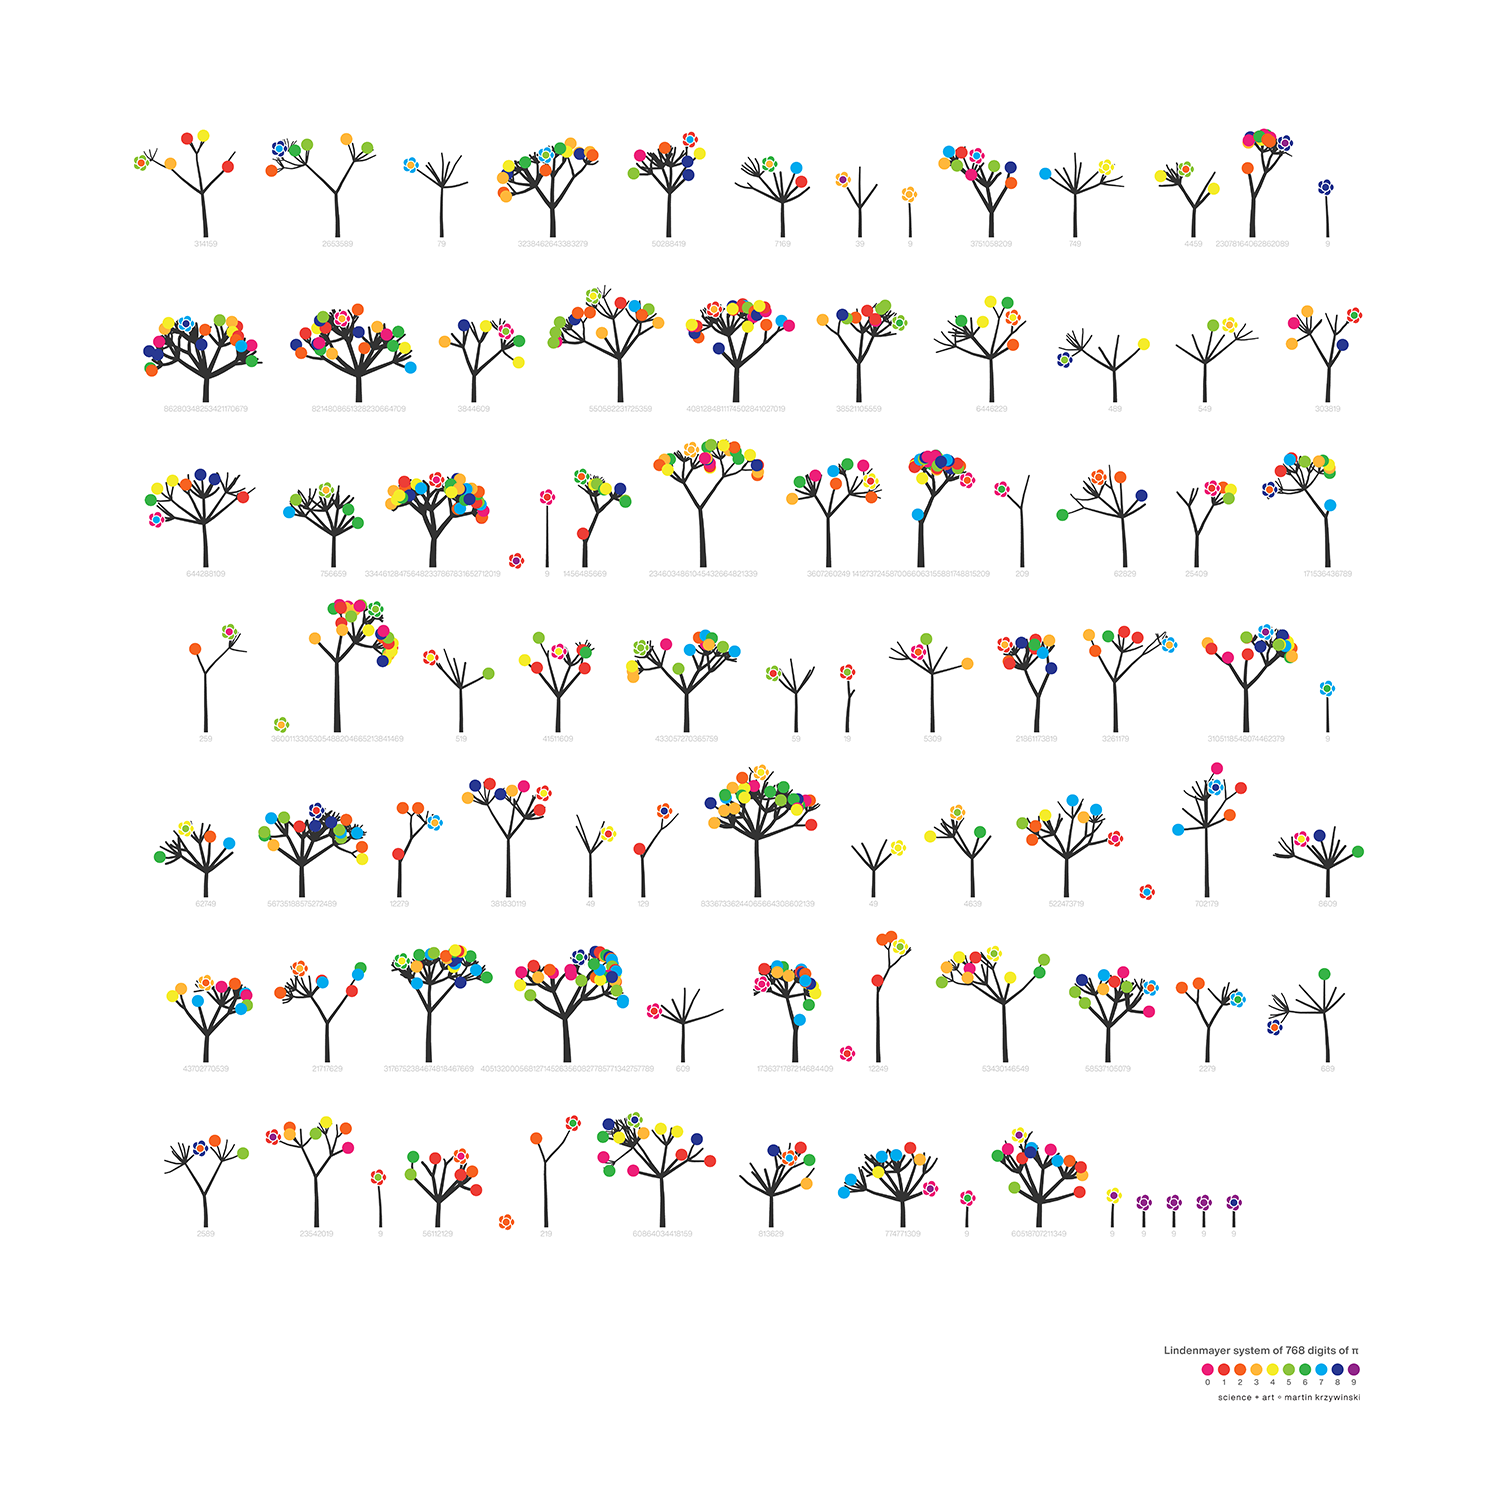
I had such a great time with the L-systems that when Pi Day came around, I grew more trees. This time, using the digits of `\pi` to inform branching and sprouting.
So, for 2021 Pi Day, I tried to see the forest through the digits.
Browse my gallery of cover designs.

Propensity score weighting
It is not certain that everything is uncertain. —Blaise Pascal
We have already explored how we can mitigate bias caused by confounding variables in observational studies using propensity score (PS) matching (PSM) and propensity score weighting (PSW). However, any statistical model is only as good as its assumptions and, if it is specified incorrectly, it can itself produce biased estimates of the treatment effect.

This month, we explore double robustness, a powerful statistical concept that provides a valuable “safety net” against the risk of an incorrect model. It offers two opportunities, instead of just one, to obtain a valid estimate of the treatment effect — making it possible to draw credible causal inferences from observational data without having to depend on a single set of modeling assumptions.
Kurz, C.F., Krzywinski, M. & Altman, N. (2026) Points of significance: Double Robustness. Nat. Methods 23:868–869.
Nature Biotechnology cover
My cover design on the 7 April 2026 Nature Biotechnology issue shows the dendrogram that represents a cluster of uniquely expressed (or downregulated) genes in human naive stem cells induced from such cells. Within each dendrogram block, the genomic barcode sequence (sampled from Supplementary Table 1) is depicted with a Code 39 barcode. The highlighted barcode is one of those used for cell isolation.
Ishiguro S. et al. A multi-kingdom genetic barcoding system for precise clone isolation (2026) Nature Biotechnology 44:616–629.

Browse my gallery of cover designs.

Happy 2026 π Day—
Art for the 5%
Celebrate π Day (March 14th) and enjoy the art — but only if you're part of the 5%.
Go ahead, see what you can't see.

Ishihara's Tests for Colour Deficiency
Authentic and accurate images of Ishihara's test plates photographed (and lovingly color-corrected) from the 38-plate Ishihara's Tests for Colour Deficiency.
I also provide the position, size, and color of each circle on each test plate.


Symmetric alternatives to the ordinary least squares regression
What immortal hand or eye, could frame thy fearful symmetry? — William Blake, "The Tyger"
This month, we look at symmetric regression, which, unlike simple linear regression, it is reversible — remaining unaltered when the variables are swapped.
Simple linear regression can summarize the linear relationship between two variables `X` and `Y` — for example, when `Y` is considered the response (dependent) and `X` the predictor (independent) variable.
However, there are times when we are not interested (or able) to distinguish between dependent and independent variables — either because they have the same importance or the same role. This is where symmetric regression can help.

Luca Greco, George Luta, Martin Krzywinski & Naomi Altman (2025) Points of significance: Symmetric alternatives to the ordinary least squares regression. Nat. Methods 22:1610–1612.