Ishihara's Tests for Colour Deficiency
Authentic and accurate images of Ishihara's test plates
Just because it's black in the dark,
Oh, doesn't mean there's no colors.
— Laleh (Colors)
Authentic and color-accurate images of Ishihara's test plates for colour deficiency.
I provide high-resolution bitmaps and SVG files for each plate. I also provide the position, size, and color of each circle on each test plate.
Can this information be used to make fakes? Yes, but at least they'll be really good ones. Also, please don't.
If you're interested to learn more about colorblindess and the mathematics behind it, see my Designing for Color Blindness, Palettes for Color Blindness and Math of Color Blindness.
And turn those lines of confusion into understanding!
contents
Photos and text of the manual from my 2020 38-plate book. Minimally reformatted. Plate number ranges appear as N~M and shown here as N–M.
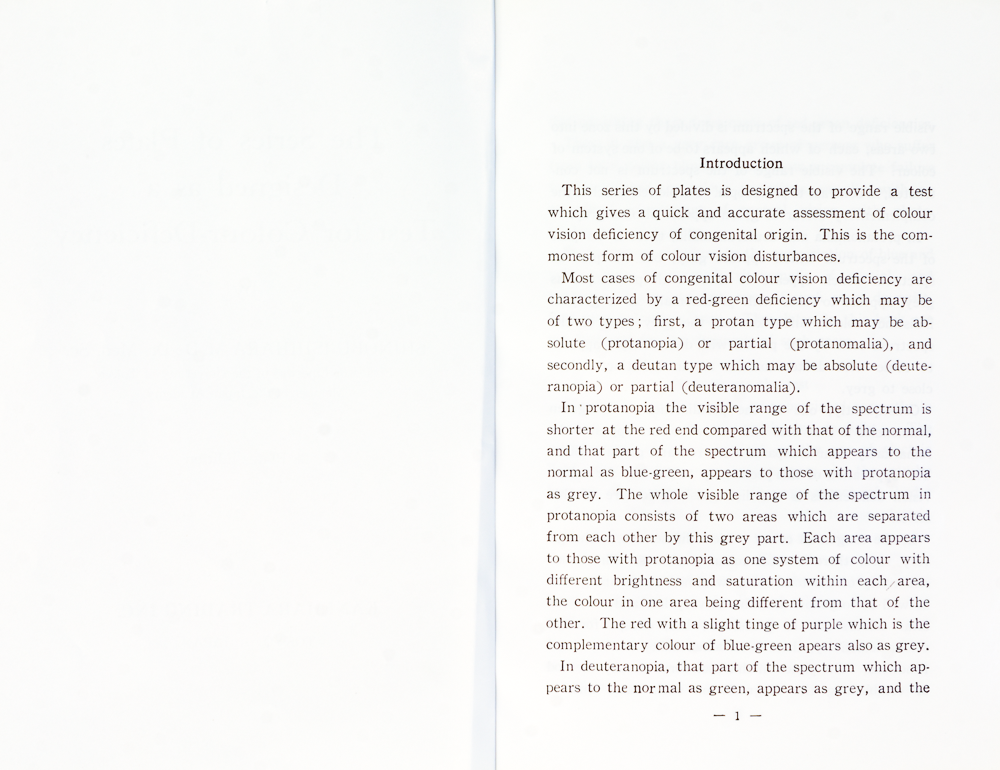
This series of plates is designed to provide a test which gives a quick and accurate assessment of colour vision deficiency of congenital origin. This is the commonest form of colour vision disturbances.
Most cases of congenital colour vision deficiency are characterized by a red-green deficiency which may be of two types; first, a protan type which may be absolute (protanopia) or partial (protanomalia), and secondly, a deutan type which may be absolute (deuteranopia) or partial (deuteranomalía).
In protanopia the visible range of the spectrum is shorter at the red end compared with that of the normal, and that part of the spectrum which appears to the normal as blue-green, appears to those with protanopia as grey. The whole visible range of the spectrum in protanopia consists of two areas which are separated from each other by this grey part. Each area appears to those with protanopia as one system of colour with different brightness and saturation within each area, the colour in one area being different from that of the other. The red with a slight tinge of purple which is the complementary colour of blue-green appears also as grey.
In deuteranopia, that part of the spectrum which appears to the normal as green, appears as grey, and the visible range of the spectrum is divided by this zone into two areas, each of which appears to be of one system of colour. The visible range of the spectrum is not contracted, in contrast to protanopia. Purple-red which is the complementary colour of green appears also as grey.
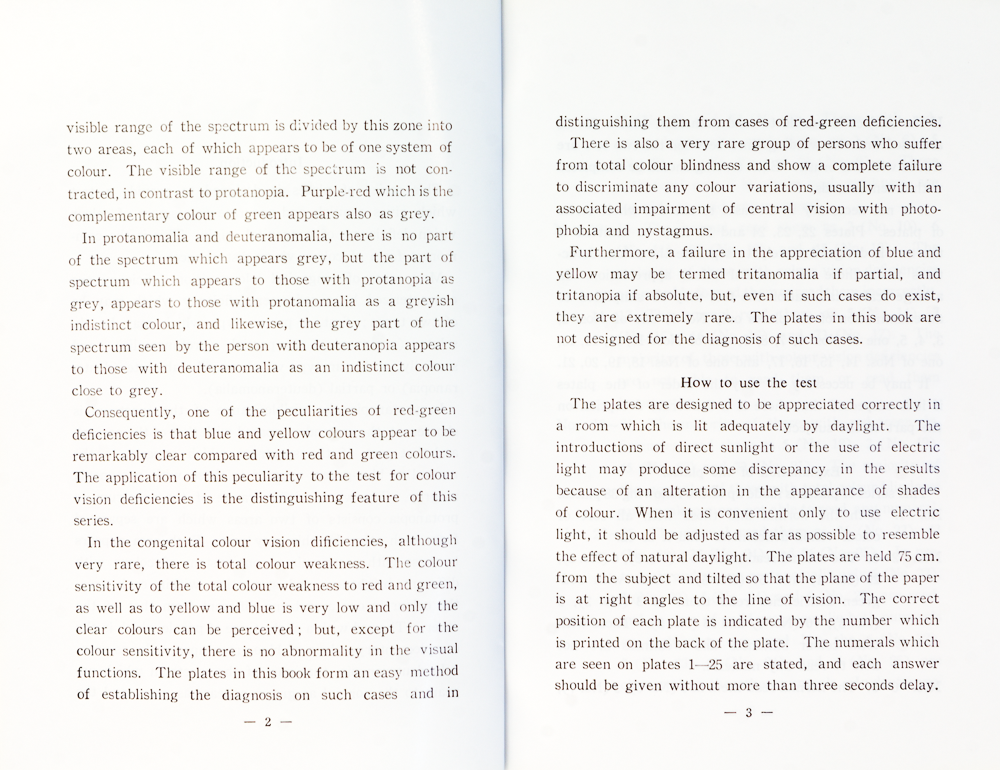
In protanomalía and deuteranomalia, there is no part of the spectrum which appears grey, but the part of the spectrum which appears to those with protanopia as grey, appears to those with protanomalía as a greyish indistinct colour, and likewise, the grey part of the spectrum seen by the person with deuteranopia appears to those with deuteranomalia as an indistinct colour close to grey.
Consequently, one of the peculiarities of red-green deficiencies is that blue and yellow colours appear to be remarkably clear compared with red and green colours. The application of this peculiarity to the test for colour vision deficiencies is the distinguishing feature of this series.
In the congenital colour vision deficiencies, although very rare, there is total colour weakness. The colour sensitivity of the total colour weakness to red and green, as well as to yellow and blue is very low and only the clear colours can be perceived; but, except for the colour sensitivity, there is no abnormality in the visual functions. The plates in this book form an easy method of establishing the diagnosis on such cases and in distinguishing them from cases of red-green deficiencies. There is also a very rare group of persons who suffer from total colour blindness and show a complete failure to discriminate any colour variations, usually with an associated impairment of central vision with photophobia and nystagmus.
Furthermore, a failure in the appreciation of blue and yellow may be termed tritanomalia if partial, and tritanopia if absolute, but, even if such cases do exist, they are extremely rare. The plates in this book are not designed for the diagnosis of such cases.
The plates are designed to be appreciated correctly in a room which is lit adequately by daylight. The introduction of direct sunlight or the use of electric light may produce some discrepancy in the results because of an alteration in the appearance of shades of colour. When it is convenient only to use electric light, it should be adjusted as far as possible to resemble the effect of natural daylight. The plates are held 75 cm. from the subject and tilted so that the plane of the paper is at right angles to the line of vision. The correct position of each plate is indicated by the number which is printed on the back of the plate. The numerals which are seen on plates 1–25 are stated, and each answer should be given without more than three seconds delay.
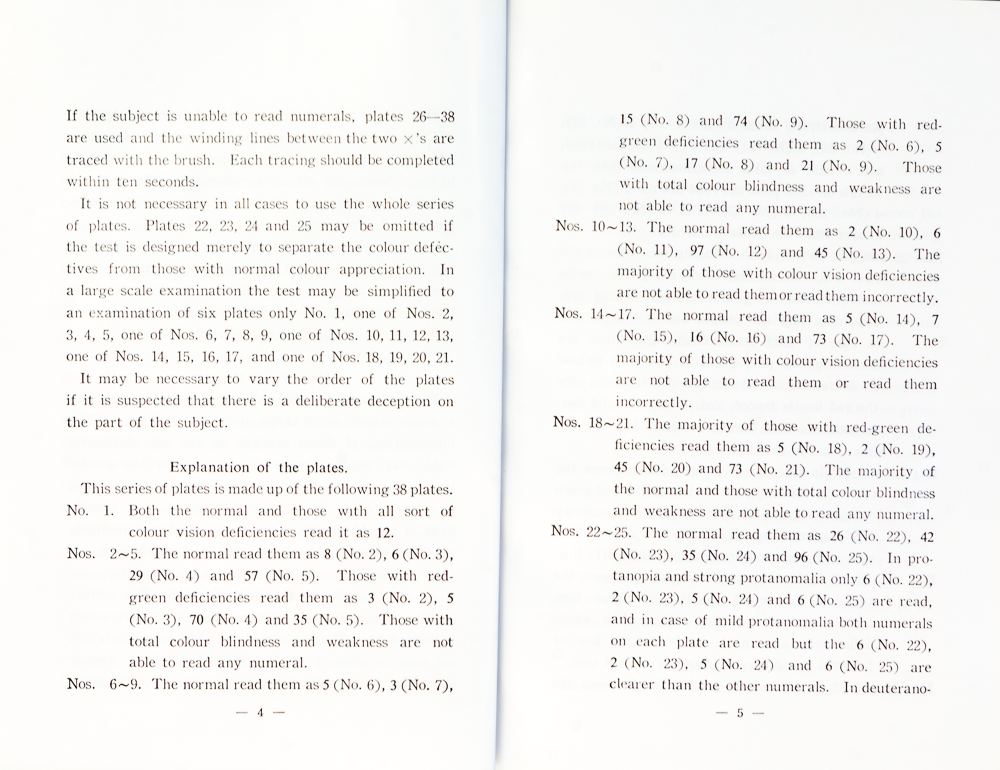
If the subject is unable to read numerals, plates 26—38 are used and the winding lines between the two X’s are traced with the brush. Each tracing should be completed within ten seconds.
It is not necessary in all cases to use the whole series of plates. Plates 22, 23, 24 and 25 may be omitted if the test is designed merely to separate the colour defectives from those with normal colour appreciation. In a large scale examination the test may be simplified to an examination of six plates only Nos. 1, one of Nos. 2, 3, 4, 5, one of Nos. 6, 7, 8, 9, one of Nos. 10, 11, 12, 13, one of Nos. 14, 15, 16, 17, and one of Nos. 18, 19, 20, 21.
It may be necessary to vary the order of the plates if it is suspected that there is a deliberate deception on the part of the subject.
This series of plates is made up of the following 38 plates.
No. 1. Both the normal and those with all sort of colour vision deficiencies read it as 12.
Nos. 2–5. The normal read them as 8 (No. 2), 6 (No. 3), 29 (No. 4) and 57 (No. 5). Those with red-green deficiencies read them as 3 (No. 2), 5 (No. 3), 70 (No. 4) and 35 (No. 5). Those with total colour blindness and weakness are not able to read any numeral.
Nos. 6–9. The normal read them as 5 (No. 6), 3 (No. 7), 15 (No. 8) and 74 (No. 9). Those with red-green deficiencies read them as 2 (No. 6), 5 (No. 7), 17 (No. 8) and 21 (No. 9). Those with total colour blindness and weakness are not able to read any numeral.
Nos. 10–13. The normal read them as 2 (No. 10), 6 (No. 11), 97 (No. 12) and 45 (No. 13). The majority of those with colour vision deficiencies are not able to read them or read them incorrectly.
Nos. 14–17. The normal read them as 5 (No. 14), 7 (No. 15), 16 (No. 16) and 73 (No. 17). The majority of those with colour vision deficiencies are not able to read them or read them incorrectly.
Nos. 18–21. The majority of those with red-green deficiencies read them as 5 (No. 18), 2 (No. 19), 45 (No. 20) and 73 (No. 21). The majority of the normal and those with total colour blindness and weakness are not able to read any numeral.
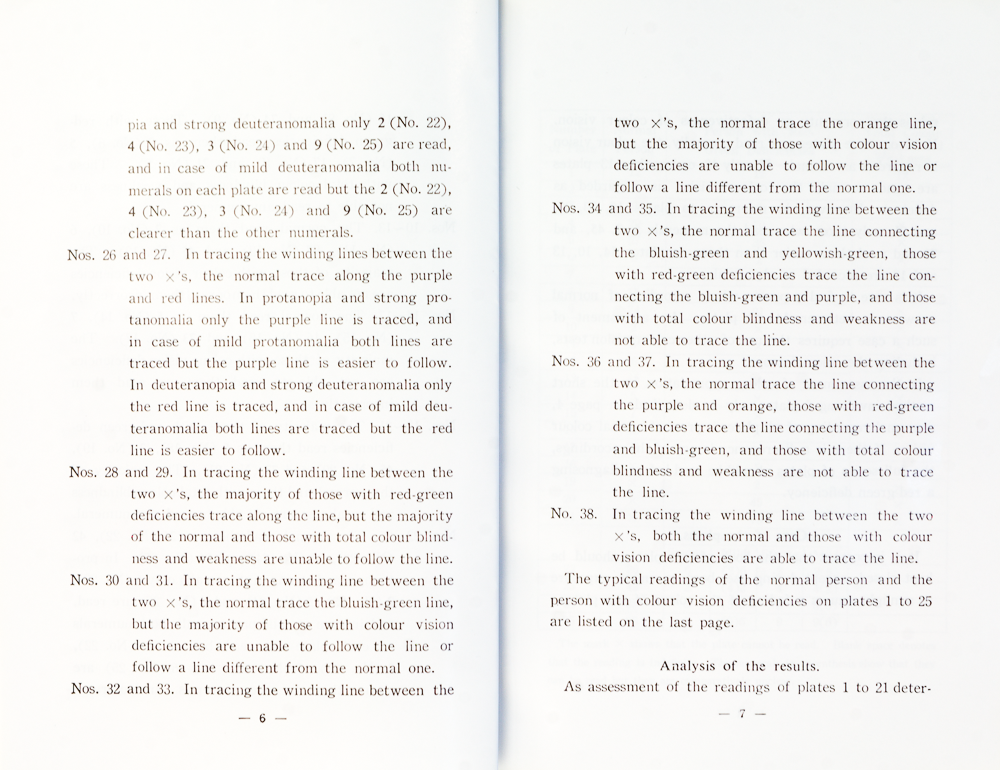
Nos. 22–25. The normal read them as 26 (No. 22), 42 (No. 23), 35 (No. 24) and 96 (No. 25). In protanopia and strong protanomalía only 6 (No. 22), 2 (No. 23), 5 (No. 24) and 6 (No. 25) are read and in case of mild protanomalía both numerals on each plate are read but the 6 (No. 22), 2 (No. 23), 5 (No. 24) and 6 (No. 25) are clearer than the other numerals. In deuteranopia and strong deuteranomalia only 2 (No. 22), 4 (No. 23), 3 (No. 24) and 9 (No. 25) are read, and in case of mild deuteranomalia both numerals on each plate are read but the 2 (No. 22), 4 (No. 23), 3 (No. 24) and 9 (No. 25) are clearer than the other numerals.
Nos. 26 and 27. In tracing the winding lines between the two X’s, the normal trace along the purple and red lines. In protanopia and strong protanomalia only the purple line is traced, and in case of mild protanomalia both lines are traced but the purple line is easier to follow. In deuteranopia and strong deuteranomalia only the red line is traced, and in case of mild deuteranomalia both lines are traced but the red line is easier to follow.
Nos. 28 and 29. In tracing the winding line between the two X’s, the majority of those with red-green deficiencies trace along the line, but the majority of the normal and those with total colour blindness and weakness are unable to follow the line.
Nos. 30 and 31. In tracing the winding line between the two X’s, the normal trace the bluish-green line, but the majority of those with colour vision deficiencies are unable to follow the line or follow a line different from the normal one.
Nos. 32 and 33. In tracing the winding line between the two X’s, the normal trace the orange line, two X’s, the normal trace the orange line, but the majority of those with colour vision deficiencies are unable to follow the line or follow a line different from the normal one.
Nos. 34 and 35. In tracing the winding line between the two X’s, the normal trace the line connecting the bluish-green and yellowish-green, those with red-green deficiencies trace the line connecting the bluish-green and purple, and those with total colour blindness and weakness are not able to trace the line.
Nos. 36 and 37. In tracing the winding line between the two X’s, the normal trace the line connecting the purple and orange, those with red-green deficiencies trace the line connecting the purple and bluish-green, and those with total colour blindness and weakness are not able to trace the line.
No. 38. In tracing the winding line between the two X’s, both the normal and those with colour vision deficiencies are able to trace the line.
The typical readings of the normal person and the person with colour vision deficiencies on plates 1 to 25 are listed on the last page.
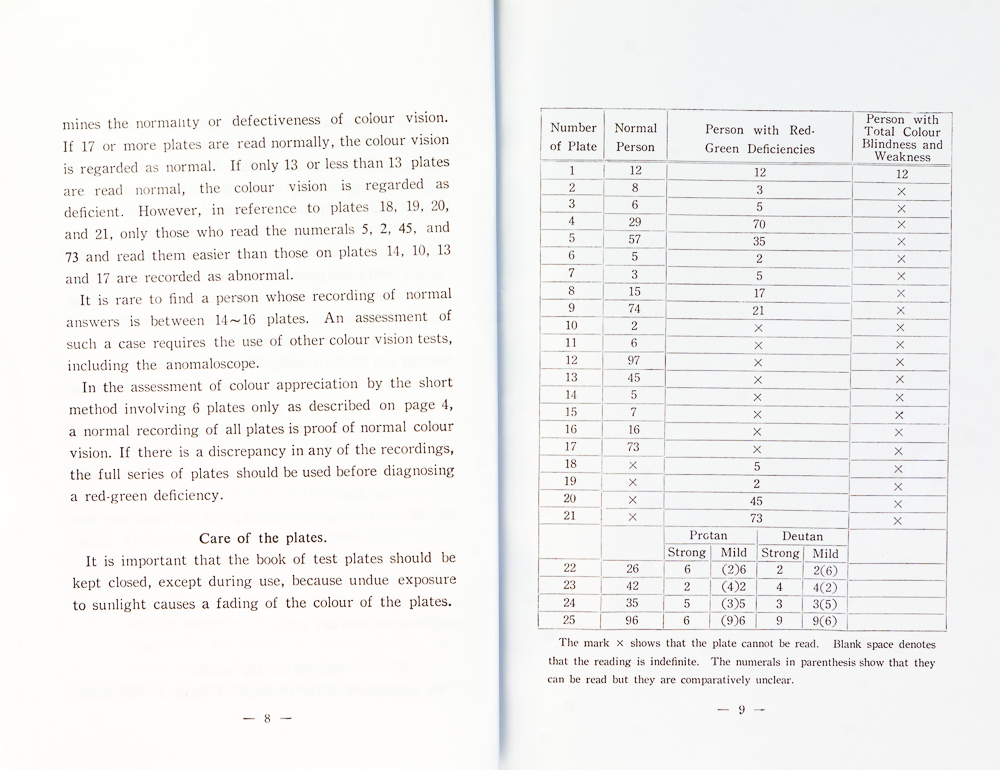
As assessment of the readings of plates 1 to 21 deterines the normality or defectiveness of colour vision.
If 17 or more plates are read normally, the colour vision is regarded as normal. If only 13 or less than 13 plates are read normal, the colour vision is regarded as deficient. However, in reference to plates 18, 19, 20, and 21, only those who read the numerals 5, 2, 45, and 73 and read them easier than those on plates 14, 10, 13 and 17 are recorded as abnormal.
It is rare to find a person whose recording of normal answers is between 14–16 plates. An assessment of such a case requires the use of other colour vision tests, including the anomaloscope.
In the assessment of colour appreciation by the short method involving 6 plates only as described on page 4, a normal recording of all plates is proof of normal colour vision. If there is a discrepancy in any of the recordings, the full series of plates should be used before diagnosing a red-green deficiency.
It is important that the book of test plates should be kept closed, except during use, because undue exposure to sunlight causes a fading of the colour of the plates.
| Number of | Normal | Person with                   | Person with Total Colour |
| Plate     | Person | Red-Green Deficiencies        | Blindness and Weakness   |
| --------- | ------ | ----------------------------- | ------------------------ |
| 1         | 12     | 12                            | 12                       |
| 2         | 8      | 3                             | ×                        |
| 3         | 6      | 5                             | ×                        |
| 4         | 29     | 70                            | ×                        |
| 5         | 57     | 35                            | ×                        |
| 6         | 5      | 2                             | ×                        |
| 7         | 3      | 5                             | ×                        |
| 8         | 15     | 17                            | ×                        |
| 9         | 74     | 21                            | ×                        |
| 10        | 2      | ×                             | ×                        |
| 11        | 6      | ×                             | ×                        |
| 12        | 97     | ×                             | ×                        |
| 13        | 45     | ×                             | ×                        |
| 14        | 5      | ×                             | ×                        |
| 15        | 7      | ×                             | ×                        |
| 16        | 16     | ×                             | ×                        |
| 17        | 73     | ×                             | ×                        |
| 18        | ×      | 5                             | ×                        |
| 19        | ×      | 2                             | ×                        |
| 20        | ×      | 45                            | ×                        |
| 21        | ×      | 73                            | ×                        |
| --------- | ------ | ----------------------------- | ------------------------ |
|           |        |     Protan    |     Deutan    |                          |
|           |        | ------------- | ------------- |                          |
|           |        | Strong | Mild | Strong | Mild |                          |
| --------- | ------ | ------ | ---- | ------ | ---- | ------------------------ |
| 22        | 26     | 6      | (2)6 | 2      | (2)6 |                          |
| 23        | 42     | 2      | (4)2 | 4      | (4)2 |                          |
| 24        | 35     | 5      | (3)5 | 3      | (3)5 |                          |
| 25        | 96     | 6      | (9)6 | 9      | (9)6 |                          |
Note:
The mark × shows that the plate cannot be read.
Blank space denotes that the reading is indefinite.
The numerals in parentheses show that they can be read but they are comparatively unclear.
Nature Biotechnology cover
My cover design on the 7 April 2026 Nature Biotechnology issue shows the dendrogram that represents a cluster of uniquely expressed (or downregulated) genes in human naive stem cells induced from such cells. Within each dendrogram block, the genomic barcode sequence (sampled from Supplementary Table 1) is depicted with a Code 39 barcode. The highlighted barcode is one of those used for cell isolation.
Ishiguro S. et al. A multi-kingdom genetic barcoding system for precise clone isolation (2026) Nature Biotechnology 44:616–629.

Browse my gallery of cover designs.

Happy 2026 π Day—
Art for the 5%
Celebrate π Day (March 14th) and enjoy the art — but only if you're part of the 5%.
Go ahead, see what you can't see.

Ishihara's Tests for Colour Deficiency
Authentic and accurate images of Ishihara's test plates photographed (and lovingly color-corrected) from the 38-plate Ishihara's Tests for Colour Deficiency.
I also provide the position, size, and color of each circle on each test plate.


Symmetric alternatives to the ordinary least squares regression
What immortal hand or eye, could frame thy fearful symmetry? — William Blake, "The Tyger"
This month, we look at symmetric regression, which, unlike simple linear regression, it is reversible — remaining unaltered when the variables are swapped.
Simple linear regression can summarize the linear relationship between two variables `X` and `Y` — for example, when `Y` is considered the response (dependent) and `X` the predictor (independent) variable.
However, there are times when we are not interested (or able) to distinguish between dependent and independent variables — either because they have the same importance or the same role. This is where symmetric regression can help.

Luca Greco, George Luta, Martin Krzywinski & Naomi Altman (2025) Points of significance: Symmetric alternatives to the ordinary least squares regression. Nat. Methods 22:1610–1612.
Beyond Belief Campaign BRCA Art
Fuelled by philanthropy, findings into the workings of BRCA1 and BRCA2 genes have led to groundbreaking research and lifesaving innovations to care for families facing cancer.
This set of 100 one-of-a-kind prints explore the structure of these genes. Each artwork is unique — if you put them all together, you get the full sequence of the BRCA1 and BRCA2 proteins.
