


art + science
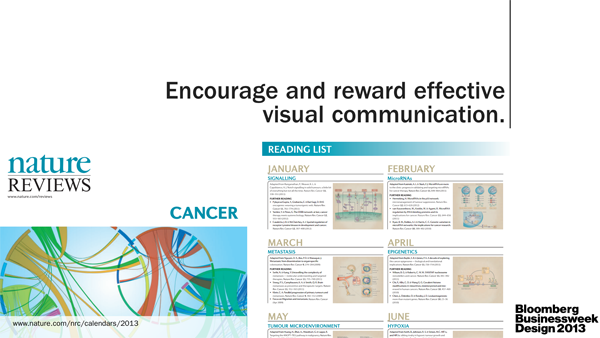
Bloomberg Businessweek Design Conference — San Francisco, 2013
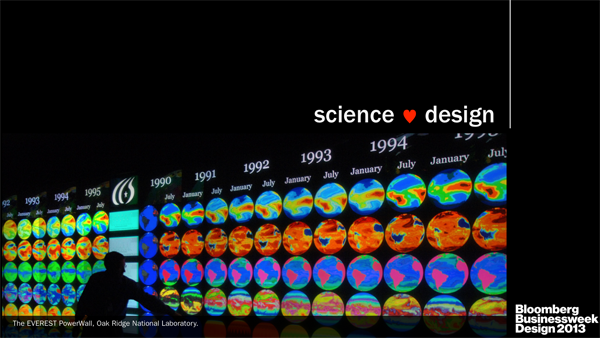
science ♥ design
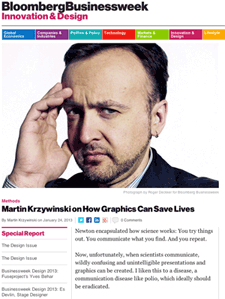
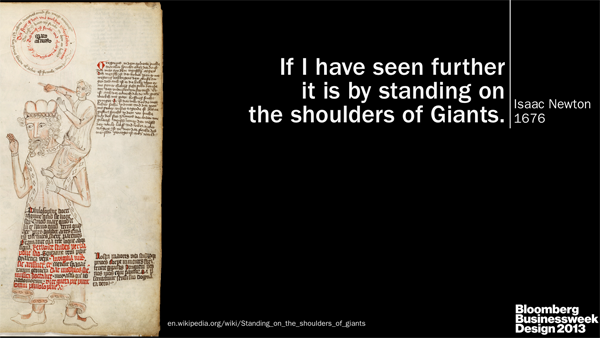
Together with Alberto Cairo, I presented at the Bloomberg Businessweek Design Conference (highlights) on the topic of design and communication in the sciences.
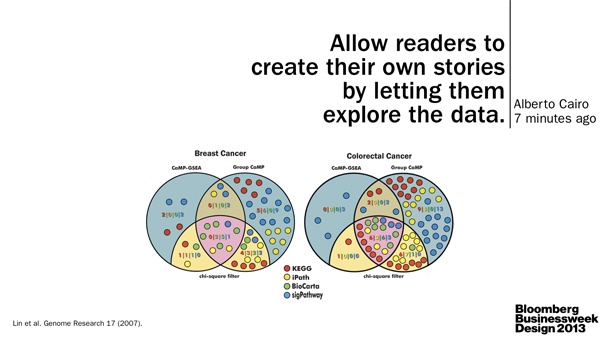
Alberto, as the journalist, motivated why communication should include access to detail through an engaging narrative. He made the distinction between the specialist (heavy on detail) and the communicator (focus on narrative) and emphasized that the distinction is artificial, though often played out (watch video).
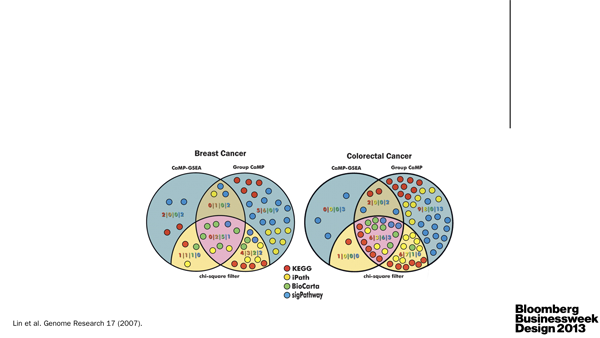
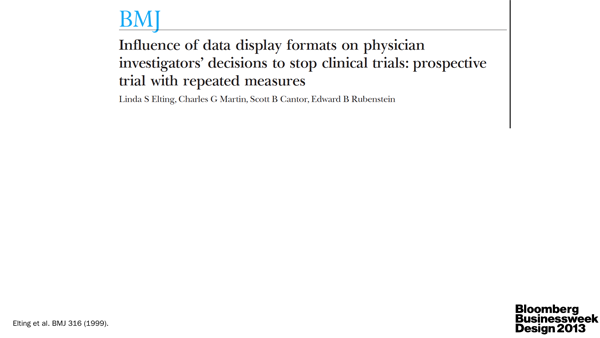
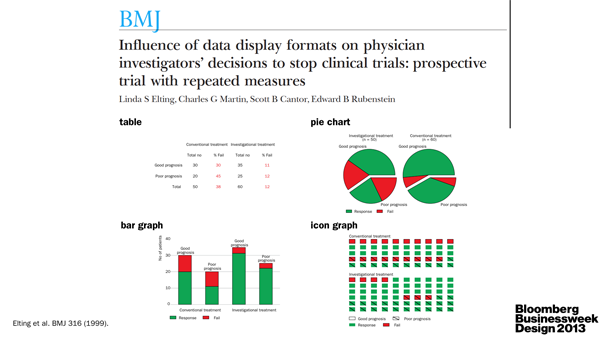
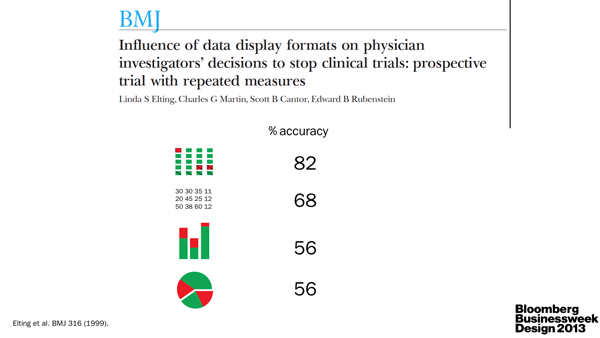
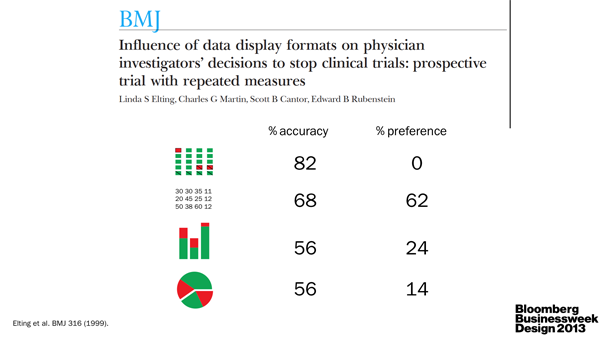
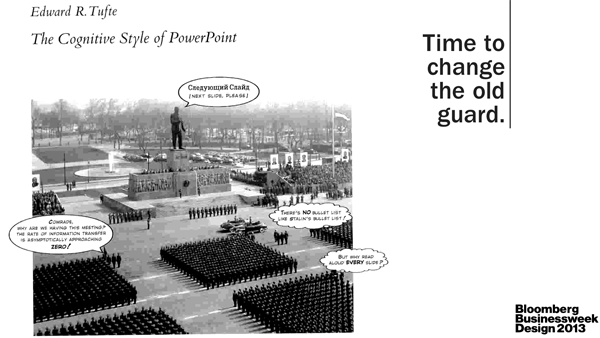
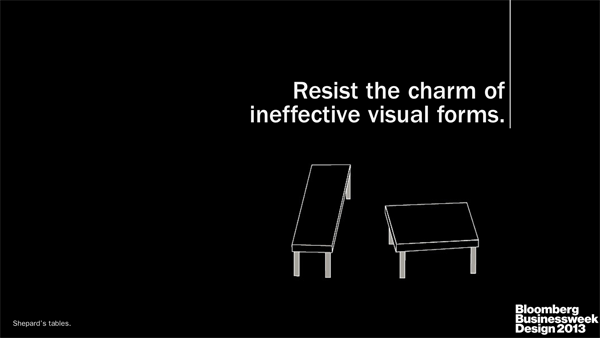
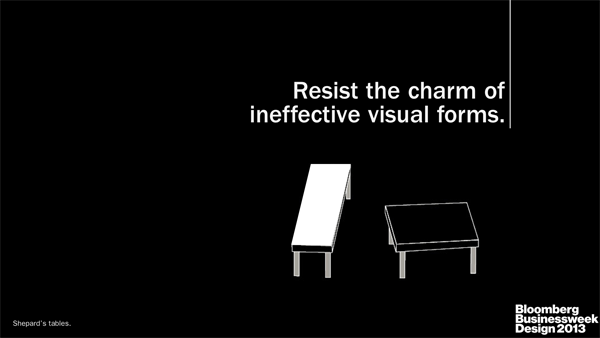
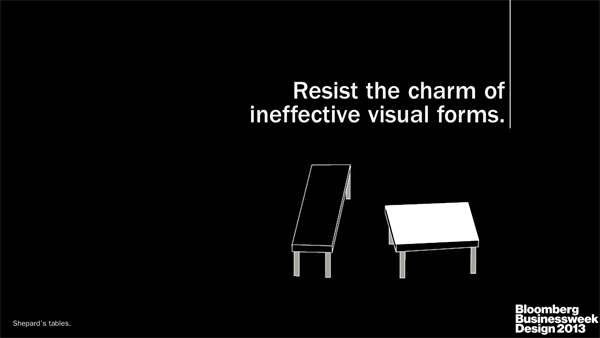
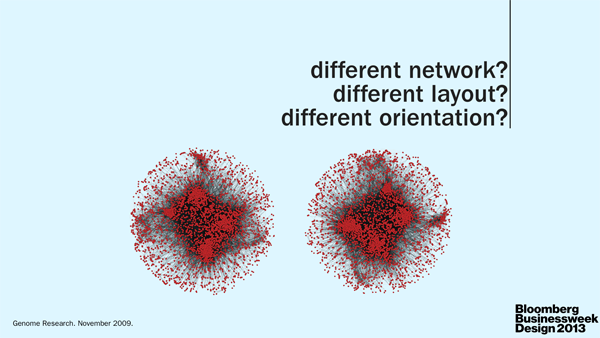
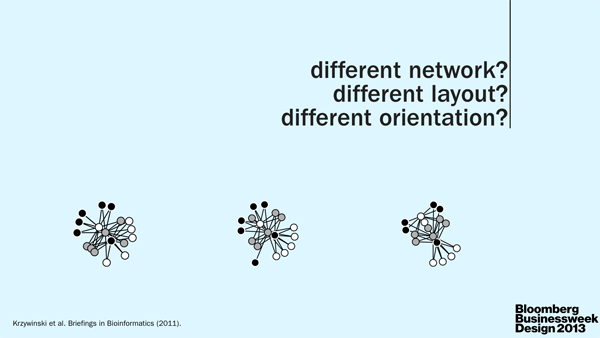
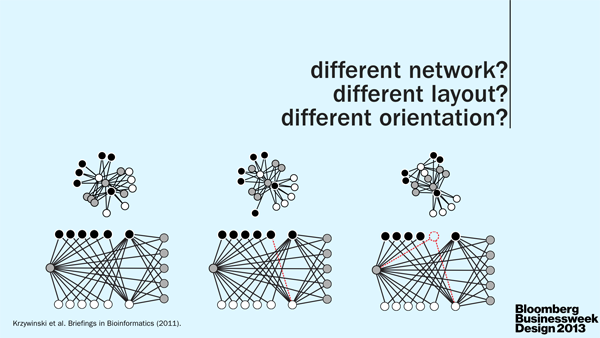
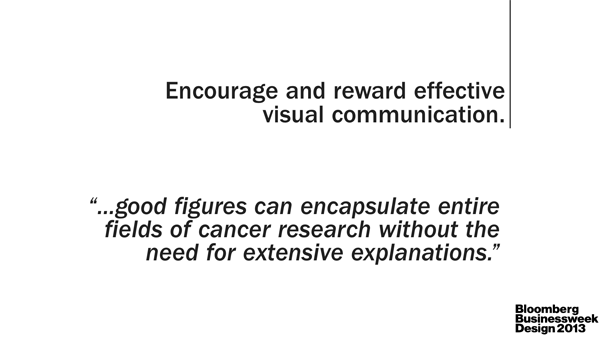
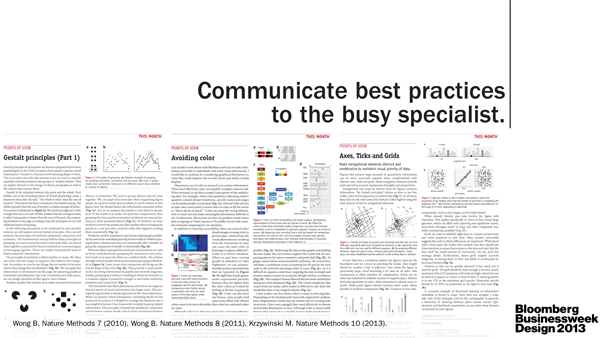
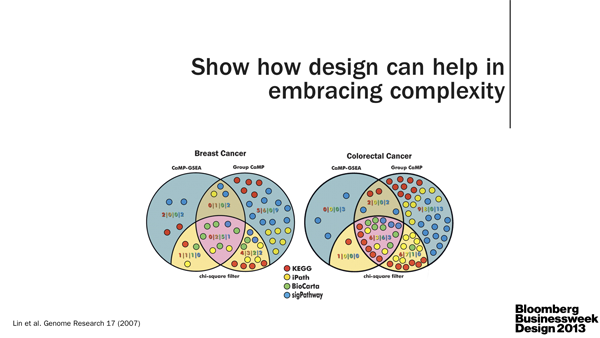
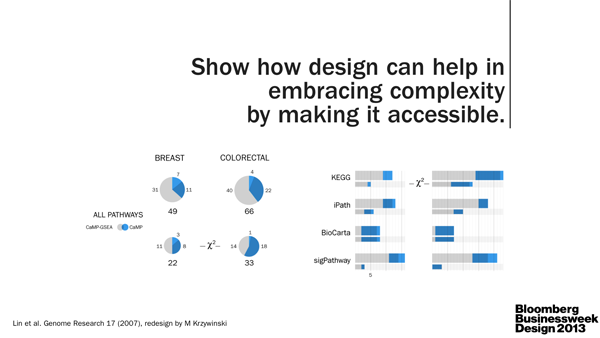
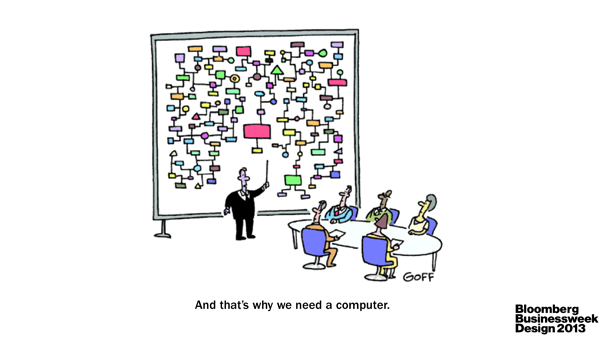
I, as the scientist, underscored the importance of clear communication between scientists. As the specialists, they are often very poor communicators. Pick up any science journal and you'll quickly discover that scientists either aren't good at telling stories or are discouraged to do so by the medium. The consequence is the same: papers read like a wall of text. TL;DR anyone? The quality of visual communication in general ranges from muddled to abysmal (watch video).
We need more leaders in the field, such as Nature Publishing Group, to reward and emphasize good visual communication (e.g. Nature Cancer Review 2013 Figure Calendar).
Our presentations concluded with a 15 minute moderated discussion with Sam Grobart, senior Businesssweek writer. Everyone got a little cheeky. Good fun.
presentation video
Watch: my presentation, conversation with Alberto Cairo, moderated by Sam Grobart. (Bloomberg TV), Albert Cairo's presentation.
presentation slides
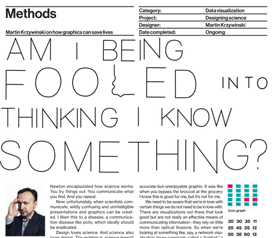
This was a lightning 7 minute talk. I did more planning about what to say than I usually do, given that there was virtually no opportunity for any kind of backtracking, and include a running narrative below each slide.


download presentation
My slides are available as PDF, keynote (zipped) or Quicktime. The format is 16:9 HD.
Bloomberg Businessweek Design Issue
On 28 Jan 2013, Bloomberg Businessweek Design Issue will capture the ideas from the conference and the personalities that generated them.
During the conference, each talk was captured in a series of sketches by Tom Wujec: my talk sketch and moderated discussion sketch.
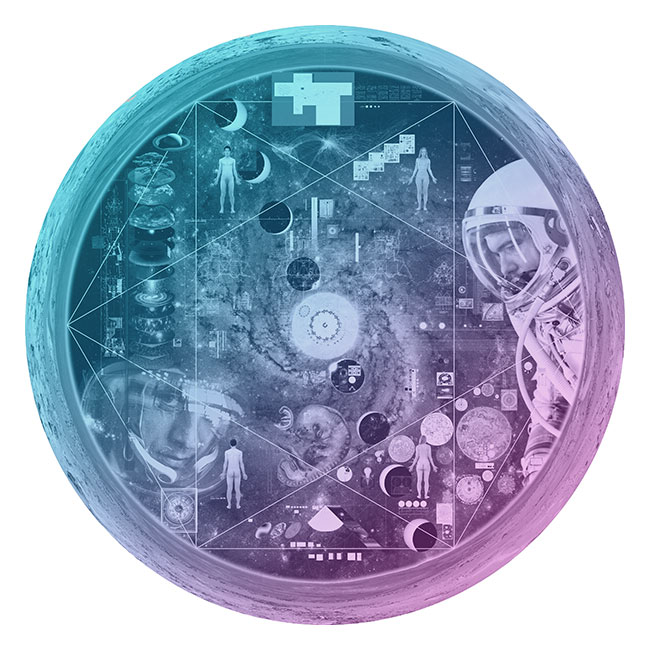
Nasa to send our human genome discs to the Moon
We'd like to say a ‘cosmic hello’: mathematics, culture, palaeontology, art and science, and ... human genomes.


Comparing classifier performance with baselines
All animals are equal, but some animals are more equal than others. —George Orwell
This month, we will illustrate the importance of establishing a baseline performance level.
Baselines are typically generated independently for each dataset using very simple models. Their role is to set the minimum level of acceptable performance and help with comparing relative improvements in performance of other models.
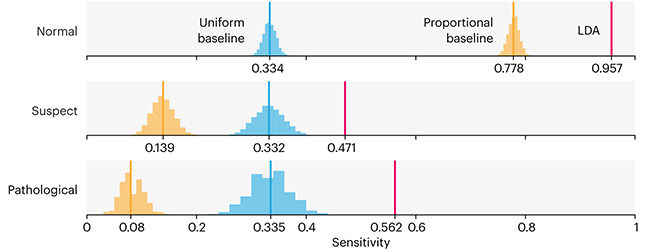
Unfortunately, baselines are often overlooked and, in the presence of a class imbalance5, must be established with care.
Megahed, F.M, Chen, Y-J., Jones-Farmer, A., Rigdon, S.E., Krzywinski, M. & Altman, N. (2024) Points of significance: Comparing classifier performance with baselines. Nat. Methods 20.
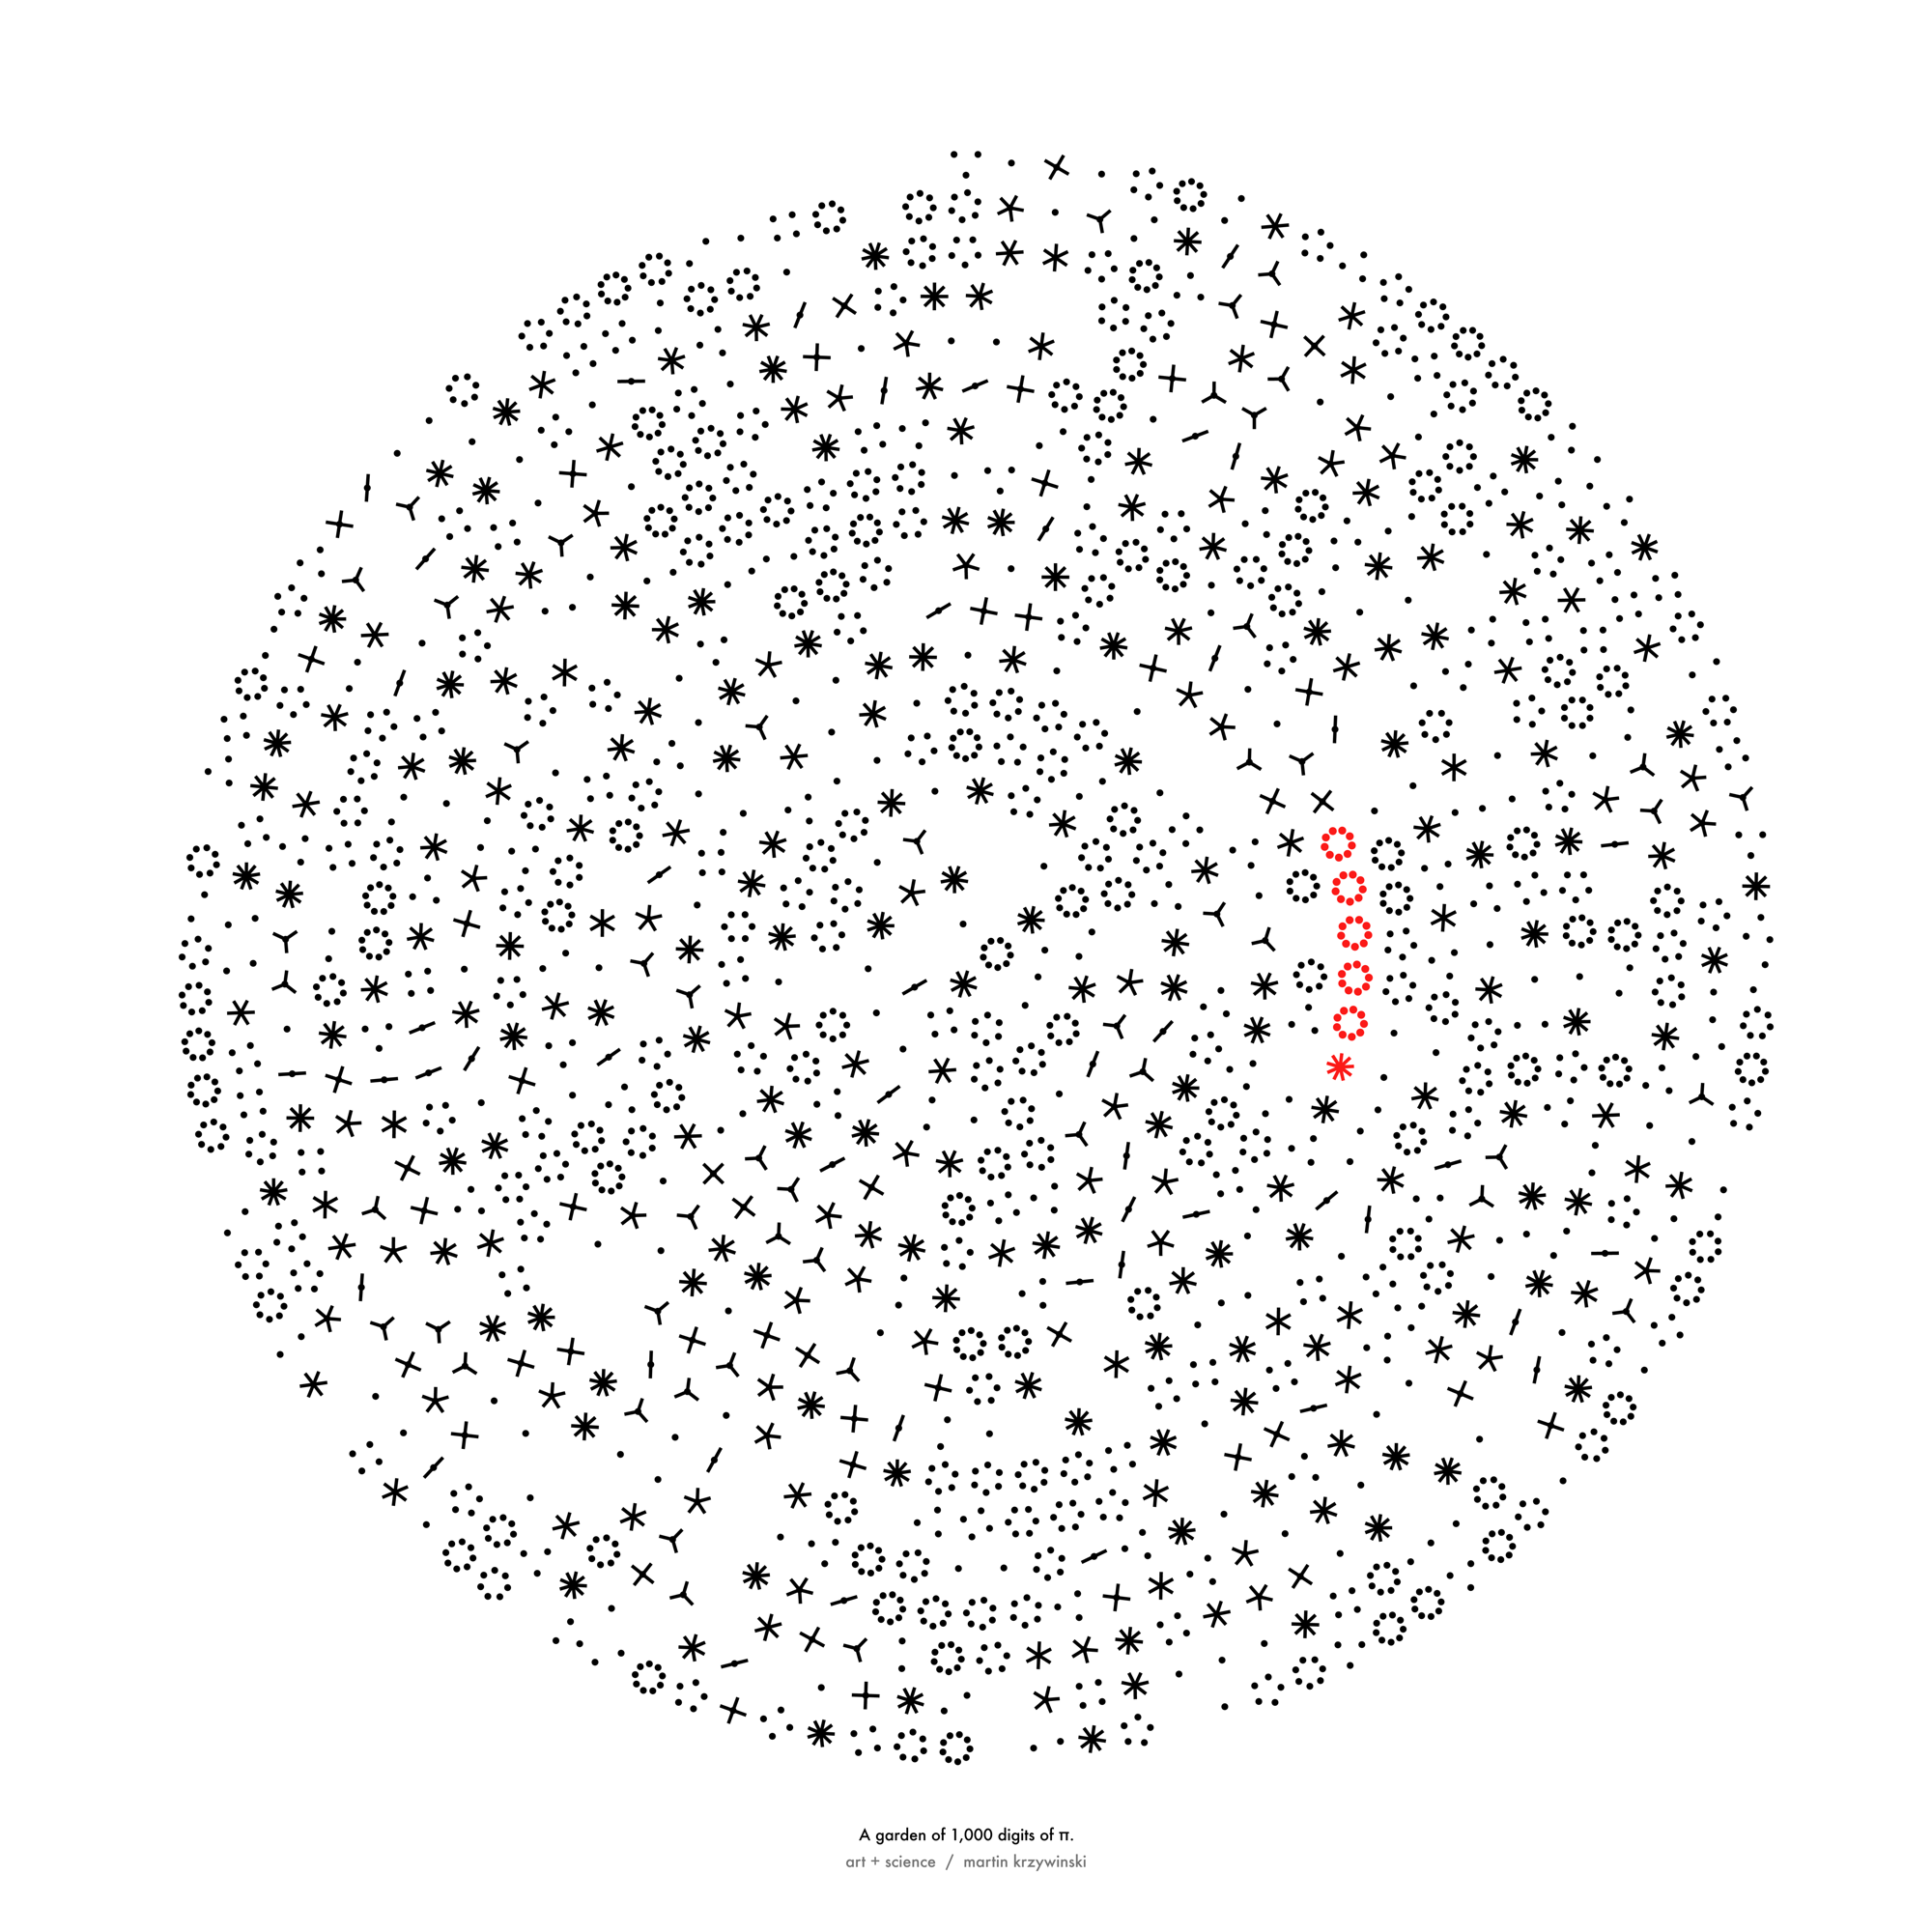
Happy 2024 π Day—
sunflowers ho!
Celebrate π Day (March 14th) and dig into the digit garden. Let's grow something.
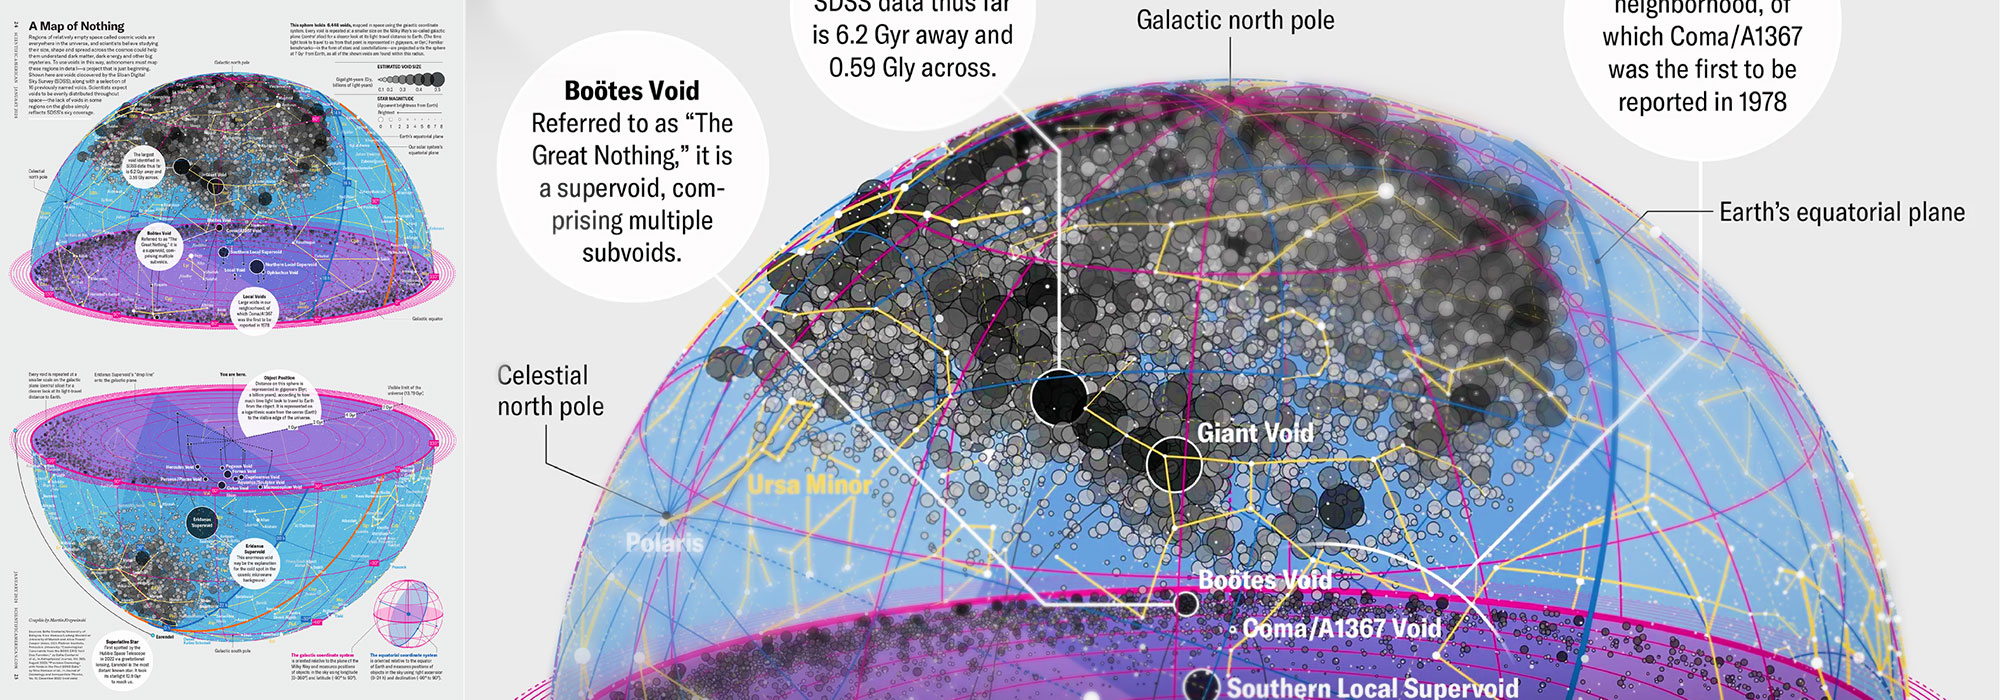
How Analyzing Cosmic Nothing Might Explain Everything
Huge empty areas of the universe called voids could help solve the greatest mysteries in the cosmos.
My graphic accompanying How Analyzing Cosmic Nothing Might Explain Everything in the January 2024 issue of Scientific American depicts the entire Universe in a two-page spread — full of nothing.
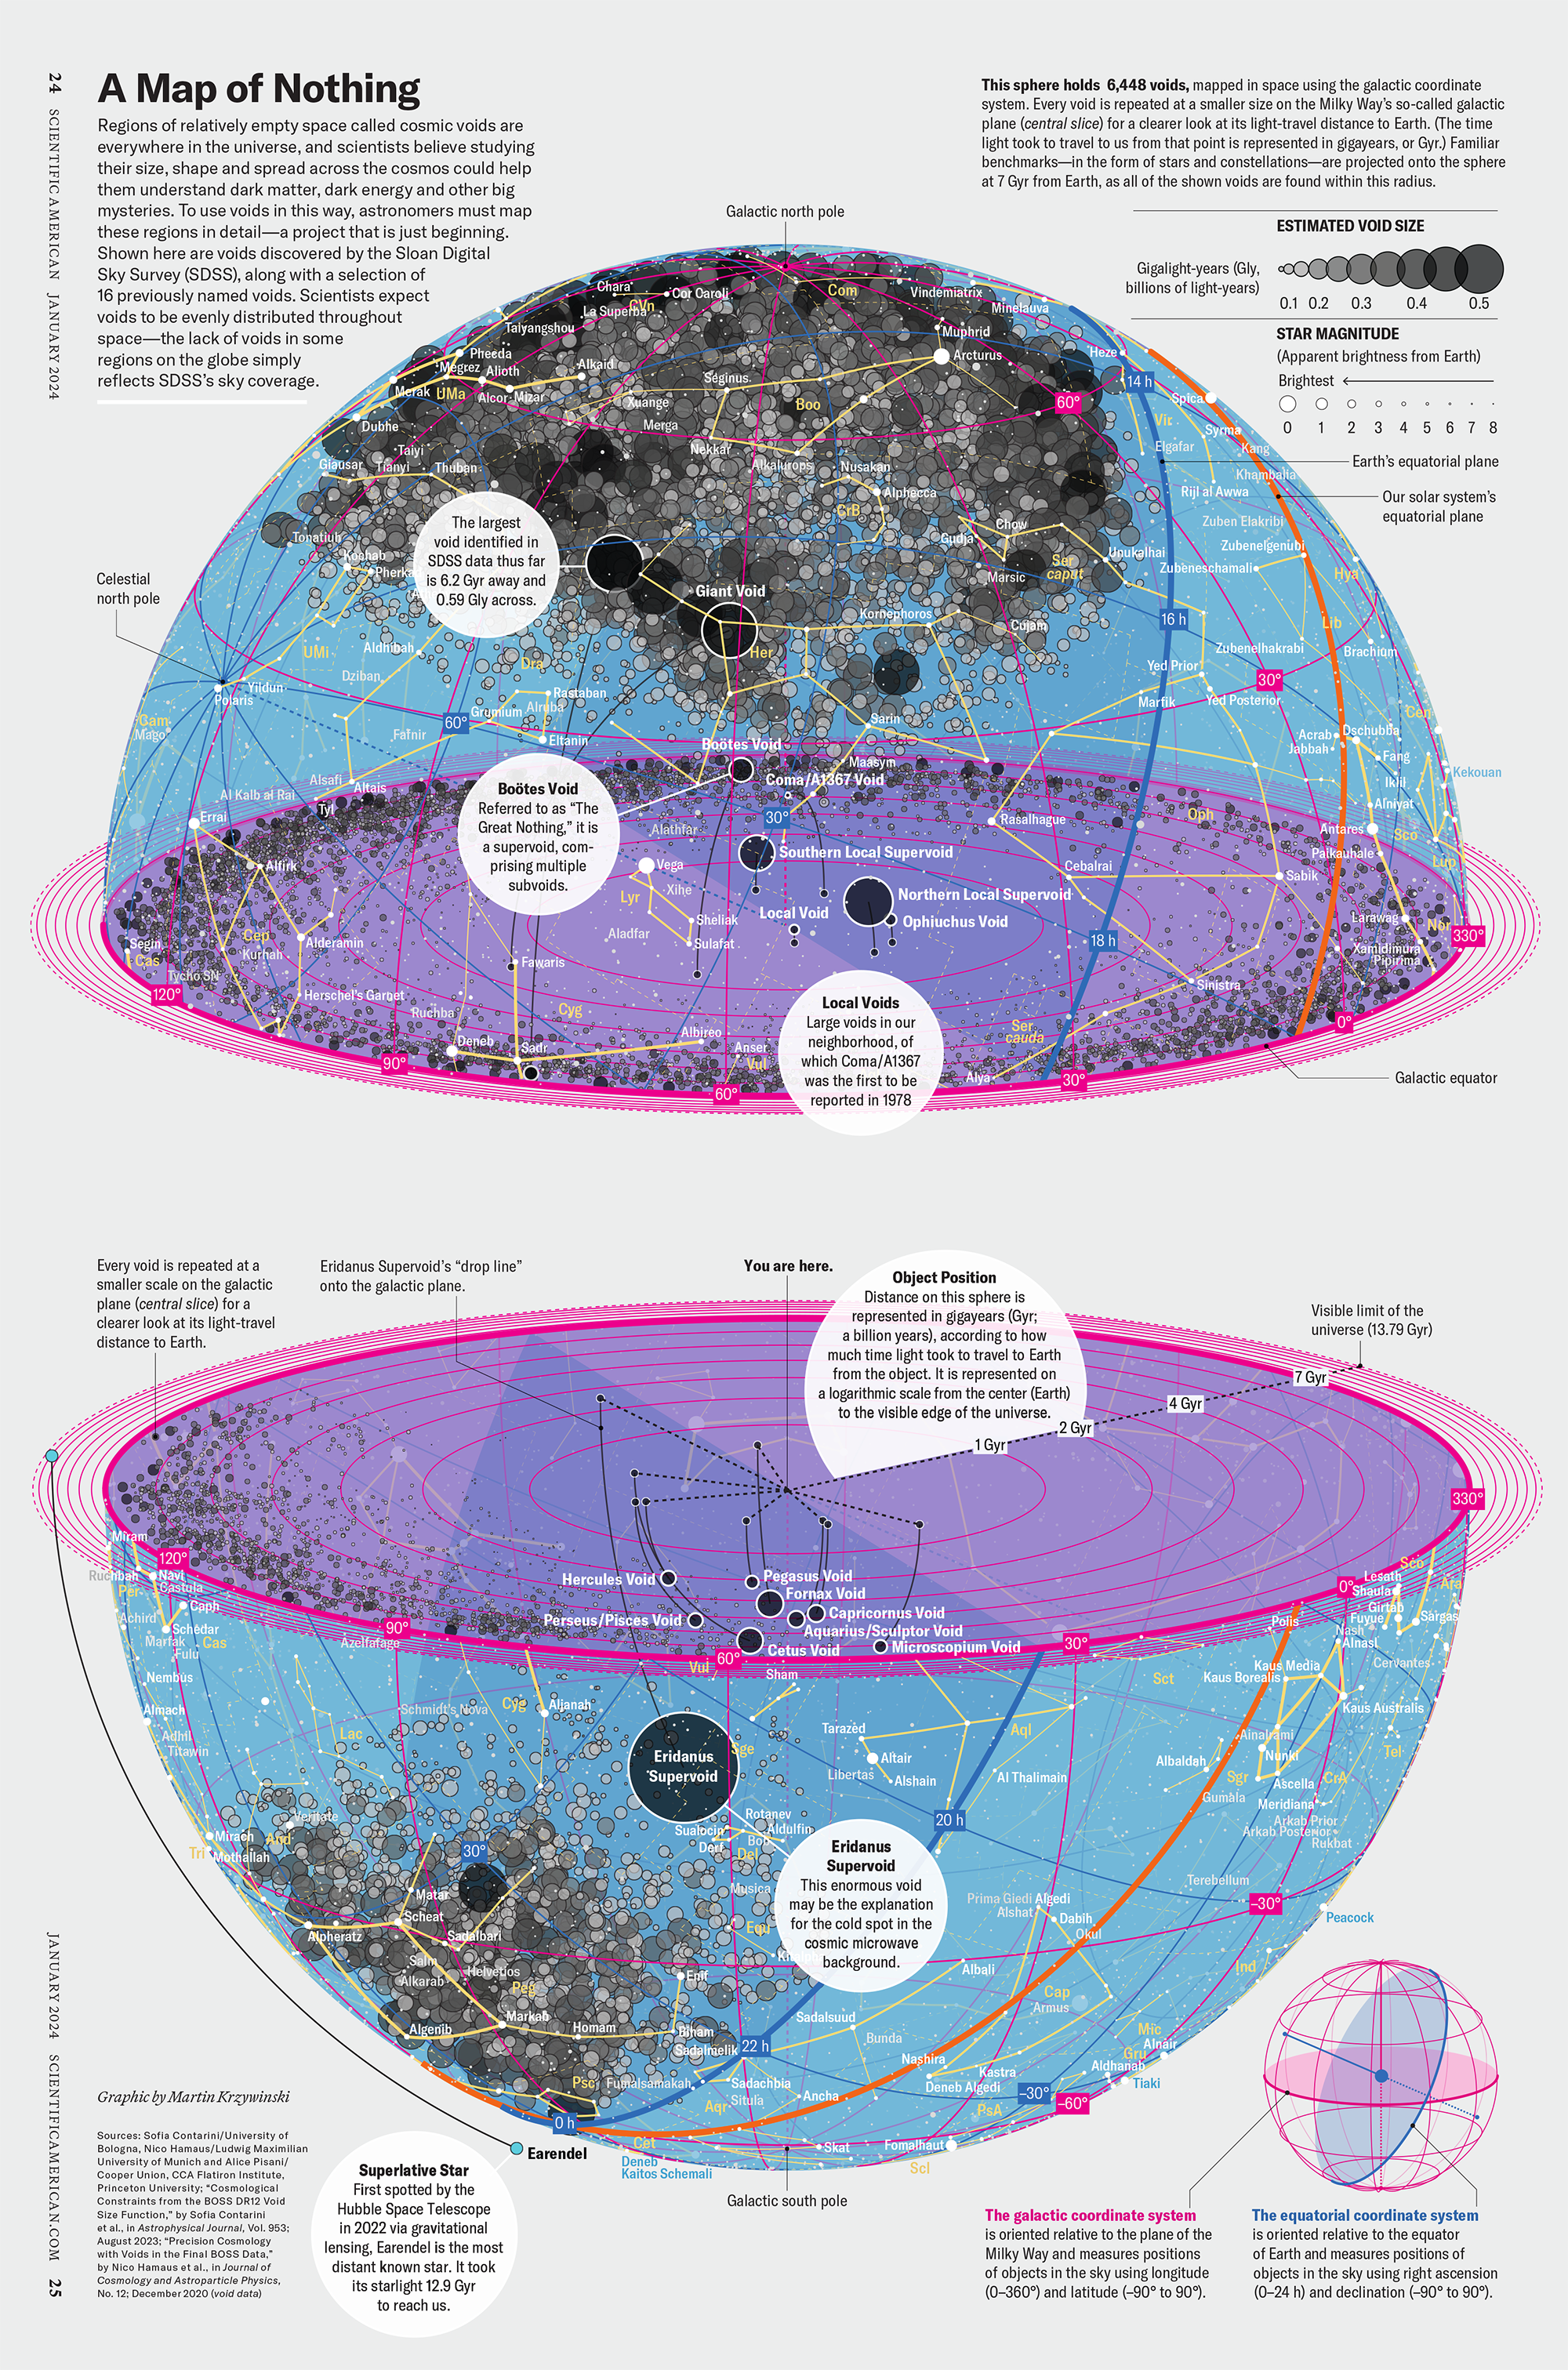
The graphic uses the latest data from SDSS 12 and is an update to my Superclusters and Voids poster.
Michael Lemonick (editor) explains on the graphic:
“Regions of relatively empty space called cosmic voids are everywhere in the universe, and scientists believe studying their size, shape and spread across the cosmos could help them understand dark matter, dark energy and other big mysteries.
To use voids in this way, astronomers must map these regions in detail—a project that is just beginning.
Shown here are voids discovered by the Sloan Digital Sky Survey (SDSS), along with a selection of 16 previously named voids. Scientists expect voids to be evenly distributed throughout space—the lack of voids in some regions on the globe simply reflects SDSS’s sky coverage.”
voids
Sofia Contarini, Alice Pisani, Nico Hamaus, Federico Marulli Lauro Moscardini & Marco Baldi (2023) Cosmological Constraints from the BOSS DR12 Void Size Function Astrophysical Journal 953:46.
Nico Hamaus, Alice Pisani, Jin-Ah Choi, Guilhem Lavaux, Benjamin D. Wandelt & Jochen Weller (2020) Journal of Cosmology and Astroparticle Physics 2020:023.
Sloan Digital Sky Survey Data Release 12
Alan MacRobert (Sky & Telescope), Paulina Rowicka/Martin Krzywinski (revisions & Microscopium)
Hoffleit & Warren Jr. (1991) The Bright Star Catalog, 5th Revised Edition (Preliminary Version).
H0 = 67.4 km/(Mpc·s), Ωm = 0.315, Ωv = 0.685. Planck collaboration Planck 2018 results. VI. Cosmological parameters (2018).
constellation figures
stars
cosmology
Error in predictor variables
It is the mark of an educated mind to rest satisfied with the degree of precision that the nature of the subject admits and not to seek exactness where only an approximation is possible. —Aristotle
In regression, the predictors are (typically) assumed to have known values that are measured without error.
Practically, however, predictors are often measured with error. This has a profound (but predictable) effect on the estimates of relationships among variables – the so-called “error in variables” problem.
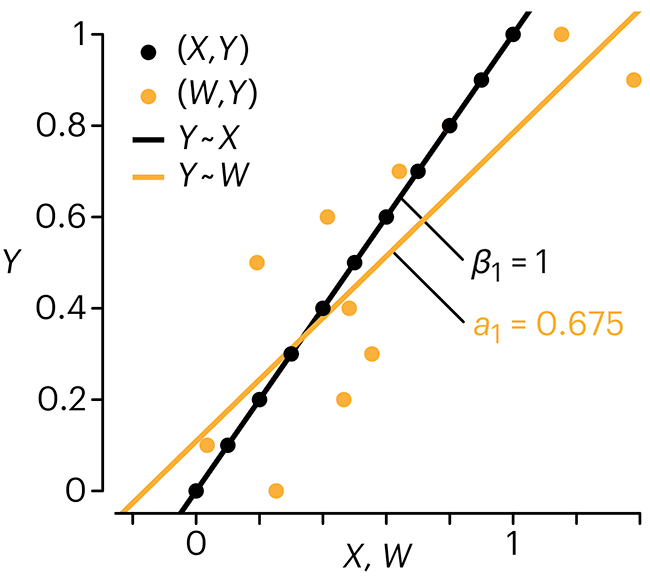
Error in measuring the predictors is often ignored. In this column, we discuss when ignoring this error is harmless and when it can lead to large bias that can leads us to miss important effects.
Altman, N. & Krzywinski, M. (2024) Points of significance: Error in predictor variables. Nat. Methods 20.
Background reading
Altman, N. & Krzywinski, M. (2015) Points of significance: Simple linear regression. Nat. Methods 12:999–1000.
Lever, J., Krzywinski, M. & Altman, N. (2016) Points of significance: Logistic regression. Nat. Methods 13:541–542 (2016).
Das, K., Krzywinski, M. & Altman, N. (2019) Points of significance: Quantile regression. Nat. Methods 16:451–452.