Schemaball
Circular visualization of database schemas

Schemaball was published in SysAdmin Magazine (Krzywinski, M. Schemaball: A New Spin on Database Visualization (2004) Sysadmin Magazine Vol 13 Issue 08). Who cites Schemaball?

Schemaball is an SQL database schema viewer. It requires Perl and a few modules, such as GD and optionally Math::Bezier and SQL::Translator. Schemaball creates flexible visualizations of database schemas. Schemas may be read from an SQL schema dump, flat file or live database.
what is schemaball?
Schemaball is a flexible schema visualizer for SQL databases. The purpose of Schemaball is to help visualize the relationships between tables. Tables are related by foreign keys, which are fields which store the value of a record field from another table. Foreign keys create a lookup relationship between two tables. Large schemas can have hundreds of tables and table relationships. Keeping track of them call can be tedious, error-prone and slow down the schema development process. Schemaball provides a means to create flexible, static graphic images of a schema. Tables and table links can be hidden, highlighted and foreign key relationships can be traversed forward or backward to highlight connected tables.

Schemaball produces images called schema balls. Schema balls are schema visualizations in which tables are ordered along a circle with table relationships drawn as curves or straight lines. Using an input configuration file, all elements of the schema ball can be configured.
Schemaball is free software, licensed under GPL. It is written in Perl and requires a few CPAN modules to run. It's simple to use, while being able to produce high quality schema balls suitable for publication. In particular, you can use Schemaball to generate elements of a schema ball and then create a composite in an image editing program. One such result is shown in the figure at right.
A Need for Flexible Database Visualization

A database schema can be thought of as a directed graph. The nodes in the graph are the tables and the edges are relationships between them. The edges are created by foreign key fields in tables (see figure at right). The reason why the personality is stored in a separate table has to do with optimizing the way data is stored. There may be millions of records in the PERSON table, but only hundreds of different personalities. If the personality name is very long, the size of the database would be unnecessarily large since this same field value would be found in thousands of PERSON records. Storing a personality name in a separate table as a single record and associating it with a unique identifier, while other tables refer to it, is called normalization.
While in this example it's hard to get lost in the single table link, even with 10 tables keeping things straight can get messy. Schemaball helps to keep your head wrapped around your tables' connections. You can print out a schema ball and mark it up while you work on your schema. When I'm working on a database, I use the excellent mysqlfront to create tables and edit table fields. When I have my tables created, I print out a schema ball and mark up how I'd like to link the tables together. Once I create the foreign key fields, I can print out another schema ball and keep it for record.
Since it is designed primarily to Schemaball does not show the interal details of the tables. In future versions, support for display of fields may be included, to generate schema superballs.
Schemaball is at end of life
I am not longer actively working on Schemaball. As a prototype system, it works well to quickly figure out the extent of connectedness between tables and create some visually appealing images.
I've since been using the circular composition form in my Circos project, which applies this layout to visualizing genomes (Circos is particularly popular in the field of comparative genomes, in which relationships between two or more genomes are analyzed and displayed).
Case Study — Ensembl
Ensembl balls! See the structure of each Ensembl database, as drawn with Schemaball.

using Schemaball
To run Schemaball, you need Perl and a few CPAN modules. Schemaball has not been tested on Windows.
Beyond Belief Campaign BRCA Art
Fuelled by philanthropy, findings into the workings of BRCA1 and BRCA2 genes have led to groundbreaking research and lifesaving innovations to care for families facing cancer.
This set of 100 one-of-a-kind prints explore the structure of these genes. Each artwork is unique — if you put them all together, you get the full sequence of the BRCA1 and BRCA2 proteins.
Propensity score weighting
The needs of the many outweigh the needs of the few. —Mr. Spock (Star Trek II)
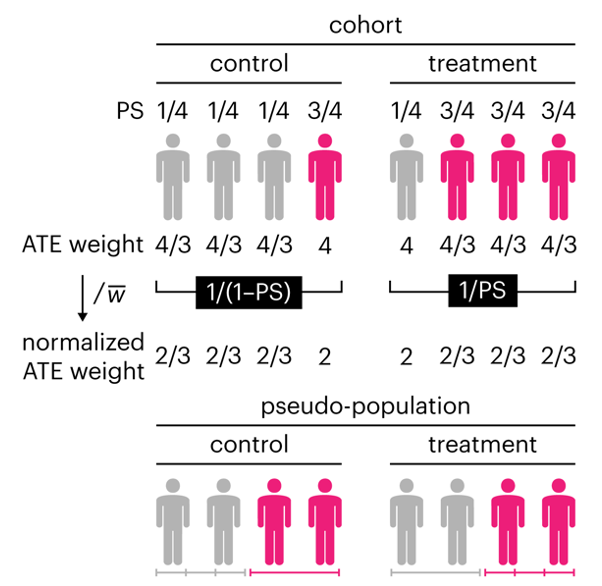
This month, we explore a related and powerful technique to address bias: propensity score weighting (PSW), which applies weights to each subject instead of matching (or discarding) them.

Kurz, C.F., Krzywinski, M. & Altman, N. (2025) Points of significance: Propensity score weighting. Nat. Methods 22:1–3.
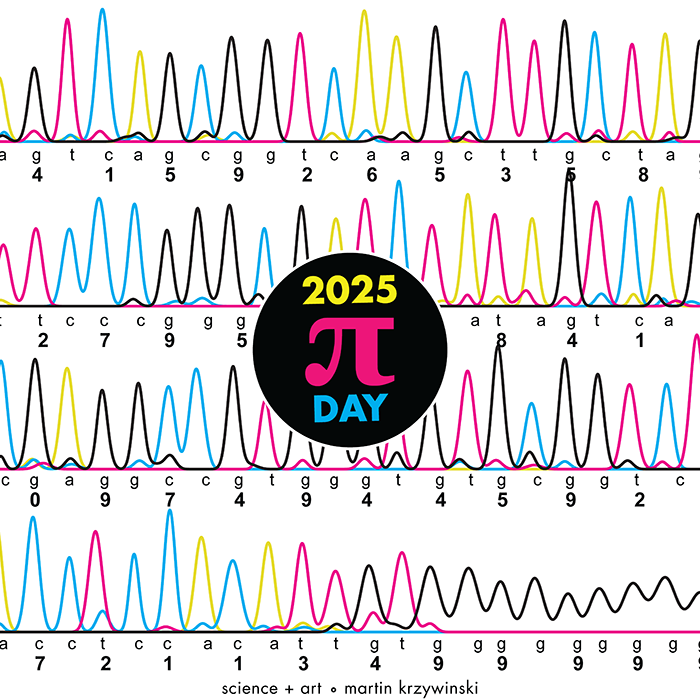
Happy 2025 π Day—
TTCAGT: a sequence of digits
Celebrate π Day (March 14th) and sequence digits like its 1999. Let's call some peaks.

Crafting 10 Years of Statistics Explanations: Points of Significance
I don’t have good luck in the match points. —Rafael Nadal, Spanish tennis player
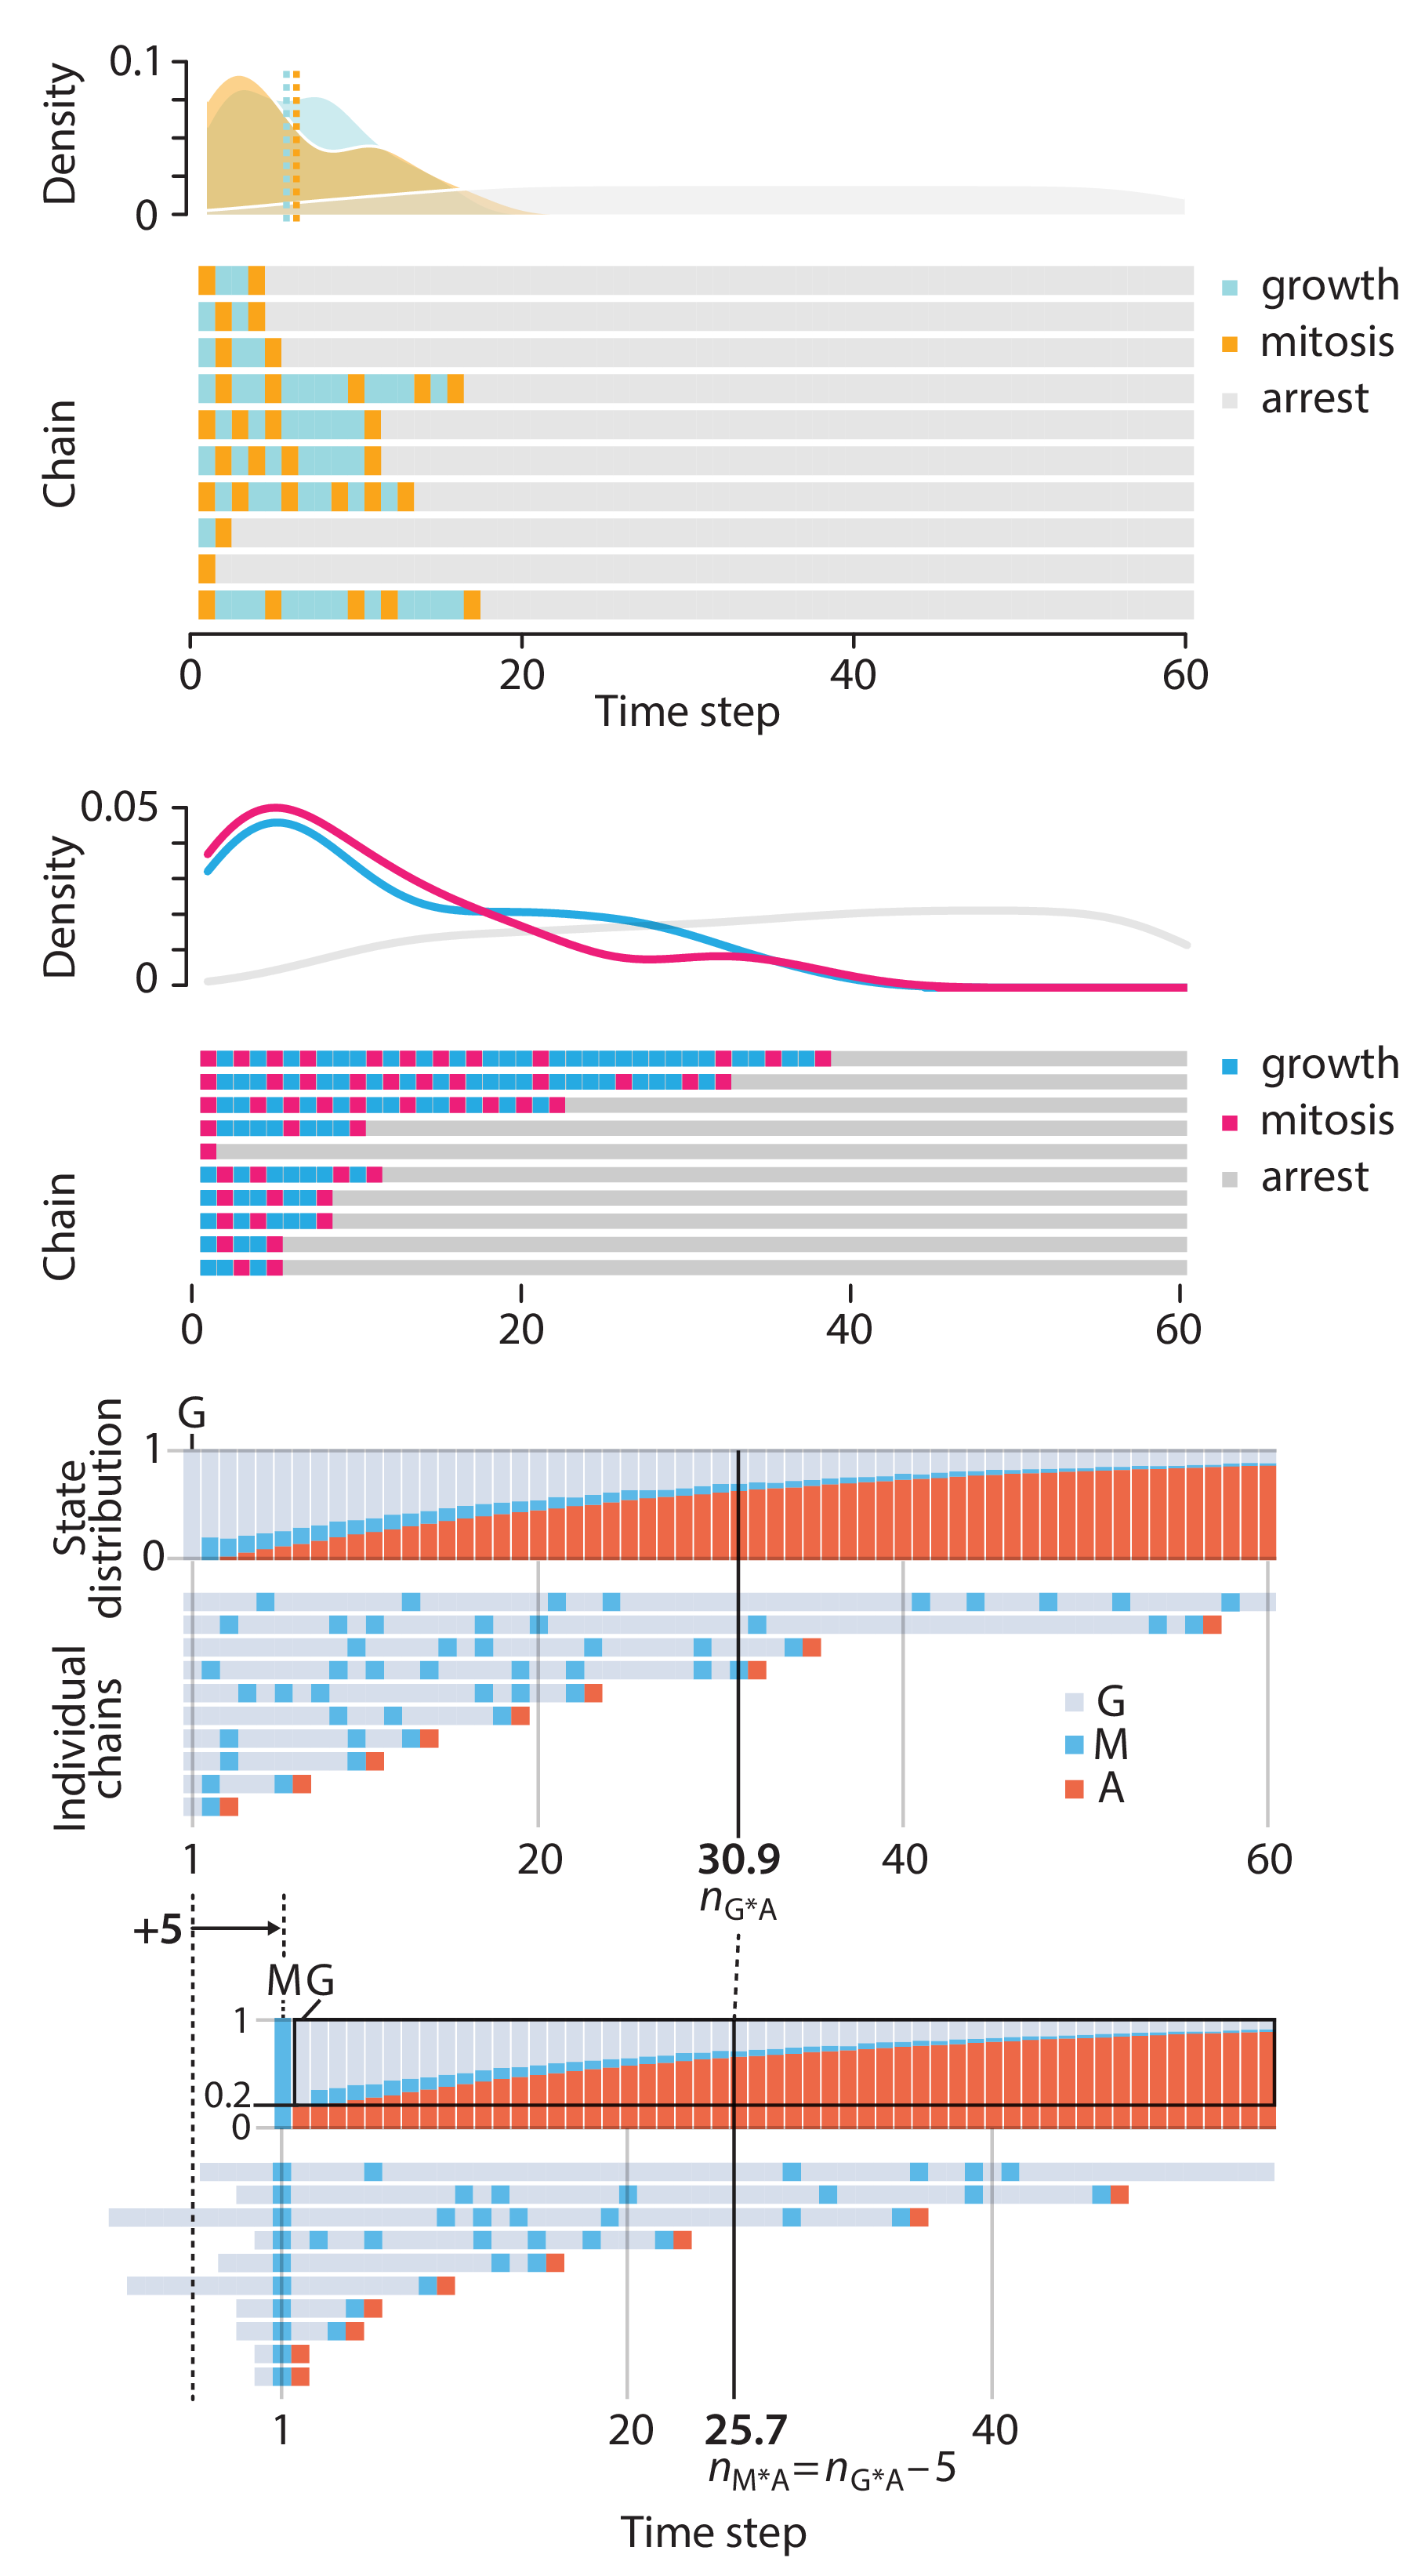
Points of Significance is an ongoing series of short articles about statistics in Nature Methods that started in 2013. Its aim is to provide clear explanations of essential concepts in statistics for a nonspecialist audience. The articles favor heuristic explanations and make extensive use of simulated examples and graphical explanations, while maintaining mathematical rigor.
Topics range from basic, but often misunderstood, such as uncertainty and P-values, to relatively advanced, but often neglected, such as the error-in-variables problem and the curse of dimensionality. More recent articles have focused on timely topics such as modeling of epidemics, machine learning, and neural networks.
In this article, we discuss the evolution of topics and details behind some of the story arcs, our approach to crafting statistical explanations and narratives, and our use of figures and numerical simulations as props for building understanding.

Altman, N. & Krzywinski, M. (2025) Crafting 10 Years of Statistics Explanations: Points of Significance. Annual Review of Statistics and Its Application 12:69–87.
Propensity score matching
I don’t have good luck in the match points. —Rafael Nadal, Spanish tennis player
In many experimental designs, we need to keep in mind the possibility of confounding variables, which may give rise to bias in the estimate of the treatment effect.

If the control and experimental groups aren't matched (or, roughly, similar enough), this bias can arise.
Sometimes this can be dealt with by randomizing, which on average can balance this effect out. When randomization is not possible, propensity score matching is an excellent strategy to match control and experimental groups.
Kurz, C.F., Krzywinski, M. & Altman, N. (2024) Points of significance: Propensity score matching. Nat. Methods 21:1770–1772.
