science + genomics
What if we were to print what we sequence?
Expressing the amount of sequence in the human genome in terms of the number of printed pages has been done before. At the Broad Institute, all of the human reference genome is printed in bound volumes.
At our sequencing facility, we sequence about 1 terabases per day. This is equivalent to 167 diploid human genomes (167 × 6 gigabases). The sequencing is done using a pool of 13 Illumina HiSeq 2500 sequencers, of which about 50% are sequencing at any given time.

This sequencing is extremely fast.
To understand just how fast this is, consider printing this amount of sequence using a modern office laser printer. Let's pick the HP P3015n which costs about $400—a cheap and fast network printer. It can print at about 40 pages per minute.
If we print the sequence at 6pt Courier using 0.25" margins, each 8.5" × 11" page will accomodate 18,126 bases. I chose this font size because it's reasonably legible. To print 1 terabases we need `10^12 / 18126 = 55.2` million pages.
If we print continuously at 40 pages per minute, we need `10^12 / (18126*40*1440) = 957.8` days.
If we had 958 printers working around the clock, we could print everything we sequence and not fall behind. This does not account for time required to replenish toner or paper.
what's cheaper, sequencing or printing?
It costs us about $12,000 to sequence a terabase in reagents. If we do it on a cost-recovery basis, it is about twice that, to include labor and storage. Let's say $25,000 per terabase.
Coincidentally, this is about $150 per 1× coverage of a diploid human genome. The cost of sequencing a single genome would be significantly higher because of overhead. To overcome gaps in coverage and to be sensitive to alleles in heterogenous samples, sequencing should be done to 30× or more. For example, we sequence cancer genomes at over 100×. For theory and review see Aspects of coverage in medical DNA sequencing by Wendl et al. and Sequencing depth and coverage: key considerations in genomic analyses by Sims et al.. (Thanks to Nicolas Robine for pointing out that redundant coverage should be mentioned here).
Printing is 44× more expensive than sequencing, per base: 25 n$ vs 1.1 μ$.
I should mention that the cost of analyzing the sequenced genome should be considered—this step is always the much more expensive one. In The $1,000 genome, the $100,000 analysis? Mardis asks "If our efforts to improve the human reference sequence quality, variation, and annotation are successful, how do we avoid the pitfall of having cheap human genome resequencing but complex and expensive manual analysis to make clinical sense out of the data?"
The cost of a single printed page (toner, power, etc) is about $0.02–0.05, depending on the printer. Let's be generous and say it's $0.02. To print 55.2 million pages would cost us $1.1M. This is about 44 times as expensive as sequencing.

Think about this. It's 44× more expensive to merely print a letter on a page than it is to determine it from the DNA of a cell. In other words, to go from the physical molecule to a bit state on a disk is much cheaper than from a bit state on a disk to a representation of the letter on a page.
Per base, our sequencing costs `$25000/10^12 = $25*10^-9`, or 25 nanodollars. At $0.02 and 18,126 bp per page, printing costs `0.02/18126 = $1.1*10^-6` or 1.1 microdollars.
If at this point you're thinking that printing isn't practical, the fact that the pages would weigh 248,000 kg and stack to 5.5 km should cinch the argument.
The capital cost of sequencing is, of course, much higher. The printers themselves would cost about $400,000 to purchase. The 6 sequencers, on the other hand, cost about $3,600,000.
sequencing is as fast as downloading
We sequence at a rate close to the average internet bandwidth available to the public.
At 3.86 Mb/s, we could download a terabase of compressed sequence in a day, assuming the sequence can be compressed by a factor of 3. This level of compression is reasonable—the current human assembly is 938 Mb zipped).
In other words, you would have to be downloading essentially continuously to keep up with our sequencing.
Beyond Belief Campaign BRCA Art
Fuelled by philanthropy, findings into the workings of BRCA1 and BRCA2 genes have led to groundbreaking research and lifesaving innovations to care for families facing cancer.
This set of 100 one-of-a-kind prints explore the structure of these genes. Each artwork is unique — if you put them all together, you get the full sequence of the BRCA1 and BRCA2 proteins.
Propensity score weighting
The needs of the many outweigh the needs of the few. —Mr. Spock (Star Trek II)
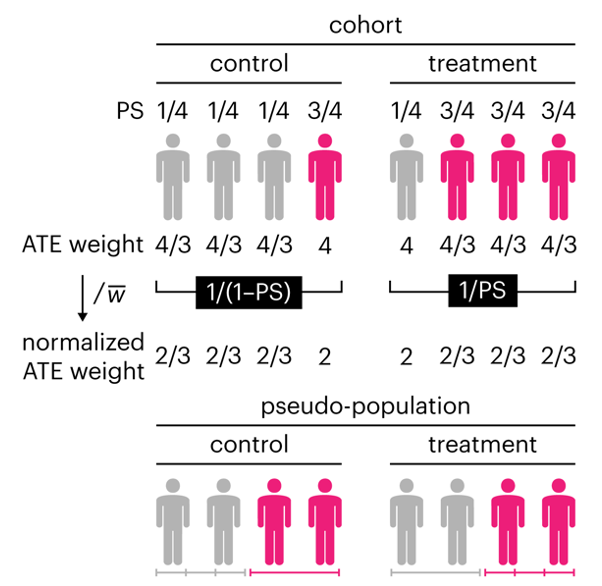
This month, we explore a related and powerful technique to address bias: propensity score weighting (PSW), which applies weights to each subject instead of matching (or discarding) them.

Kurz, C.F., Krzywinski, M. & Altman, N. (2025) Points of significance: Propensity score weighting. Nat. Methods 22:1–3.
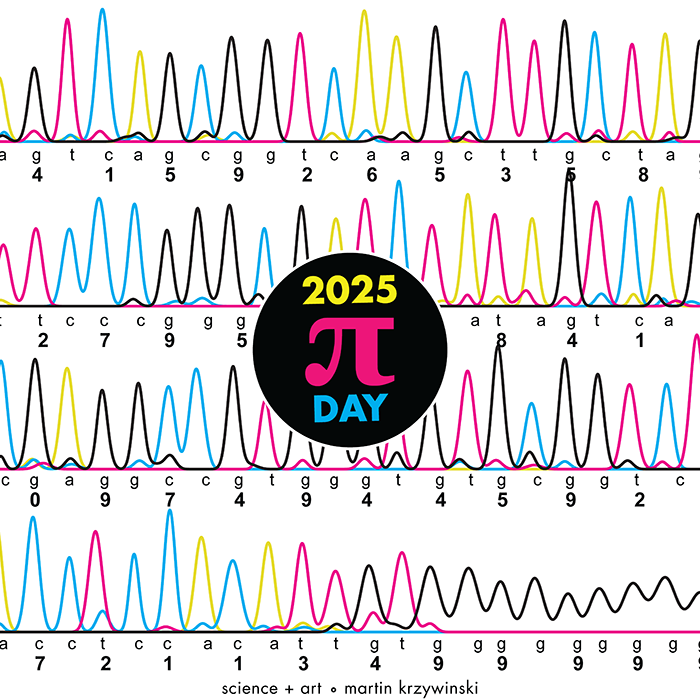
Happy 2025 π Day—
TTCAGT: a sequence of digits
Celebrate π Day (March 14th) and sequence digits like its 1999. Let's call some peaks.

Crafting 10 Years of Statistics Explanations: Points of Significance
I don’t have good luck in the match points. —Rafael Nadal, Spanish tennis player
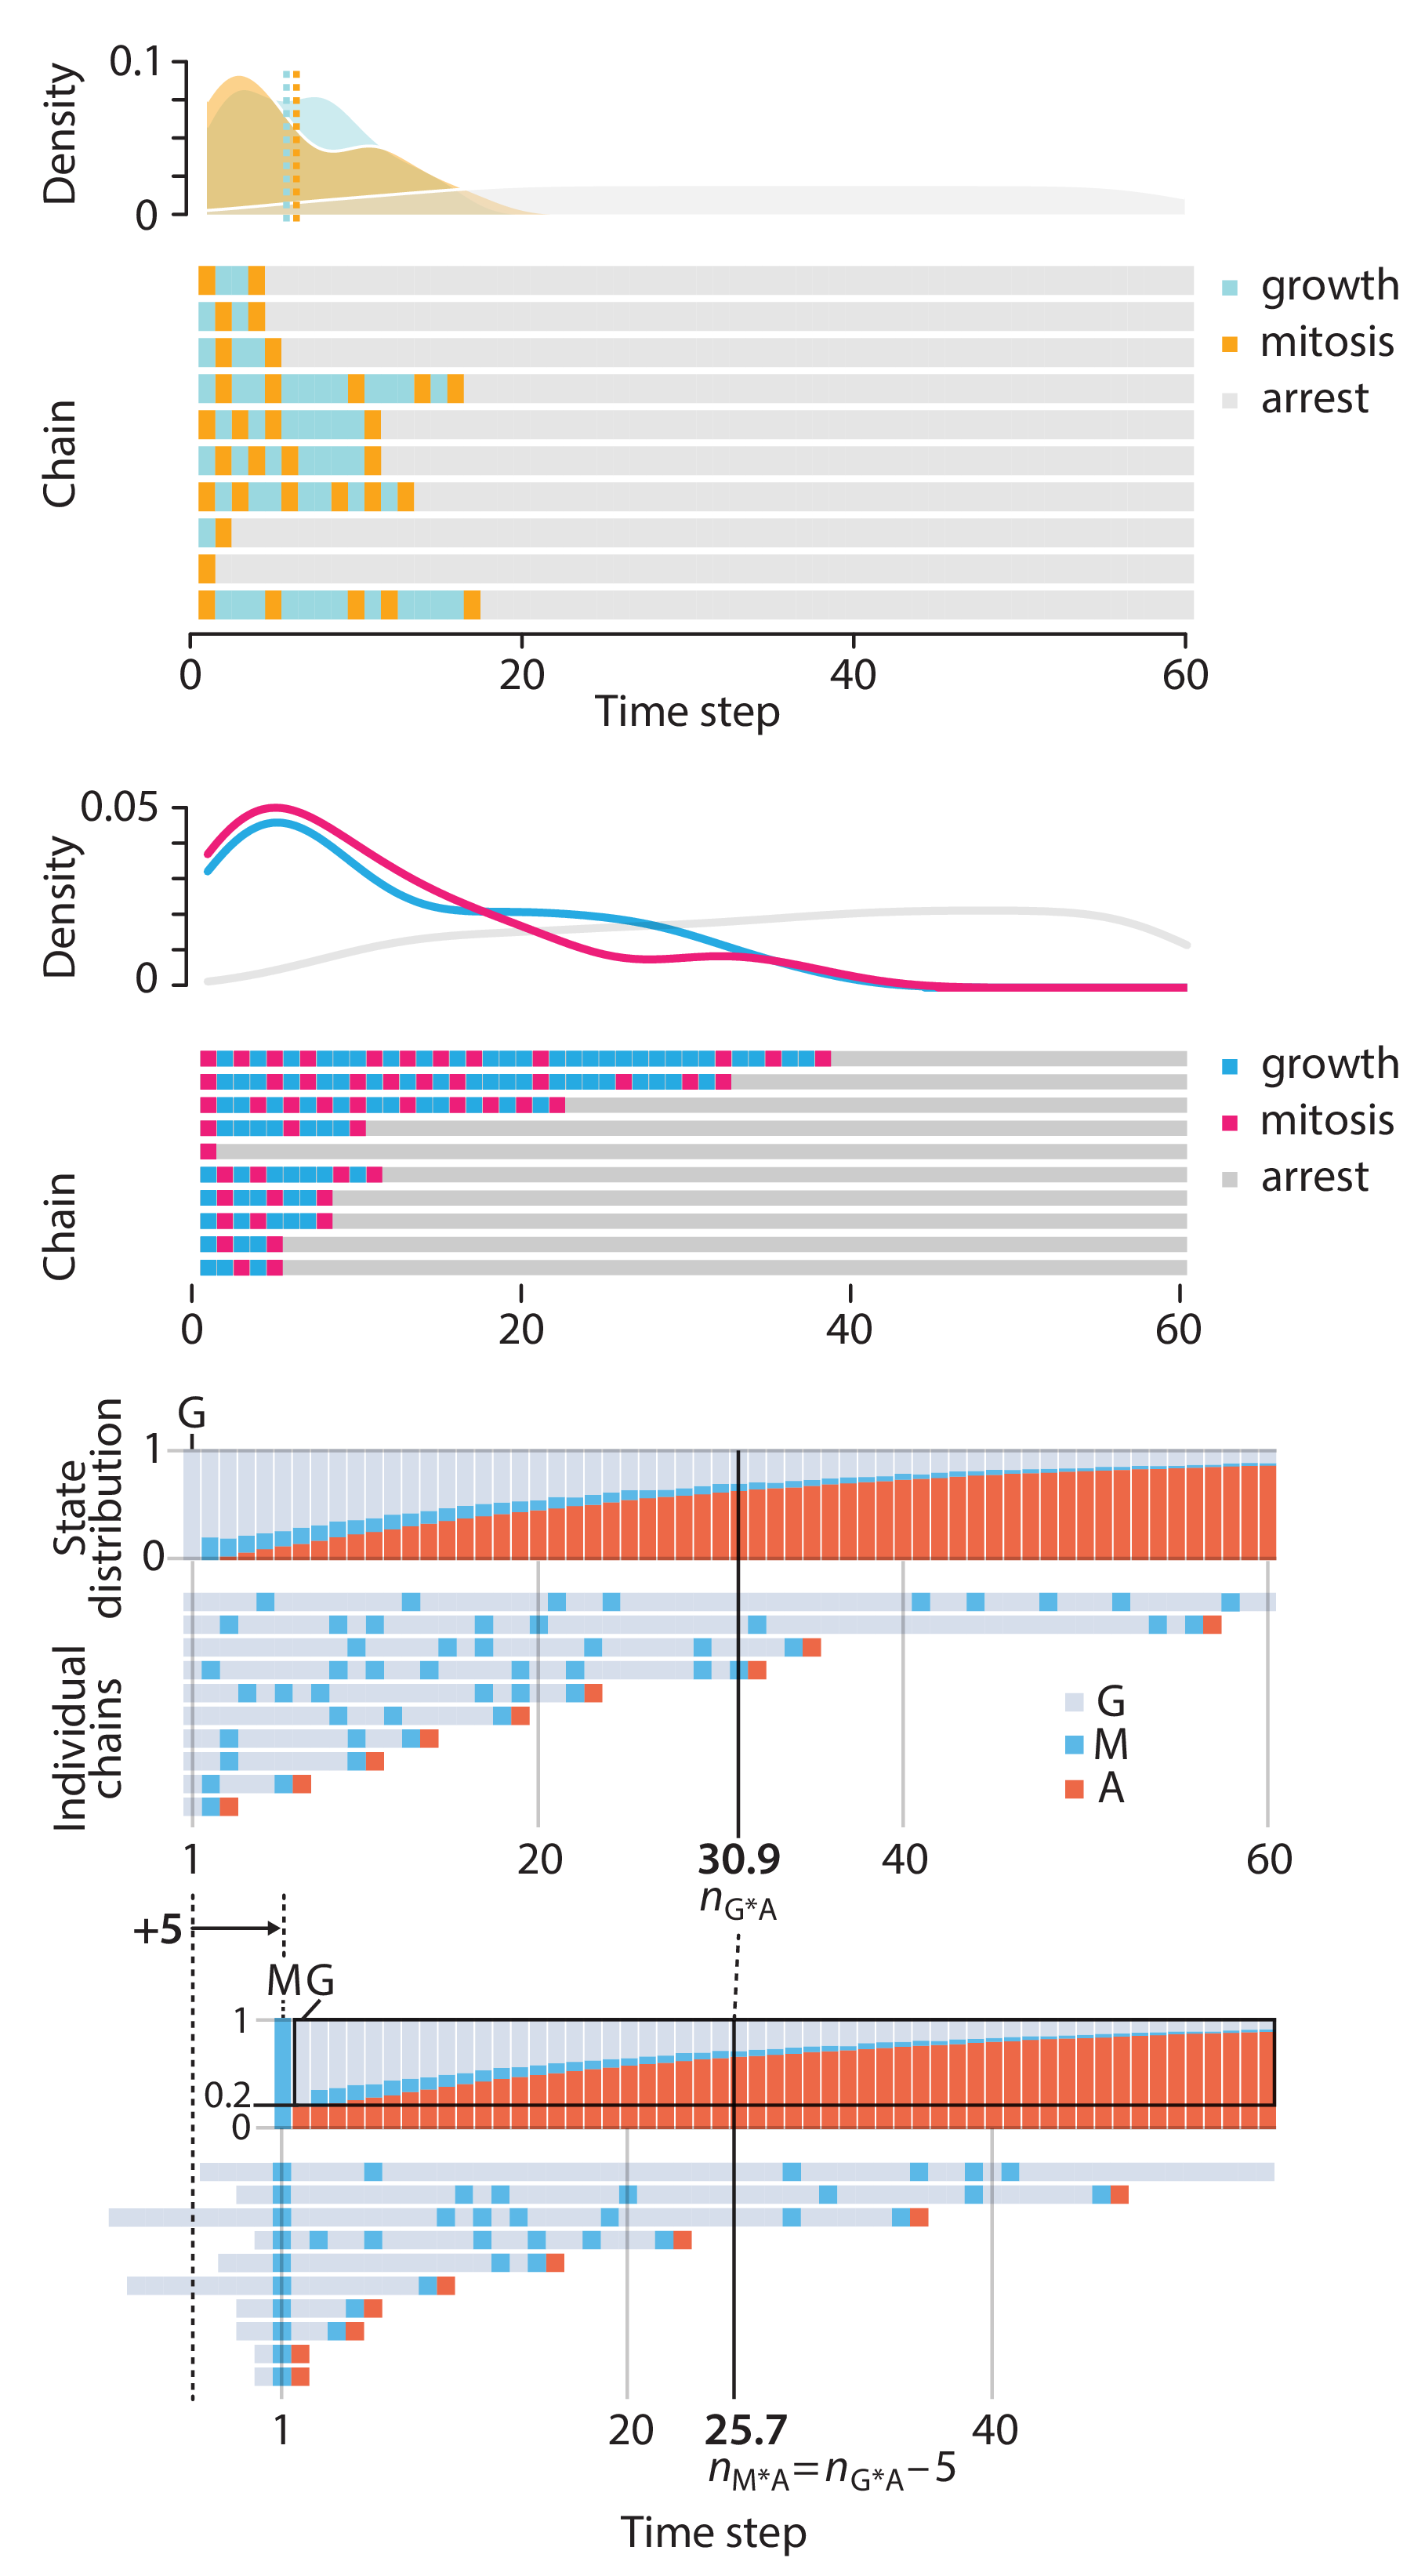
Points of Significance is an ongoing series of short articles about statistics in Nature Methods that started in 2013. Its aim is to provide clear explanations of essential concepts in statistics for a nonspecialist audience. The articles favor heuristic explanations and make extensive use of simulated examples and graphical explanations, while maintaining mathematical rigor.
Topics range from basic, but often misunderstood, such as uncertainty and P-values, to relatively advanced, but often neglected, such as the error-in-variables problem and the curse of dimensionality. More recent articles have focused on timely topics such as modeling of epidemics, machine learning, and neural networks.
In this article, we discuss the evolution of topics and details behind some of the story arcs, our approach to crafting statistical explanations and narratives, and our use of figures and numerical simulations as props for building understanding.

Altman, N. & Krzywinski, M. (2025) Crafting 10 Years of Statistics Explanations: Points of Significance. Annual Review of Statistics and Its Application 12:69–87.
Propensity score matching
I don’t have good luck in the match points. —Rafael Nadal, Spanish tennis player
In many experimental designs, we need to keep in mind the possibility of confounding variables, which may give rise to bias in the estimate of the treatment effect.

If the control and experimental groups aren't matched (or, roughly, similar enough), this bias can arise.
Sometimes this can be dealt with by randomizing, which on average can balance this effect out. When randomization is not possible, propensity score matching is an excellent strategy to match control and experimental groups.
Kurz, C.F., Krzywinski, M. & Altman, N. (2024) Points of significance: Propensity score matching. Nat. Methods 21:1770–1772.
