


genomics + data mining
ICDM2012 Keynote
Needles in Stacks of Needles: genomics + data mining
visual abstract

abstract
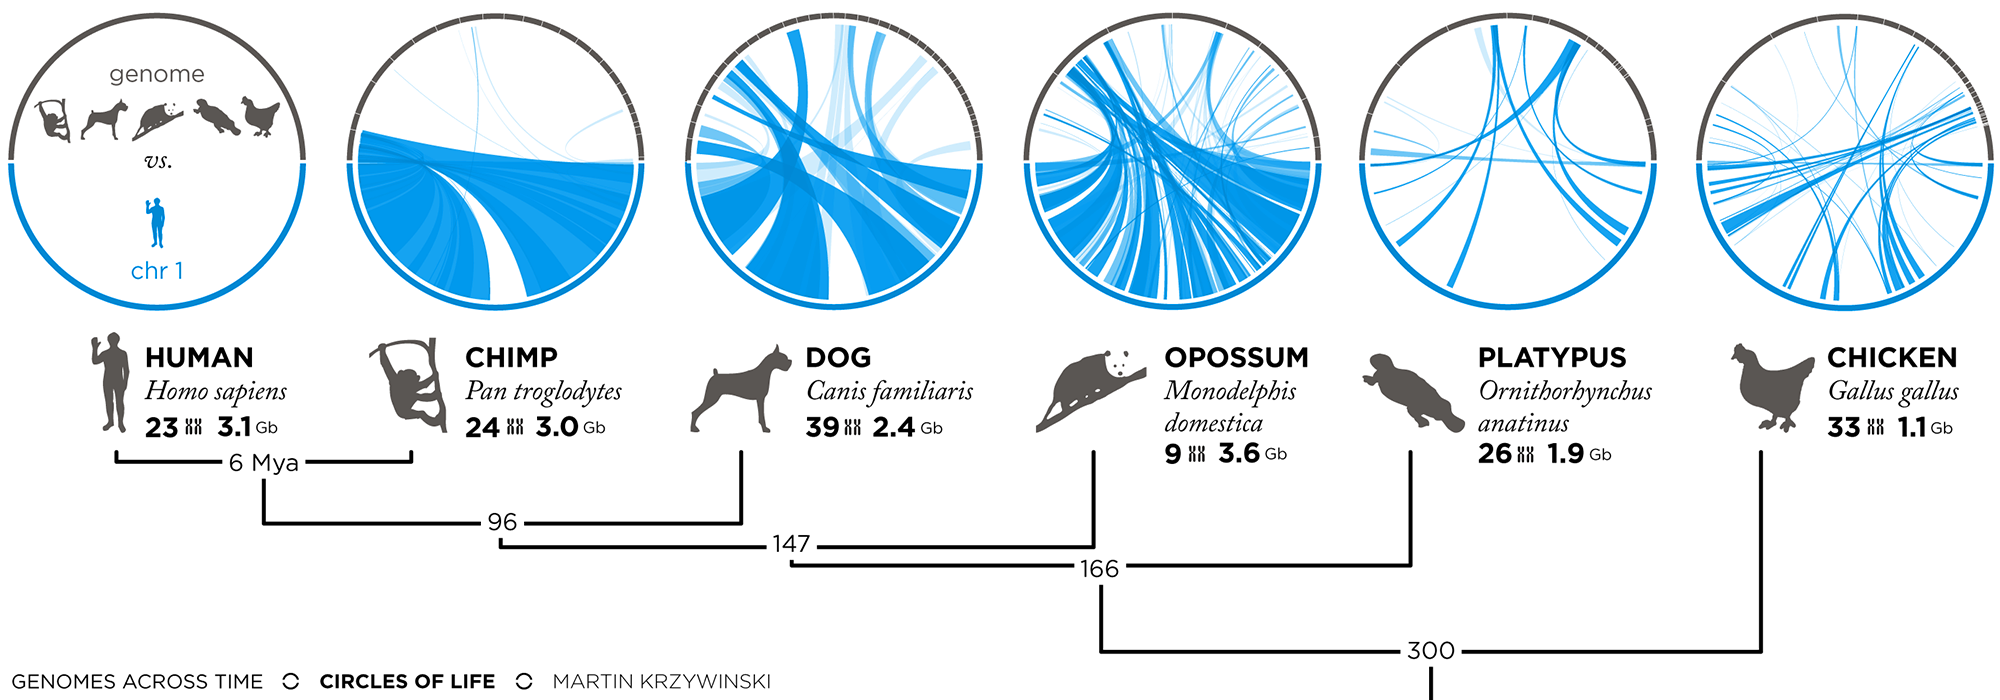
In 2001, the first human genome sequence was published. Now, just over 10 years later, we capable of sequencing a genome in just a few days. Massive parallel sequencing projects now make it possible to study the cancers of thousands of individuals. New data mining approaches are required to robustly interrogate the data for causal relationships among the inherently noisy biology. How does one identify genetic changes that are specific and causal to a disease within the rich variation that is either natural or merely correlated? The problem is one of finding a needle in a stack of needles. I will provide a non-specialist introduction to data mining methods and challenges in genomics, with a focus on the role visualization plays in the exploration of the underlying data.
references
The title of the talk was drawn from the paper
Gregory M. Cooper & Jay Shendure Needles in stacks of needles: finding disease-causal variants in a wealth of genomic data Nature Reviews Genetics 12, 628-640 (September 2011)
I will be posting a full list of references for the talk shortly.
Propensity score weighting
It is not certain that everything is uncertain. —Blaise Pascal
We have already explored how we can mitigate bias caused by confounding variables in observational studies using propensity score (PS) matching (PSM) and propensity score weighting (PSW). However, any statistical model is only as good as its assumptions and, if it is specified incorrectly, it can itself produce biased estimates of the treatment effect.

This month, we explore double robustness, a powerful statistical concept that provides a valuable “safety net” against the risk of an incorrect model. It offers two opportunities, instead of just one, to obtain a valid estimate of the treatment effect — making it possible to draw credible causal inferences from observational data without having to depend on a single set of modeling assumptions.
Kurz, C.F., Krzywinski, M. & Altman, N. (2026) Points of significance: Double Robustness. Nat. Methods 23:868–869.
Nature Biotechnology cover
My cover design on the 7 April 2026 Nature Biotechnology issue shows the dendrogram that represents a cluster of uniquely expressed (or downregulated) genes in human naive stem cells induced from such cells. Within each dendrogram block, the genomic barcode sequence (sampled from Supplementary Table 1) is depicted with a Code 39 barcode. The highlighted barcode is one of those used for cell isolation.
Ishiguro S. et al. A multi-kingdom genetic barcoding system for precise clone isolation (2026) Nature Biotechnology 44:616–629.

Browse my gallery of cover designs.

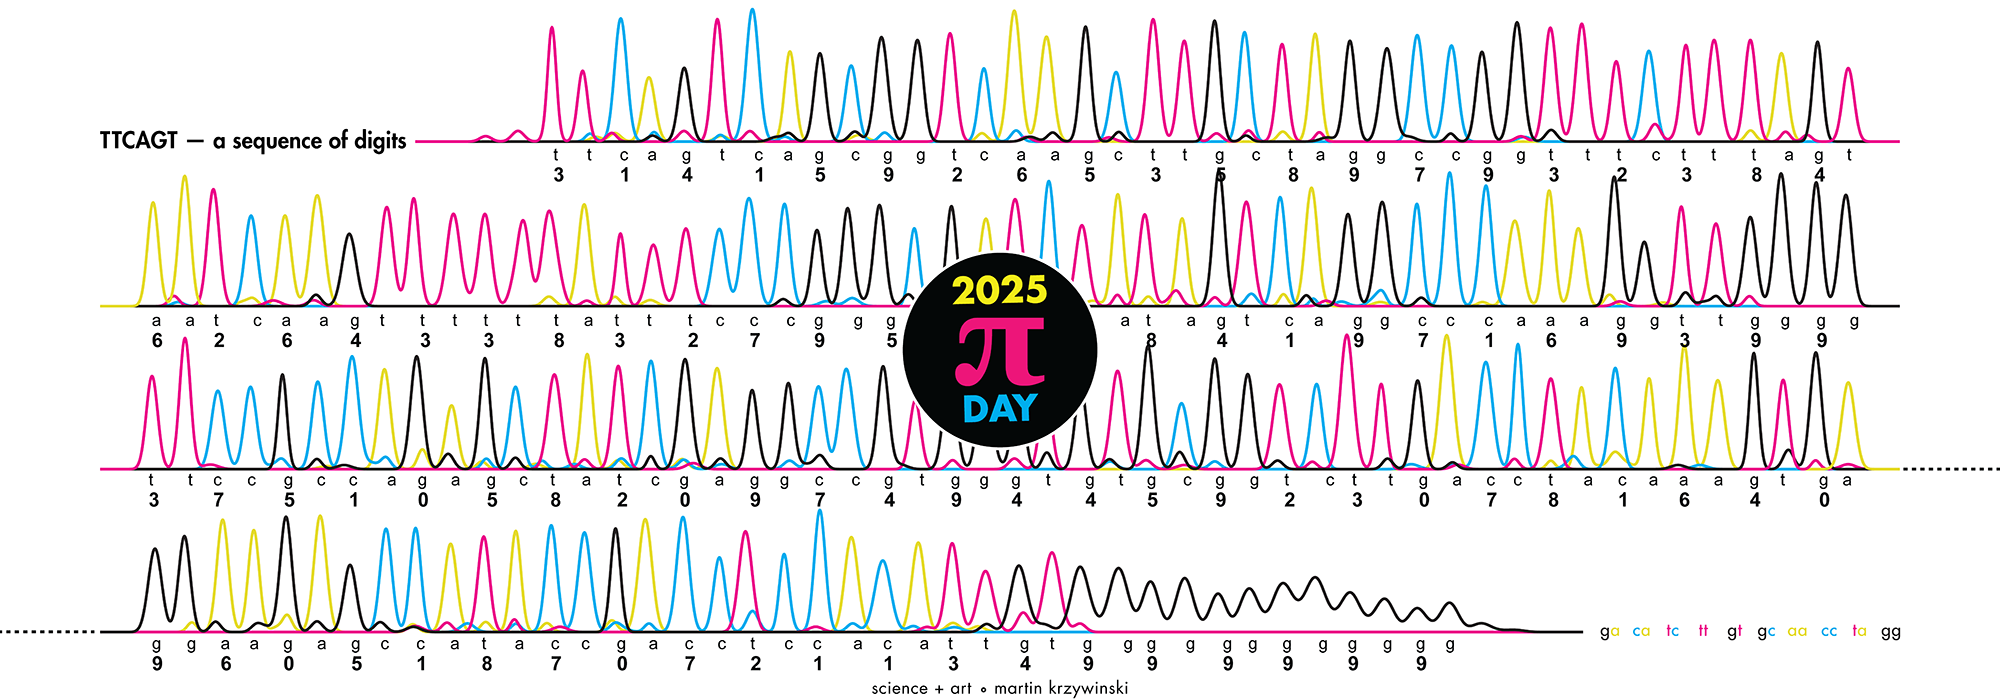
Happy 2026 π Day—
Art for the 5%
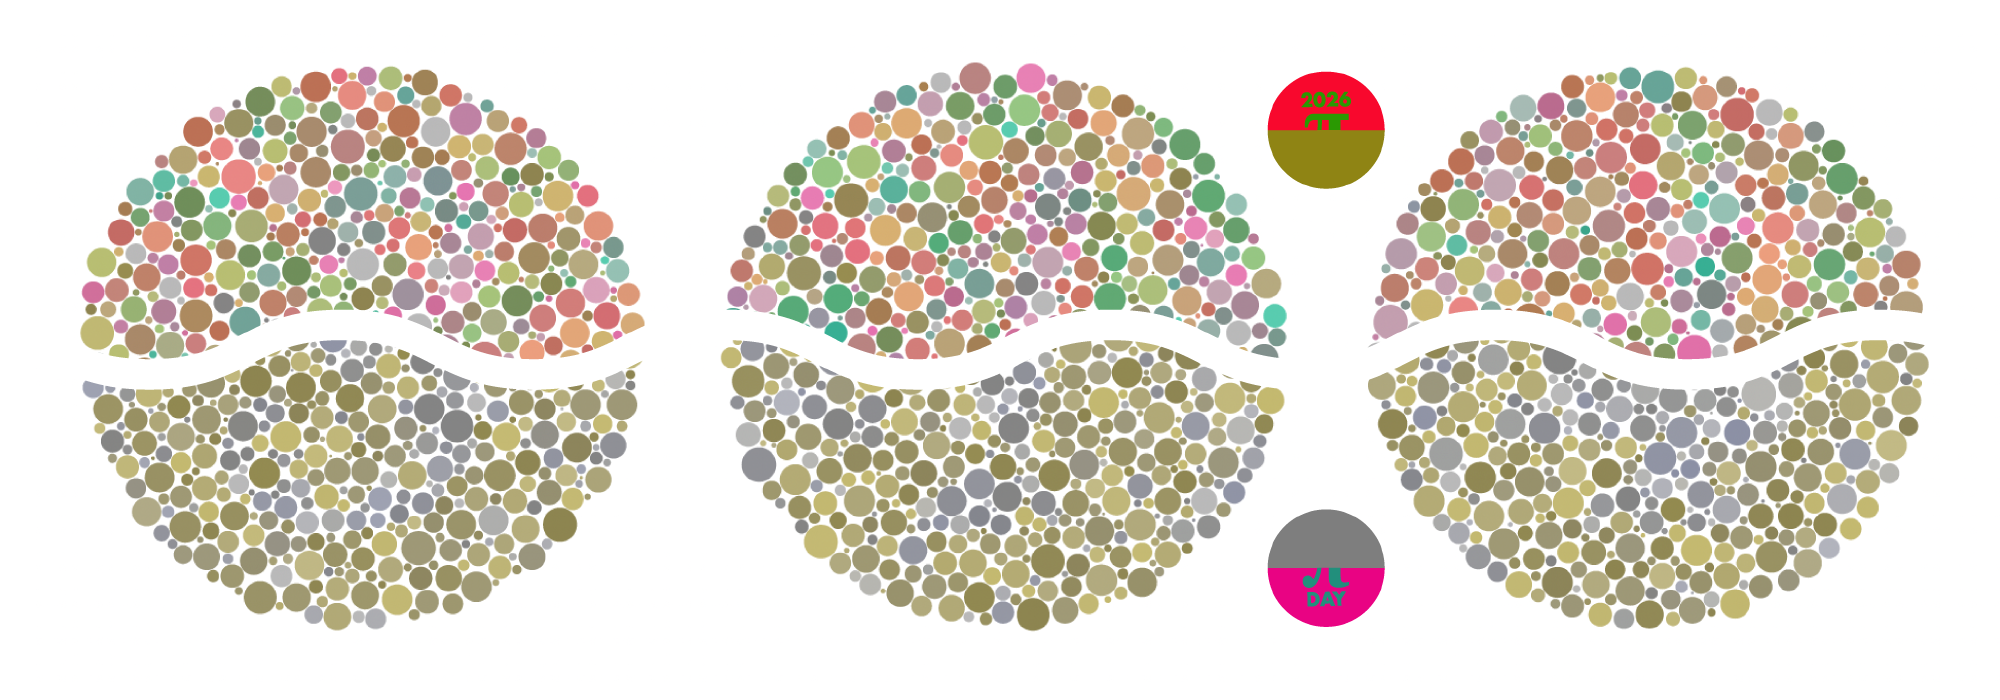
Celebrate π Day (March 14th) and enjoy the art — but only if you're part of the 5%.
Go ahead, see what you can't see.

Ishihara's Tests for Colour Deficiency
Authentic and accurate images of Ishihara's test plates photographed (and lovingly color-corrected) from the 38-plate Ishihara's Tests for Colour Deficiency.
I also provide the position, size, and color of each circle on each test plate.


Symmetric alternatives to the ordinary least squares regression
What immortal hand or eye, could frame thy fearful symmetry? — William Blake, "The Tyger"
This month, we look at symmetric regression, which, unlike simple linear regression, it is reversible — remaining unaltered when the variables are swapped.
Simple linear regression can summarize the linear relationship between two variables `X` and `Y` — for example, when `Y` is considered the response (dependent) and `X` the predictor (independent) variable.
However, there are times when we are not interested (or able) to distinguish between dependent and independent variables — either because they have the same importance or the same role. This is where symmetric regression can help.

Luca Greco, George Luta, Martin Krzywinski & Naomi Altman (2025) Points of significance: Symmetric alternatives to the ordinary least squares regression. Nat. Methods 22:1610–1612.