GSC Branding
Files and the story behind the design
Art is science in love.
— E.F. Weisslitz
contents
- 1 · Logo
- 1.1 · Download logo files
- 1.2 · Lettermark badge
- 1.3 · Lettermark
- 1.4 · Combination mark — vertical, centered
- 1.5 · Combination mark — vertical, centered, tagline
- 1.6 · Combination mark — vertical, left-aligned
- 1.7 · Combination mark — horizontal
- 1.8 · PHSA and GSC Combination mark — vertical, centered
- 1.9 · PHSA and GSC Combination mark — vertical, left-aligned
- 1.10 · PHSA and GSC Combination mark — horizontal
- 1.11 · ASCII
- 1.12 · Story behind the logo
- 2 · Color palette
- 2.1 · Color table
- 2.1.1 · Primary colors
- 2.1.2 · Secondary colors
- 2.1.3 · Tertiary colors
- 2.1.4 · Neutral warm colors
- 2.1.5 · Neutral cool colors
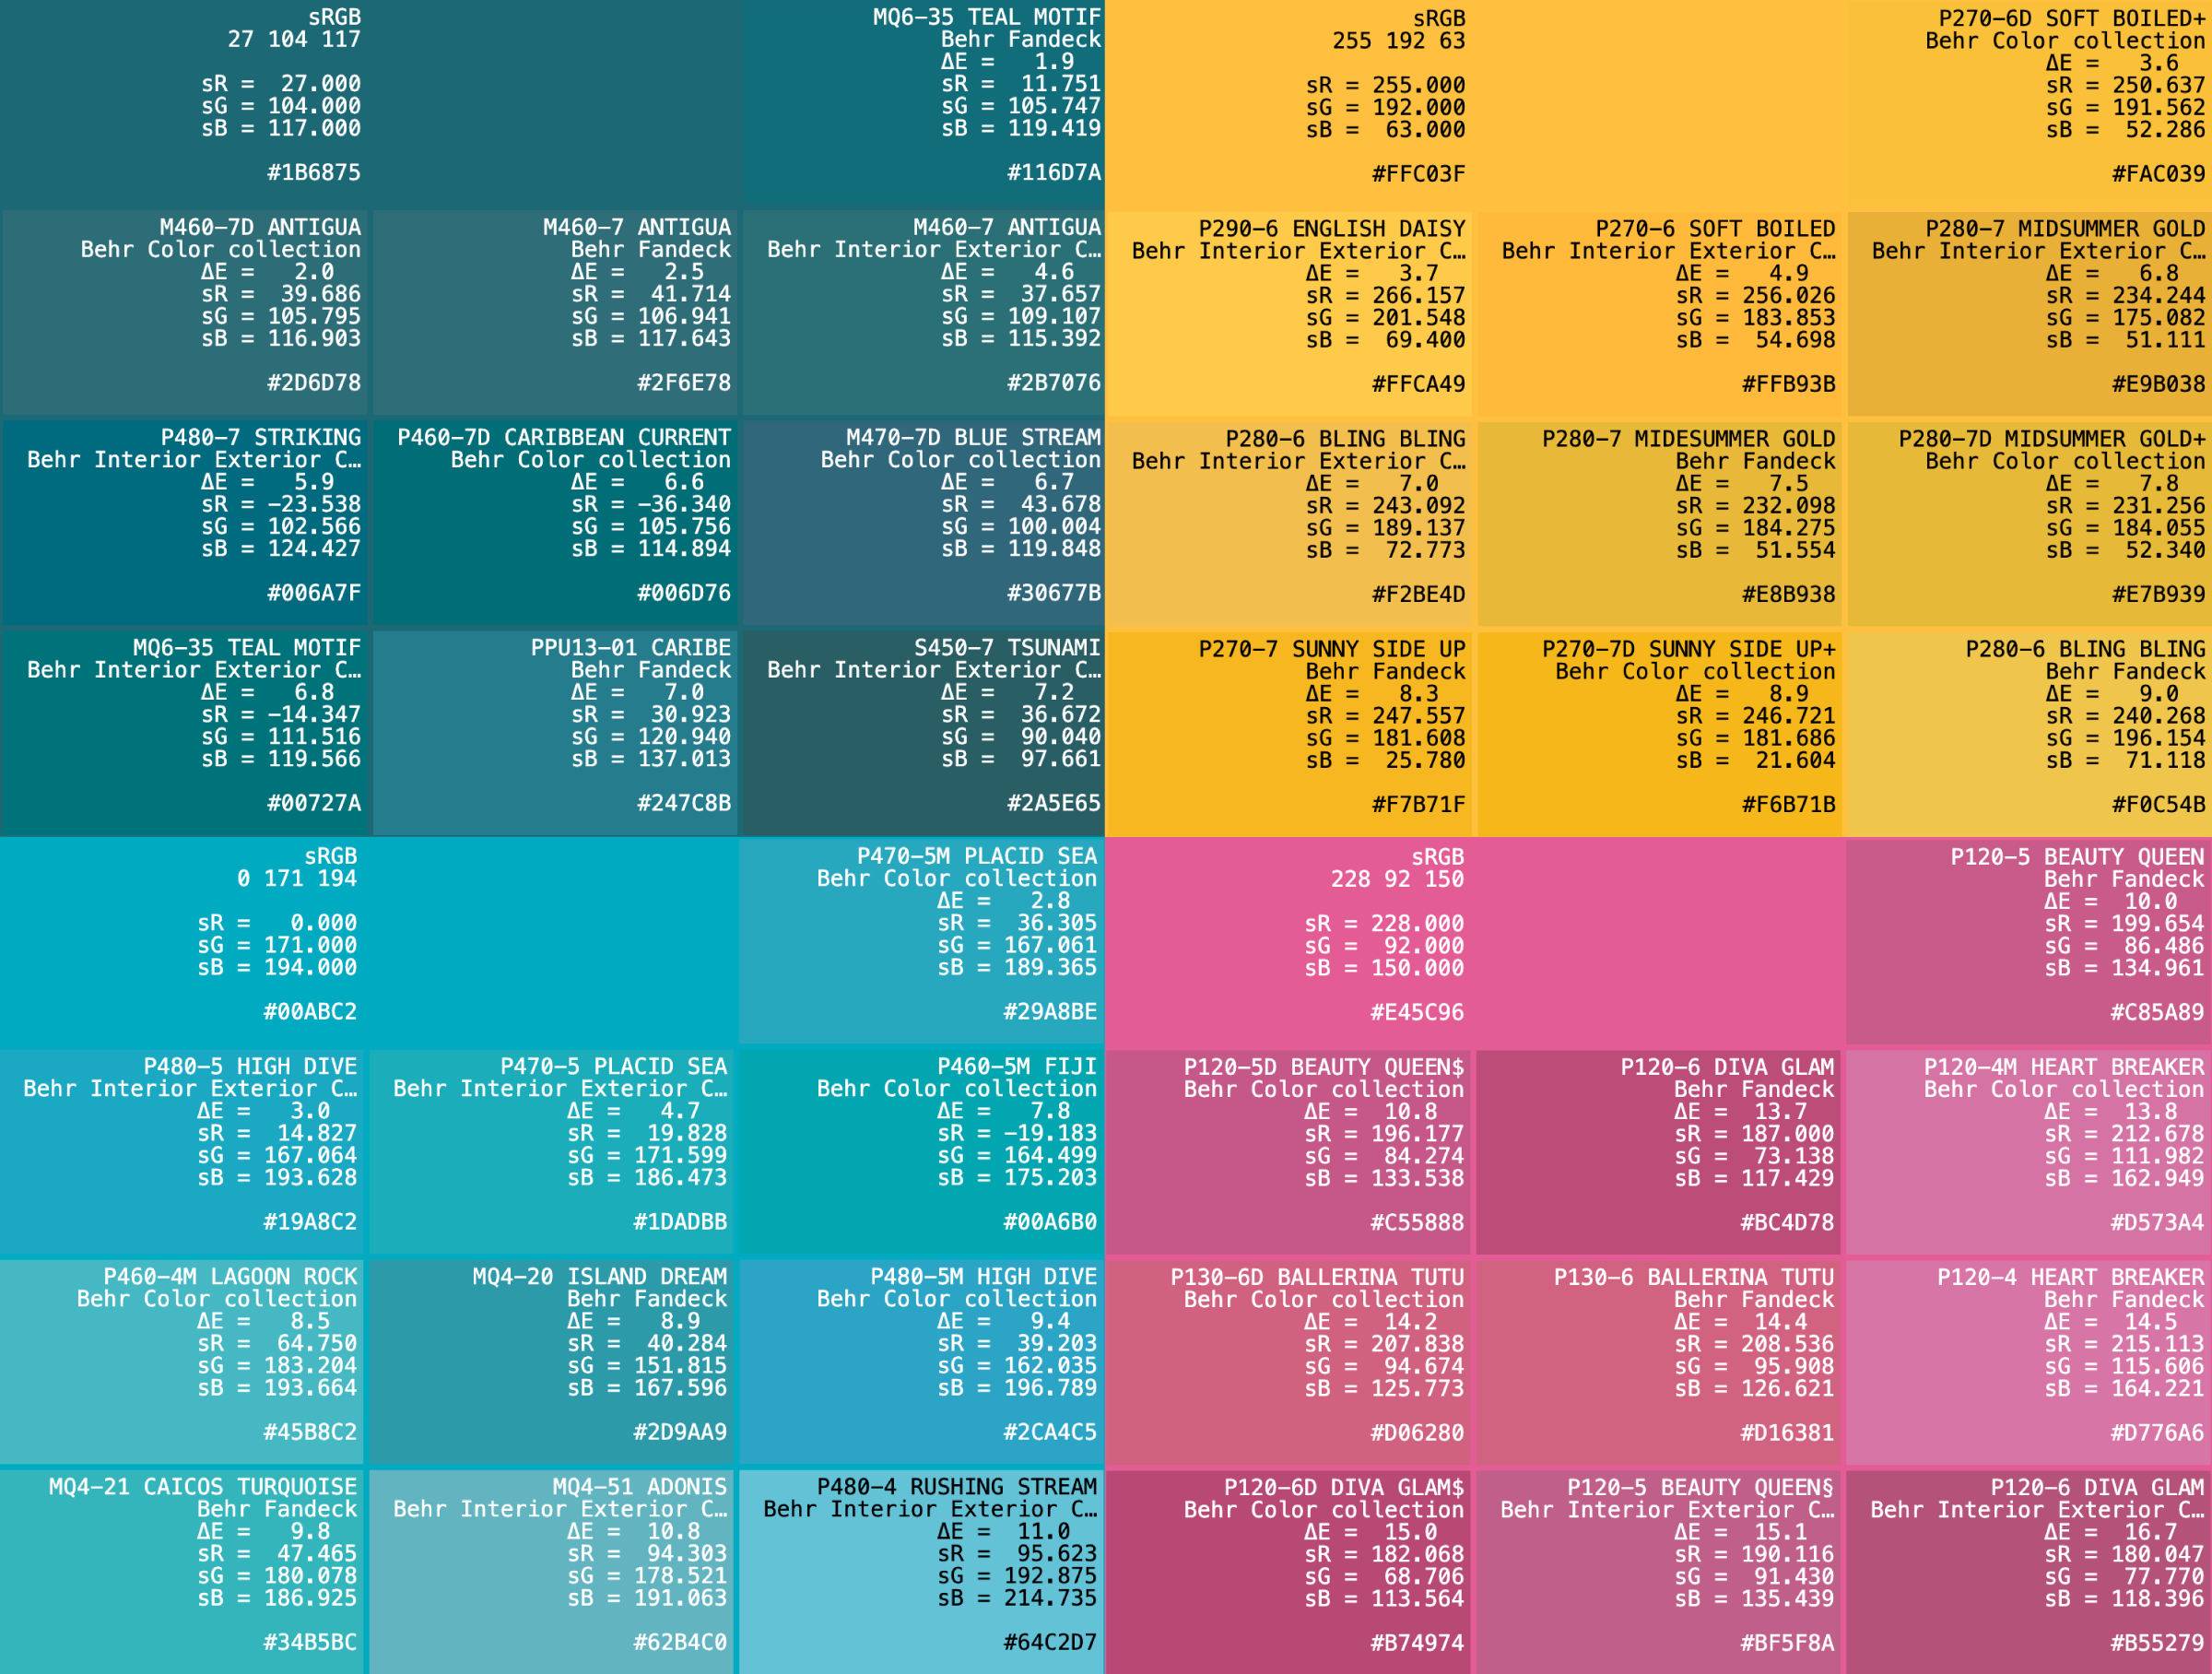
- 2.2 · Wall paint colors
- 2.3 · Download color files
- 3 · Desktop background
There are five logo formats: letterform badge (for tight spaces), letterform, and combination form (vertical centered, vertical left and horizontal).
Don't shrink the artwork. Don't change its aspect ratio.
Each has a minimum size for physical reproduction that ensures that that the combination form font size is at least 8 pt. These sizes are listed below.
At minimum size, the size of the “GSC” letters is
The logo files (PNG 2400dpi, PDF, SVG) for each logo type are provided at the corresponding minimum size.
The only time you need to worry about minimum size is when composing on letter (or smaller) artboards.
Use in tight spaces when the light has gone out.
For normal scenarios.
For cases where a center axis is desired.
For cases where a center axis is desired.
For cases where layout demands a left beginning.
For cases where vertical space is lacking.
For cases where a center axis is desired.
The GSC is a programme of our parent organization, the Provincial Health Services Authority (PHSA).
The PHSA logo is scaled so that the height of the province is the same as the height of the GSC lettermark. For details about PHSA branding, see the PHSA branding guidelines.
For cases where layout demands a left beginning.
For cases where vertical space is lacking.
A variety of ASCII logos: 24 30 38 45 52 60 67 74 80 columns.
Below is the 80-column version of our logo.
         .^7J5PGGP5?~:          .^7J5PGGPY?~:          .^7J5PGGPY?~.
       ~P&@@@@@@@@@@@@@@#J:   ~P&@@@@@@@@@@@@@@#J.   ~P&@@@@@@@@@@@@@@B?.
    .5@@@@@@@@@@@@@@@@@@@@@#P@@@@@@@@@@@@@@@@@@@@@#P@@@@@@@@@@@@@@@@@@@@@#~
   J@@@@@@@@@@@@@@@@@@@@@@@@@@@@@@@@@@@@@@@@@@@@@@@@@@@@@@@@@@@@@@@@@@@@@@@#:
  #@@@@@@@@@@@@@@@@@@@@@@@@@@@@@@@@@@@@@@@@@@@@@@@@@@@@@@@@@@@@@@@@@@@@@@@@@@7
 #@@@@@@@@@@@P!^::~?#@@@@@@@@@@@@@@@P!^::~J#@@@@@@@@@@@@@@@P!^::~J#@@@@@@@@@@@~
7@@@@@@@@@@5         :&@@@@@@@@@@@Y         :&@@@@@@@@@@@Y         ^&@@@@@@@@@&
#@@@@@@@@@G           .@@@@@@@@@@P           .@@@@@@@@@@5           .@@@@@@@@@@^
&@@@@@@@@@7            #@@@@@@@@@!            &@@@@@@@@@!            &@@@@@@@@@~
&@@@@@@@@@7                                   &@@@@@@@@@!            &@@@@@@@@@~
&@@@@@@@@@7                                   &@@@@@@@@@!            &@@@@@@@@@~
&@@@@@@@@@7                                   &@@@@@@@@@!            &@@@@@@@@@~
&@@@@@@@@@7            #@@@@@@@@@!            &@@@@@@@@@!            &@@@@@@@@@~
&@@@@@@@@@7            &@@@@@@@@@7            &@@@@@@@@@!             .........
&@@@@@@@@@7            &@@@@@@@@@7             .~JG&@@@@!
&@@@@@@@@@7            &@@@@@@@@@7                  .7B@!
&@@@@@@@@@7            B@@@@@@@@@#                     .
&@@@@@@@@@7            ^@@@@@@@@@@&~
&@@@@@@@@@7             Y@@@@@@@@@@@@B5YJJ7~:
&@@@@@@@@@7              J@@@@@@@@@@@@@@@@@@@@&P~
&@@@@@@@@@7               :#@@@@@@@@@@@@@@@@@@@@@@G:
&@@@@@@@@@7                 ^G@@@@@@@@@@@@@@@@@@@@@@G.
&@@@@@@@@@7                    ^YB&@@@@@@@@@@@@@@@@@@@~
&@@@@@@@@@7                        .:^~~!?P&@@@@@@@@@@@^
&@@@@@@@@@7                                 !@@@@@@@@@@&
&@@@@@@@@@7                                  :@@@@@@@@@@^
&@@@@@@@@@7                                   &@@@@@@@@@!
&@@@@@@@@@7                                   &@@@@@@@@@!
&@@@@@@@@@7     .###############&~            &@@@@@@@@@!
&@@@@@@@@@7     :@@@@@@@@@@@@@@@@7            &@@@@@@@@@!
&@@@@@@@@@7     :@@@@@@@@@@@@@@@@7            &@@@@@@@@@!            ~!!!!!!!!!.
&@@@@@@@@@7     :@@@@@@@@@@@@@@@@7            &@@@@@@@@@!            @@@@@@@@@@!
&@@@@@@@@@7     :@@@@@@@@@@@@@@@@7            &@@@@@@@@@!            &@@@@@@@@@!
&@@@@@@@@@7      ......&@@@@@@@@@7            &@@@@@@@@@!            #@@@@@@@@@~
&@@@@@@@@@7            &@@@@@@@@@7            &@@@@@@@@@!
&@@@@@@@@@7            &@@@@@@@@@7            &@@@@@@@@@!
&@@@@@@@@@7            &@@@@@@@@@7            &@@@@@@@@@!
&@@@@@@@@@7            &@@@@@@@@@7            &@@@@@@@@@!            &@@@@@@@@@~
&@@@@@@@@@?            &@@@@@@@@@7            &@@@@@@@@@!            @@@@@@@@@@~
G@@@@@@@@@#           ~@@@@@@@@@@#           ~@@@@@@@@@@#           !@@@@@@@@@@:
^@@@@@@@@@@&~       .J@@@@@@@@@@@@#^       .Y@@@@@@@@@@@@#^       .Y@@@@@@@@@@#
 Y@@@@@@@@@@@&B5JYP#@@@@@@@@@@@@@@@@&B5JYP#@@@@@@@@@@@@@@@@&B5JYP#@@@@@@@@@@@@.
  J@@@@@@@@@@@@@@@@@@@@@@@@@@@@@@@@@@@@@@@@@@@@@@@@@@@@@@@@@@@@@@@@@@@@@@@@@&.
   :#@@@@@@@@@@@@@@@@@@@@@@@@@@@@@@@@@@@@@@@@@@@@@@@@@@@@@@@@@@@@@@@@@@@@@@J
     ^G@@@@@@@@@@@@@@@@@@@&J^G@@@@@@@@@@@@@@@@@@@&?~G@@@@@@@@@@@@@@@@@@@&?.
        ~5#&@@@@@@@@@@&G?:     ~5#&@@@@@@@@@@&G?:     ~5#@@@@@@@@@@@&G?.
            .:^~!~~^.              .:^~~~~^.              .:^~~~~^.
Our logo is based on the geometry of human chromosome 19.
This chromosome contains many genes essential to all forms of life and is our most conserved chromosome across species.
It is also most densely packed with genes that are causally implicated in cancer and listed in the Cancer Gene Census. The chromosome has 6% of CGC genes (43/759) but comprises only 2% of the genome. Its CGC gene density is 0.73 genes/Mb — 130% denser than the next densest chromosome (17).
Read the full story behind the design.
Energetic, but grounded.
I've selected the colors based on how they look in my Pantone Solid Uncoated (PMS U) color book.
Lab and RGB values are from Pantone Solid Uncoated v5. CMYK conversions are from Pantone Bridge Uncoated (UP) v5.

LCH is cylindrical Lab. You can use this space to alter perceptual lightness (L) and saturation (chroma, C) for applications where quantitative mapping to color is needed.
For logos, titles and top-level backgrounds.
4 shades of primary colors for accents.
For accents.
For contrast.
For cozy gray days.
For rainy gray days.
Paint your walls with GSC colors.
Propensity score weighting
It is not certain that everything is uncertain. —Blaise Pascal
We have already explored how we can mitigate bias caused by confounding variables in observational studies using propensity score (PS) matching (PSM) and propensity score weighting (PSW). However, any statistical model is only as good as its assumptions and, if it is specified incorrectly, it can itself produce biased estimates of the treatment effect.

This month, we explore double robustness, a powerful statistical concept that provides a valuable “safety net” against the risk of an incorrect model. It offers two opportunities, instead of just one, to obtain a valid estimate of the treatment effect — making it possible to draw credible causal inferences from observational data without having to depend on a single set of modeling assumptions.
Kurz, C.F., Krzywinski, M. & Altman, N. (2026) Points of significance: Double Robustness. Nat. Methods 23:868–869.
Nature Biotechnology cover
My cover design on the 7 April 2026 Nature Biotechnology issue shows the dendrogram that represents a cluster of uniquely expressed (or downregulated) genes in human naive stem cells induced from such cells. Within each dendrogram block, the genomic barcode sequence (sampled from Supplementary Table 1) is depicted with a Code 39 barcode. The highlighted barcode is one of those used for cell isolation.
Ishiguro S. et al. A multi-kingdom genetic barcoding system for precise clone isolation (2026) Nature Biotechnology 44:616–629.

Browse my gallery of cover designs.

Happy 2026 π Day—
Art for the 5%
Celebrate π Day (March 14th) and enjoy the art — but only if you're part of the 5%.
Go ahead, see what you can't see.

Ishihara's Tests for Colour Deficiency
Authentic and accurate images of Ishihara's test plates photographed (and lovingly color-corrected) from the 38-plate Ishihara's Tests for Colour Deficiency.
I also provide the position, size, and color of each circle on each test plate.


Symmetric alternatives to the ordinary least squares regression
What immortal hand or eye, could frame thy fearful symmetry? — William Blake, "The Tyger"
This month, we look at symmetric regression, which, unlike simple linear regression, it is reversible — remaining unaltered when the variables are swapped.
Simple linear regression can summarize the linear relationship between two variables `X` and `Y` — for example, when `Y` is considered the response (dependent) and `X` the predictor (independent) variable.
However, there are times when we are not interested (or able) to distinguish between dependent and independent variables — either because they have the same importance or the same role. This is where symmetric regression can help.

Luca Greco, George Luta, Martin Krzywinski & Naomi Altman (2025) Points of significance: Symmetric alternatives to the ordinary least squares regression. Nat. Methods 22:1610–1612.