| Packages Used |
ptkdb: https://www.perl.com/CPAN/authors/id/A/AE/AEPAGE/ |
Many modern programming languages have debuggers, which let you examine the internals of your program as it runs. You can query the contents of variables to see how they change, or monitor how often a subroutine is called. My debugger, ptkdb, is a visual debugger. It lets you examine a variable's contents by moving your cursor over it, and it lets you set breakpoints with the click of a mouse. (A breakpoint is a position in your program where the debugger stops execution and lets you inspect your program's data structures.)
There are other visual debuggers for Perl. SolutionSoft and ActiveState each make one, but they're only for Windows, and they're not free, like ptkdb. Because ptkdb is written in Perl/Tk, it works on all flavors of Unix as well as Windows. Figure 1 shows ptkdb in action.
Figure 1
Perl's Debugger
Perl already has a built-in debugger. It's part of the standard distribution, and it's
line-oriented
- you type your commands, and you see a command prompt as you step through your program line by line, or when you hit a breakpoint. You invoke the debugger as follows:
perl -d myprogram.pl
Or, to enter the debugger directly without a program at all,
perl -de 0
This is handy if you just want to execute a series of Perl statements without creating an actual program.
When you run a program with the -d switch, Perl stops at the first line of code and displays a prompt. You can find out all of the options by typing h for help. Perl's debugger might be all you ever need, but if you want the convenience of a graphical debugger, you can install ptkdb.
Installing ptkdb
ptkdb can be downloaded and installed from the CPAN at
https://www.perl.com/CPAN/authors/id/A/AE/AEPAGE/
. The archive contains all the files needed to install ptkdb; you can use either the usual module installation process:
    perl Makefile.PL
    make
    make test
    make install
Or, you can use the install_ptkdb.pl program, which uses a Perl/Tk user interface to guide you through the process.
If you're unable to install ptkdb into your system's Perl library, you can run ptkdb from the directory where you invoke Perl:
    cd myprogramdir
    mkdir Devel
    cp ptkdb.pm Devel
    perl -d:ptkdb myprogram.pl
Running ptkdb
Once ptkdb has been installed, you can debug your programs with it like so:
perl -d:ptkdb myprogram.pl
The ptkdb window will appear and the first executable line of your program will be highlighted. At this point the debugger has stopped the program and is waiting for your command. If you use #!/usr/bin/perl (or an equivalent) to invoke your Perl program, you can add the -d:ptkdb immediately afterwards to invoke the debugger from inside the program.
Code Pane
The left pane of the window is the
code pane
, which displays the Perl program that you're debugging. When the debugger hits a breakpointed line of code, this window automatically opens to the file and highlights the line. If you click on the line numbers along the side you can add or remove breakpoints. By default, lines with breakpoints are red. Breakpoints can be disabled in the
Brkpts
control panel by pushing the appropriate checkbox; disabled breakpoints are green. Lines that are not breakable have lines through them.
Getting Around
ptkdb has several tools that allow you to navigate your code. At the top of the Code window there is a text entry with
Goto
,
Search
, and
Regex
buttons. If you enter a line number into text box and press the
Goto
button, the program scrolls to that line. You can search for text with the
Search
box, and specify a search pattern with the
Regex
button. These features can be helpful for finding your way around programs written by others. (The searching and regular expression features are part of the Tk::Text widget that comes with Perl/Tk.)
Expression Window
The Expression window (the
Exprs
tab in the notebook to the right of the code) presents a list of expressions. Expressions can be typed into the
Enter Expr:
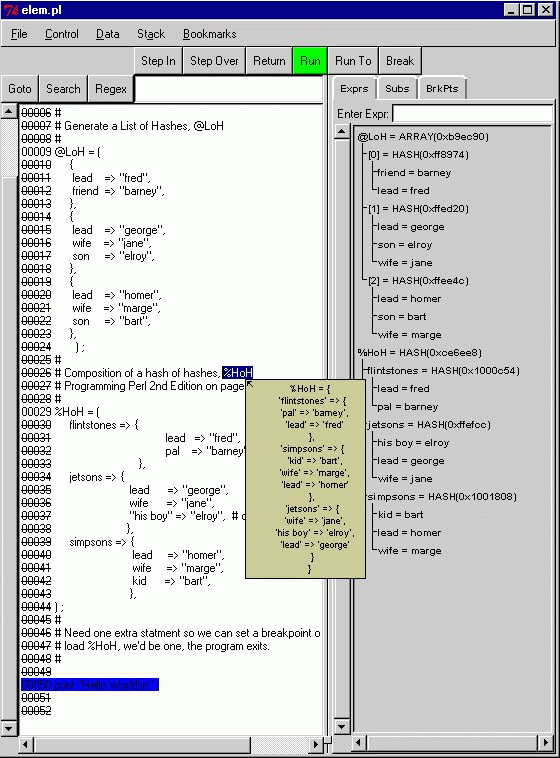
field and then listed as a hierarchical list. Every time the debugger interrupts program execution, the list of expressions will be reevaluated and displayed as shown in
Figure 2
. Double clicking on an array or hash hides and unhides its members. Entries can be deleted with the
Delete Expression
button in the
Data
menu, or with Ctrl-D. Another way of displaying data (for Tk800 and above) is through
hot variable balloons
. When the debugger stops and you position the cursor over a variable such as
$var
,
%var
, or
@var
and leave it there for a second, a text balloon pops up displaying the value. If you have text selected, it evaluates the selected text as an expression and displays the result. If you have Gurusamy Sarathy's Data::Dumper module (included with Perl 5.005), it formats the contents of the variable.
Figure 1
Subs Panel
The
Subs
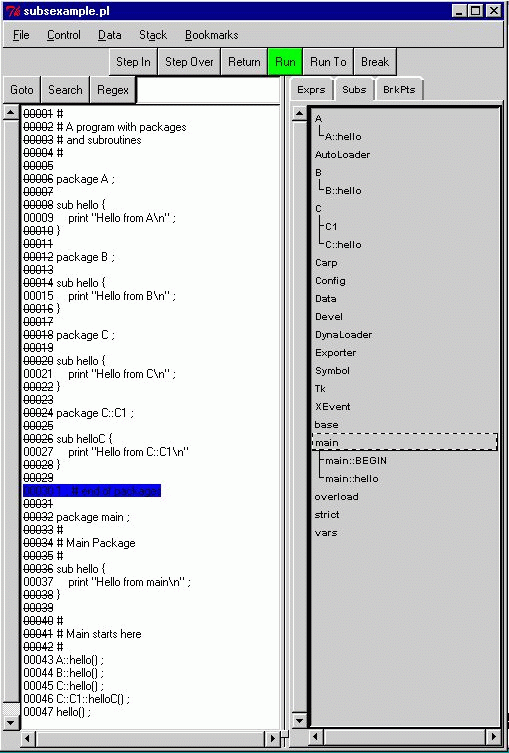
tab of the notebook brings up the subroutine panel, shown in
Figure 3
. This panel lists all of your modules and subroutines, displayed as a hierarchical list. This list is usually pretty long because of the Perl/Tk modules included by ptkdb, but you should be able to find your own packages easily. The subroutines are always listed with their fully qualified names, for example:
main::mySub()
.
Figure 3
Breakpoints
Clicking the
BrkPts
tab displays the breakpoint control panel (
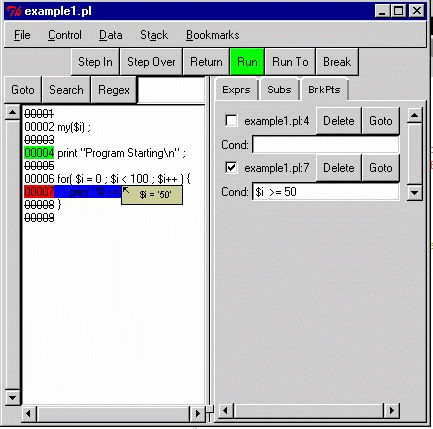
Figure 4
), which provides a list of the breakpoints you've set. The checkbox lets you disable a breakpoint, and there are control buttons to delete the breakpoint and visit the breakpoint's location in the code. The entry box is for a controlling expression; whenever the program reaches the breakpoint, the debugger evaluates the expression. If the expression is true, the debugger stops the program there to let you examine the program's variables.
Figure 4
Saving Configurations
Breakpoints and their conditions can be saved between runs of the program: just use the
Save Config...
item under the
File
menu. If you use the name provided by the dialog box your configuration will automatically be reloaded the next time the program starts up. ptkdb will also do its best to put the breakpoints back on the same lines, even if you've changed the program in the interim.
Customizing ptkdb: Startup Files and X resources
When ptkdb launches, it checks for three startup files: a system startup file, a user startup file in your home directory, and a startup file in the directory from which Perl was started. Each of these files can contain a Perl program that will be run before the debugger stops at the first line of the program. ptkdb also provides functions that can be called to set breakpoints, set conditions, enter expressions, and customize the text in the code pane. Refer to the ptkdb pod documentation for details.
If you're using the X window system, you can customize fonts and colors with X resources. This includes fonts and colors; see your system's xrdb documentation for instructions. Windows users can now add X resources if their version of Perl/Tk is 800.012 or higher. Fonts can be selected with the xfontsel utility.
For example, say you wish to change the font that the code is displayed in. Open the .Xdefaults or .Xresources file in your $ENV{'HOME'} directory and add the following line: ptkdb.frame2.frame1.rotext.font: fixed. (Change fixed to whatever font specification you would like to use.) Other fonts can be set individually, or you can use ptkdb*font to specify all of them. The documentation contains a commented example section of .Xdefaults that you can use as a guide.
Debugging Web Programs with ptkdb
One of the most valuable features of ptkdb is that it can be used to debug Perl CGI pages as they run on a web server. In fact, if your server is Unix, you can use ptkdb to debug these programs across a network.
In order to use ptkdb with your web server you have to have Perl/Tk and ptkdb installed in the same place that your server is getting its Perl libraries from, which isn't always the case in some installations. If all else fails, you can always create your own private installation of Perl (called, say, myperl), Perl/Tk, and ptkdb - about 18 meg in all. If you are going to be debugging on a different workstation than the web server using X, make sure that the web server has permissions to open XWindows on your workstation; typically this just requires you to type xhost +webserverName.
At the top of your CGI program you probably have a line such as this:
#!/myperlPath/perl
Change it to:
#!/myperlPath/perl -d:ptkdb
If you're on a different workstation than the web server you'll have to add this subroutine to the beginning of your CGI file:
    sub BEGIN {
        $ENV{'DISPLAY'} = 'myWorkStation:0.0';
    }
This subroutine will be executed before the debugger is invoked, setting the display to your workstation for the ptkdb debugging window to appear. Once all of this is set up, open the web page that invokes your CGI program. It will take a few seconds for the debugger to load and bring up the window. When the window opens on your workstation, you're ready to debug.
The Future of ptkdb
Many people have volunteered to add features to ptkdb; while these offers of assistance are appreciated, ptkdb has enough major features installed for now; I'm more concerned with keeping it stable and reliable.
The current plan is to allow version 1.10X to mature and stabilize. Bugs will be fixed and minor incremental improvements added. Version 1.2 will provide listings of lexical variables, better Perl/Tk application debugging, and perhaps actions or watchpoints, if enough people ask for them. Once these have been added, tested, and deployed, ptkdb 1.2 may find its way into the Perl/Tk distribution, if the Perl/Tk group is willing.
Version 2.0 is being planned: a top to bottom rewrite of the entire system. The goal is to let third parties add independent modules to ptkdb. This would open up the ptkdb project to people who wish to contribute in a way that won't chain ptkdb to the success or failure of their individual efforts.


