2026 π Day latest news buy art
listen; there's a hell of a good universe next door: let's go.e.e. cummingsgo theremore quotes
very clickable
genomes + time
I visually track the progress of the human genome assembly from its inception in 2000 to the gapless telomere-to-telomere CHM13v2 assembly. The graphic was published in Scientific American Graphic Science.
Explore how a great deal of data turns into a story.

Circles of Life

Genomes across time

I am the daughter of the earth and water,
And the nursling of the sky;
I pass through the pores of the ocean and shores;
I change, but I cannot die.
— Percy Bysshe Shelley (The Cloud)
Martin Krzywinski @MKrzywinski mkweb.bcgsc.ca
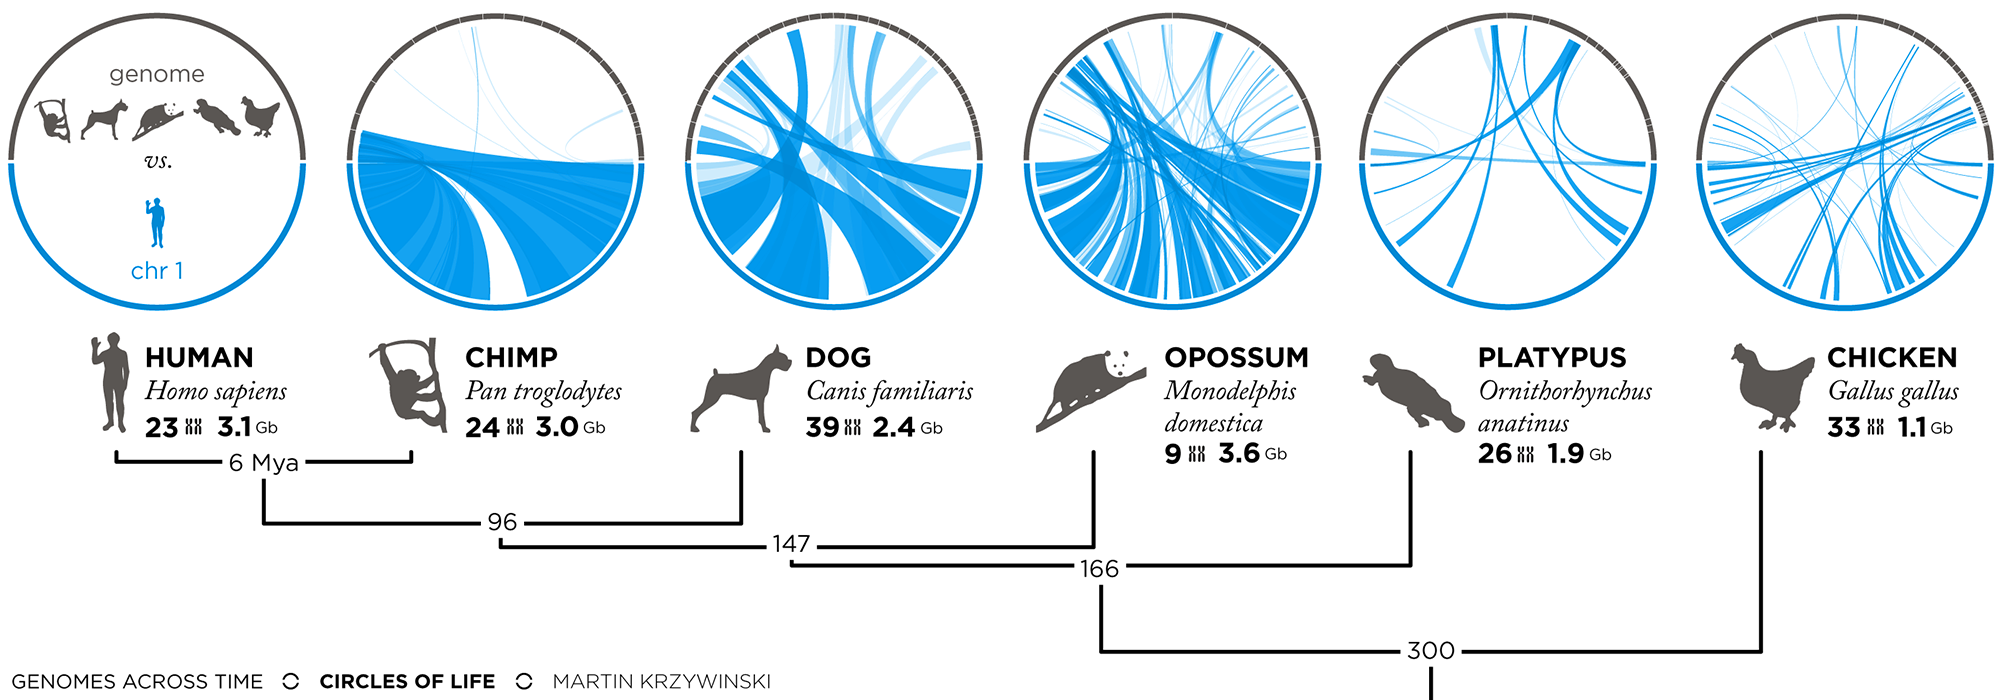
CIRCLES OF LIFE — GENOMES ACROSS TIME | A comparison of human chromosome 1 (bottom of circle, blue) with the genomes of chimp, dog, opossum, platypus, and chicken (top of circle, grey). Ribbons inside the circle connect regions with high sequence similarity.

Time brings change — and genomic mutations. We can see this when we compare genomes of different species — the older their common ancestor, the greater the accumulated differences, and the lower the overall similarity in their genomes.

The Circles of Life — Genomes across time poster shows this idea at a glance by visualizing comparisons between the human (Homo sapiens) genome and the genome of five other species: chimp (Pan troglodytes), dog (Canis familiaris), opossum (Monodelphis domestica), platypus (Ornithorhynchus anatinus), and chicken (Gallus gallus).

buy artwork Circles of Life — Genomes Across Time: Chicken vs. Human by Martin Krzywinski
CIRCLES OF LIFE — GENOMES ACROSS TIME | 300 millions of evolution on a wall. Your wall?. (buy artwork / see all my art)

1 · Circles of life

Visualizing differences (or similarities) between genomes is difficult — the genomes themselves are large (billions of bases) and their differences are numerous (millions) and varied in size (from 1 to 1000's of bases).

One way to approach drawing compact representations of differences is to use my Circos software, which was designed for this task.

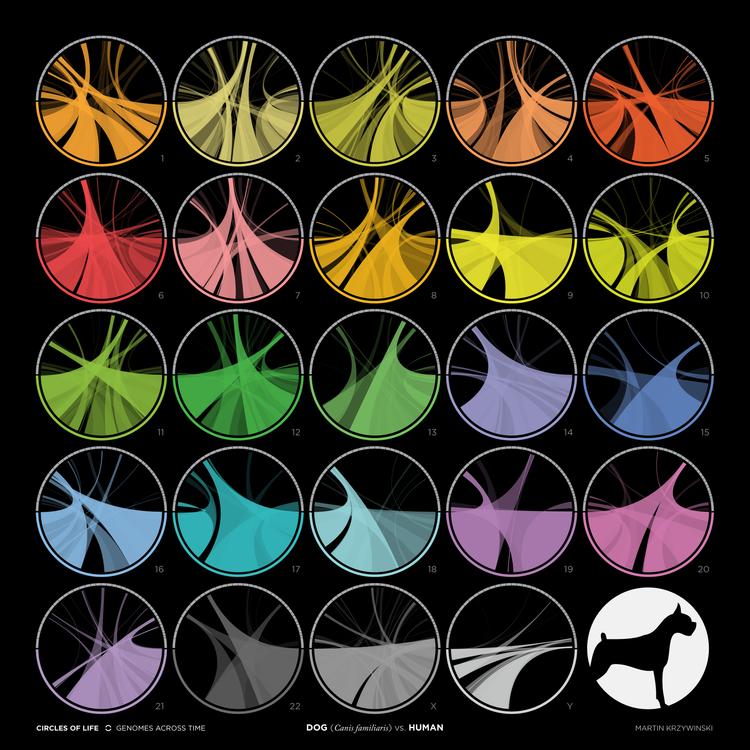
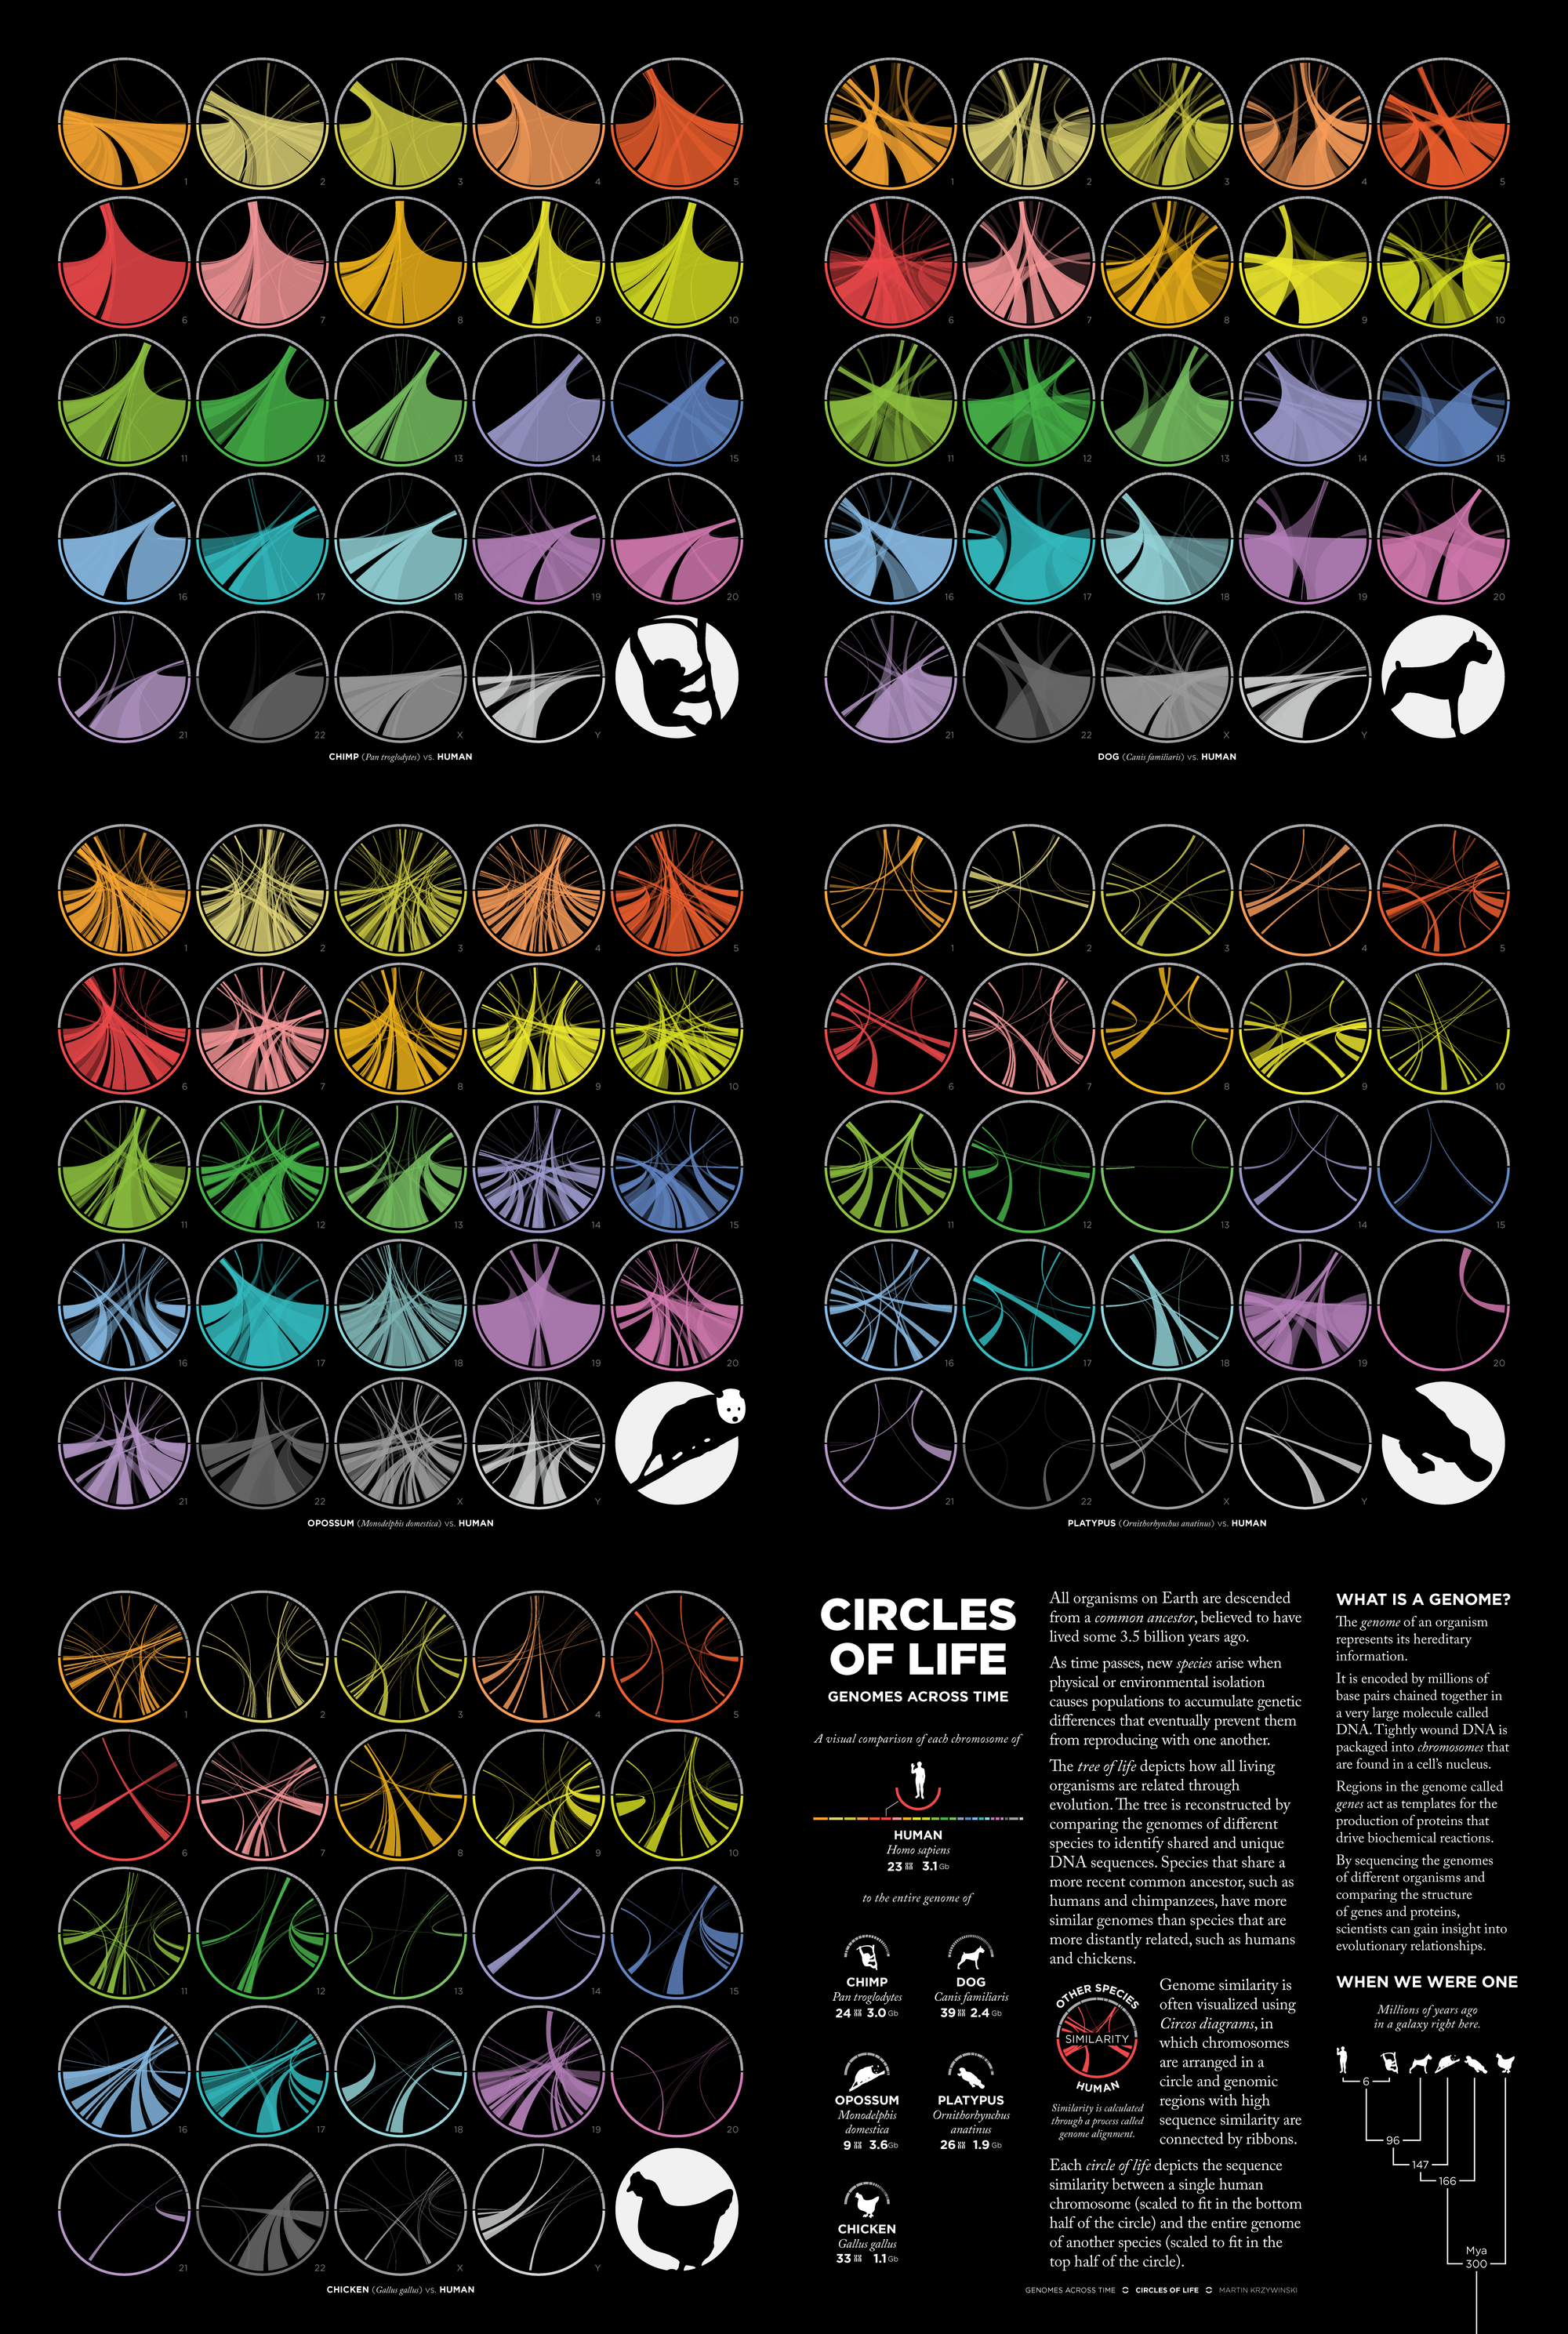
The circles on the poster are grouped into 5 pairwise comparisons. Within each group (e.g., chimp), there are 24 circles. Each circle compares a human chromosome (1, 2, 3, ...) to the entire genome of another organism (e.g., chimp). Within the circle the ribbons indicate regions of high sequence similarity.

As time passes — here, meaning the further back in time the pair shared a common ancestor — the sequence similarities fade.

Martin Krzywinski @MKrzywinski mkweb.bcgsc.ca buy artwork
CHIMP VS. HUMAN
Martin Krzywinski @MKrzywinski mkweb.bcgsc.ca buy artwork
DOG VS. HUMAN
Martin Krzywinski @MKrzywinski mkweb.bcgsc.ca buy artwork
OPOSSUM VS. HUMAN
Martin Krzywinski @MKrzywinski mkweb.bcgsc.ca buy artwork
PLATYPUS VS. HUMAN
Martin Krzywinski @MKrzywinski mkweb.bcgsc.ca buy artwork
CHICKEN VS. HUMAN

It takes a few minutes to get used to this way of depicting data — the interpretive panel (see below) guides you through the visualization.

Visual representations of differences in SARS Cov-2 genomes across variants.
Explore how a great deal of data turns into a story.

2 · Exhibit at British Library

2.1 · Beautiful Science: Picturing Data, Inspiring Insight

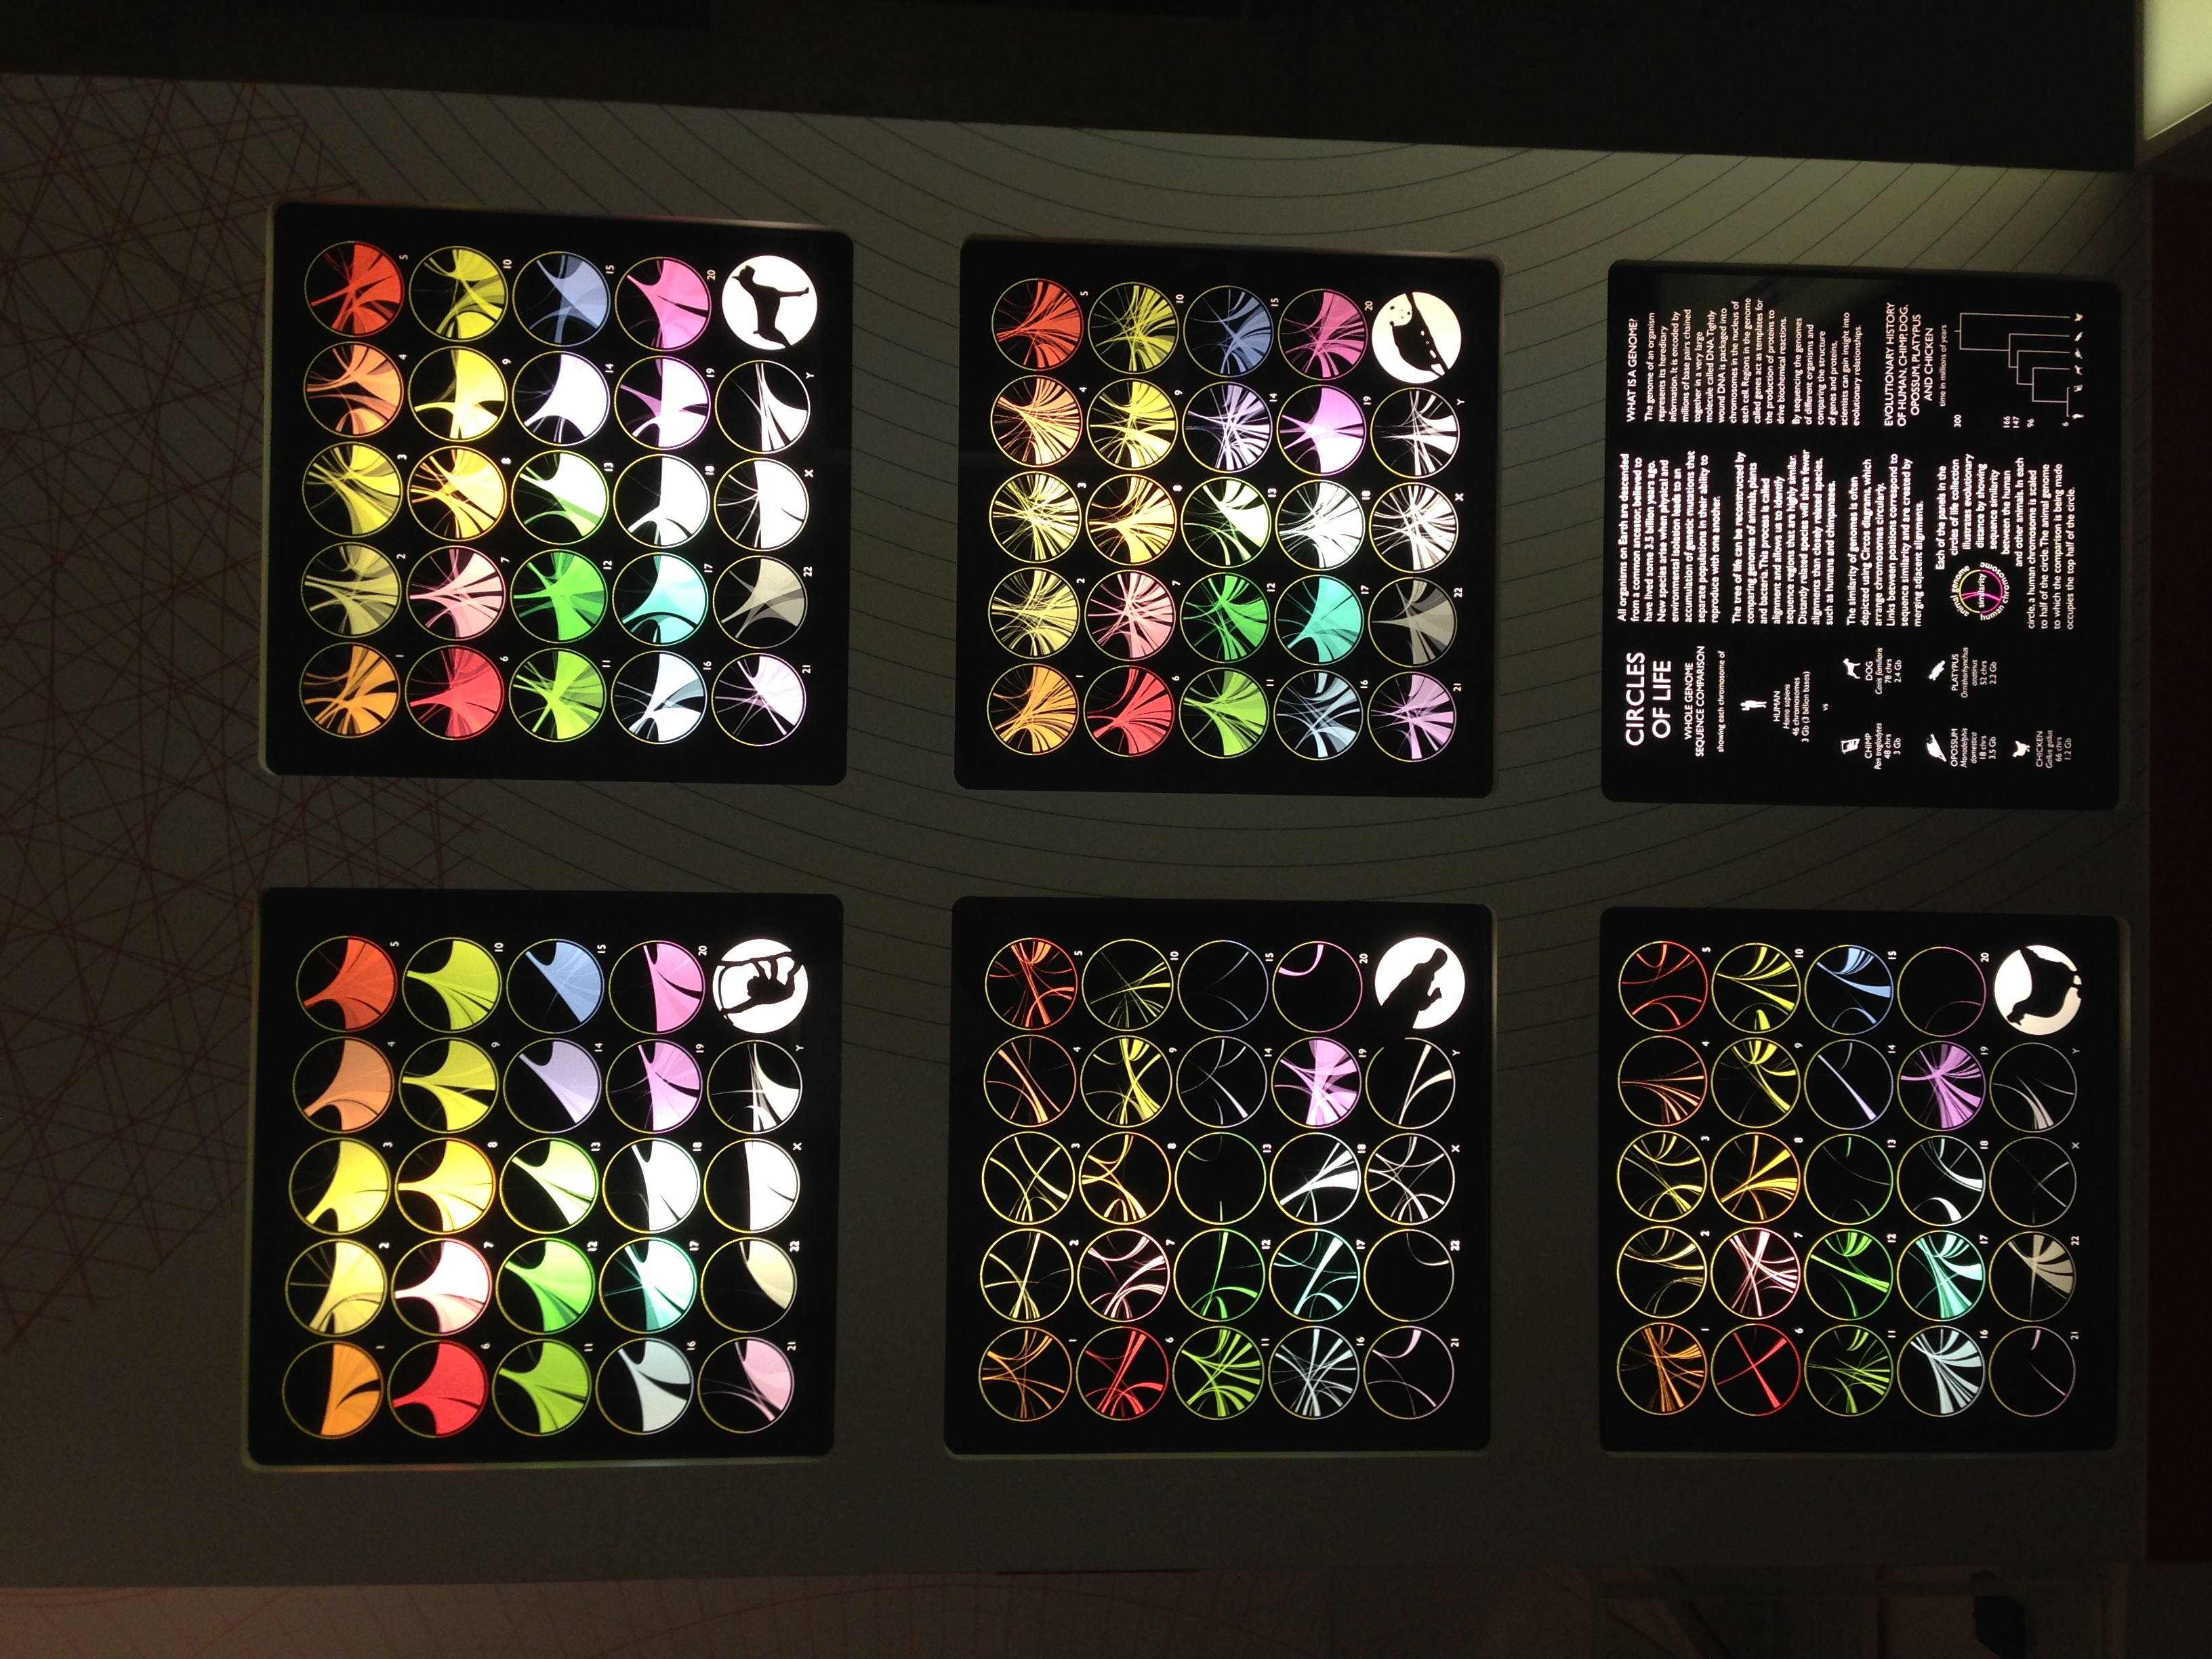
This art was originally shown at the British Library's “Beautiful Science: Picturing Data, Inspiring Insight” exhibit in 2014.
Martin Krzywinski @MKrzywinski mkweb.bcgsc.ca
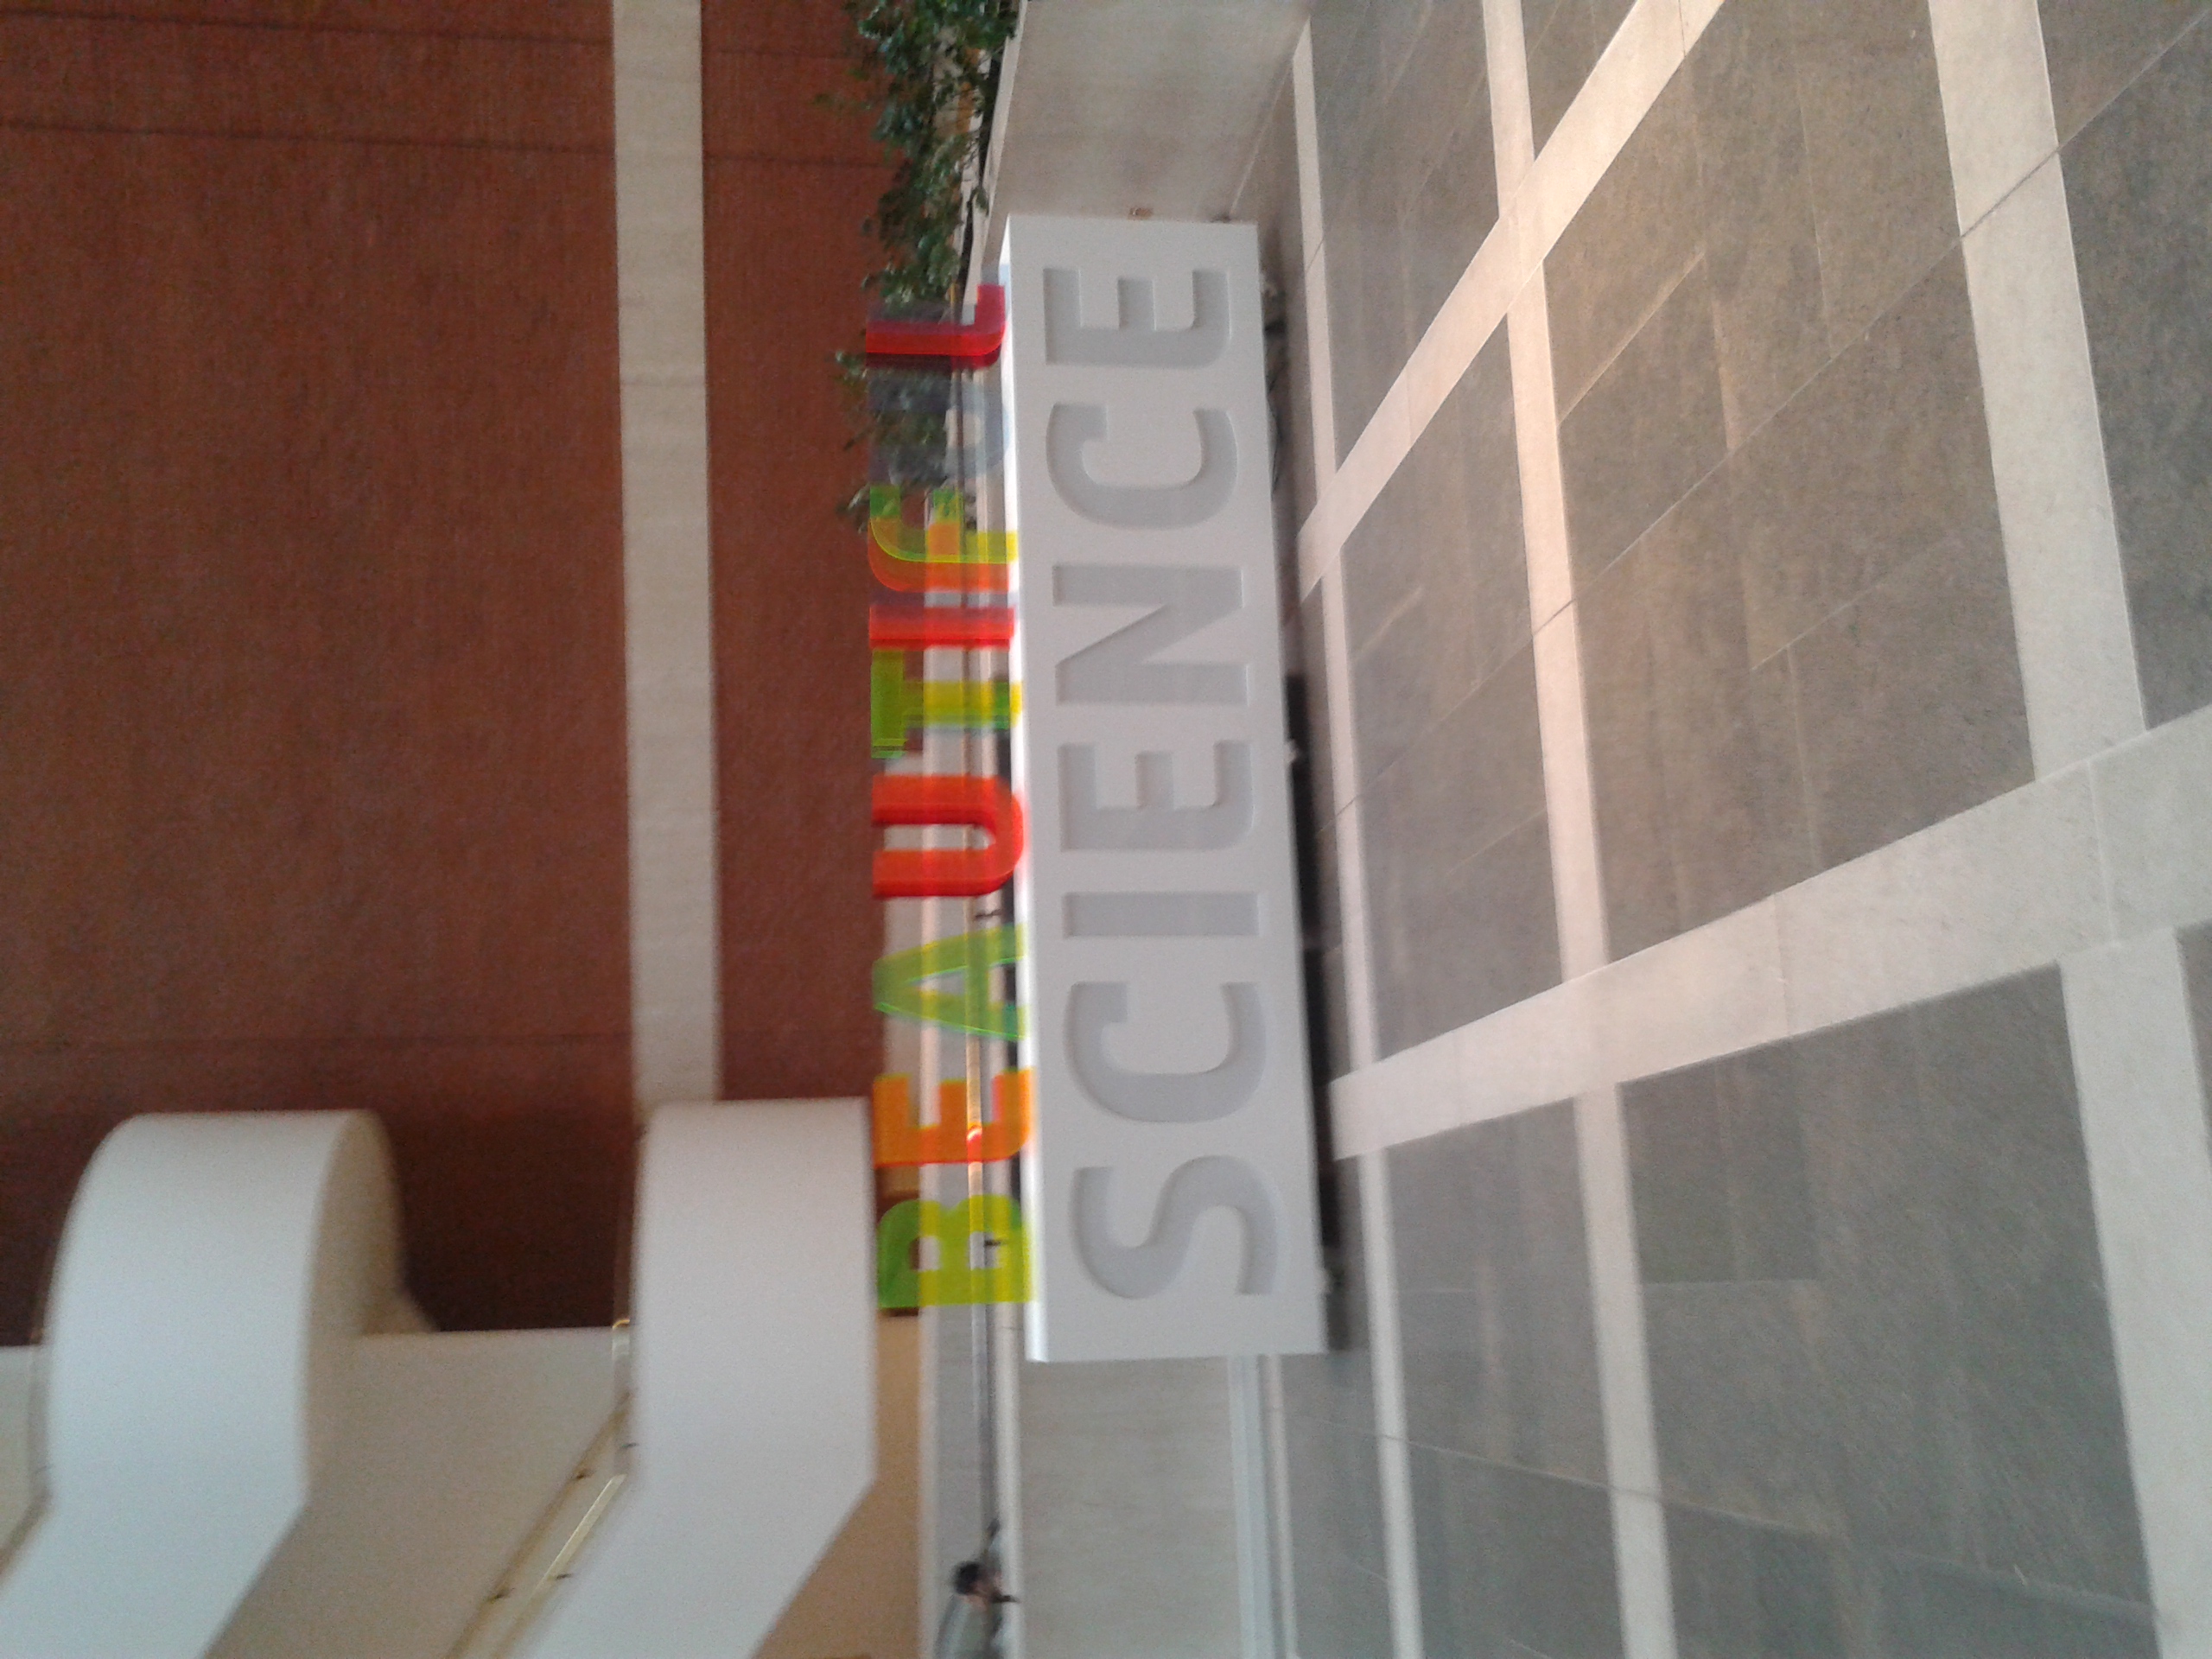
BRITISH LIBRARY'S BEAUTIFUL SCIENCE: PICTURING DATA, INSPIRING INSIGHT | A sign inside the library pointing to the exhibit.
Martin Krzywinski @MKrzywinski mkweb.bcgsc.ca
The art was installed as six 30 cm × 30 cm backlit panels.

2.2 · Invitation postcard

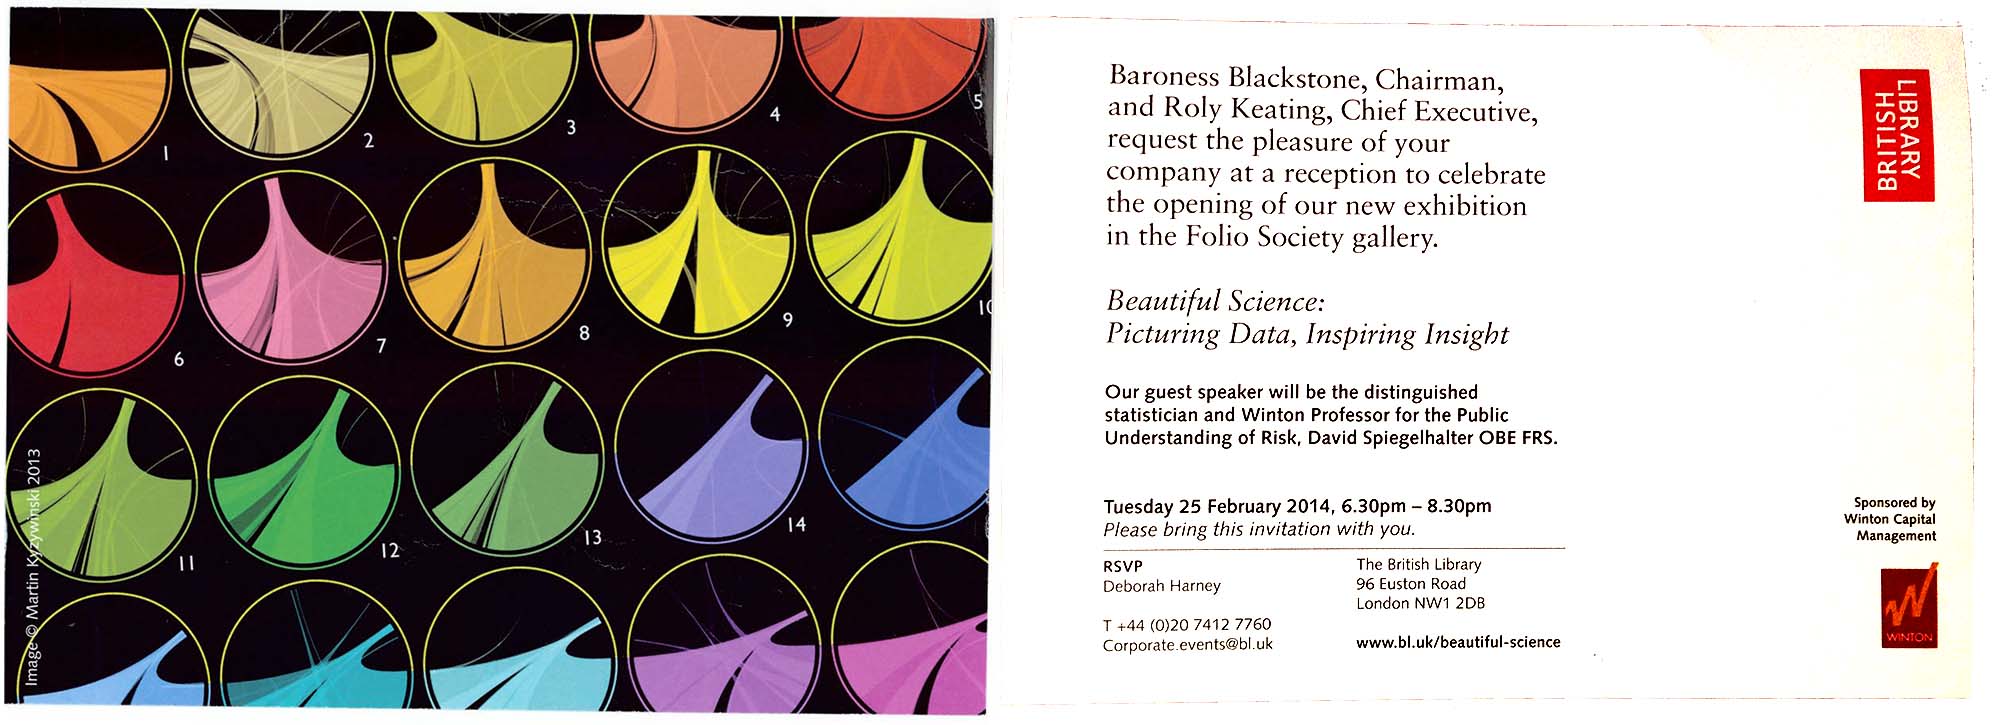
The art also appeared on the invitation.
Martin Krzywinski @MKrzywinski mkweb.bcgsc.ca
YOU'RE INVITED! | A scan of my invitation to the British Library's Beautiful Science: Picturing Data, Inspiring Insight exhibit.
Explore my designs for The Scientific American Graphic Science pages: play the bacteria game, follow the tists of fate, discover the 1% difference, put out the COVID-19 fire and discover why 3,117,275,501 bases have 0 gaps.
Explore how a great deal of data turns into a story.

3 · Circles of Life — Genomes across time: the poster

The full-size panels shown here have been modified slightly from the originals shown at the British Library — but the data are the same.
Martin Krzywinski @MKrzywinski mkweb.bcgsc.ca buy artwork
CIRCLES OF LIFE — GENOMES ACROSS TIME | A poster showing the comparison of the human genome to that of five other animals. Within each comparison (e.g., human vs. chimp), there are 24 circles. Each circle compares a human chromosome (1, 2, 3, ...) to the entire genome of another organism (e.g., chimp). Within the circle the ribbons indicate regions of high sequence similarity. (BUY ARTWORK)

4 · Circles of Life — Genomes across time: Species by species

4.1 · Interpretive panel

Martin Krzywinski @MKrzywinski mkweb.bcgsc.ca buy artwork
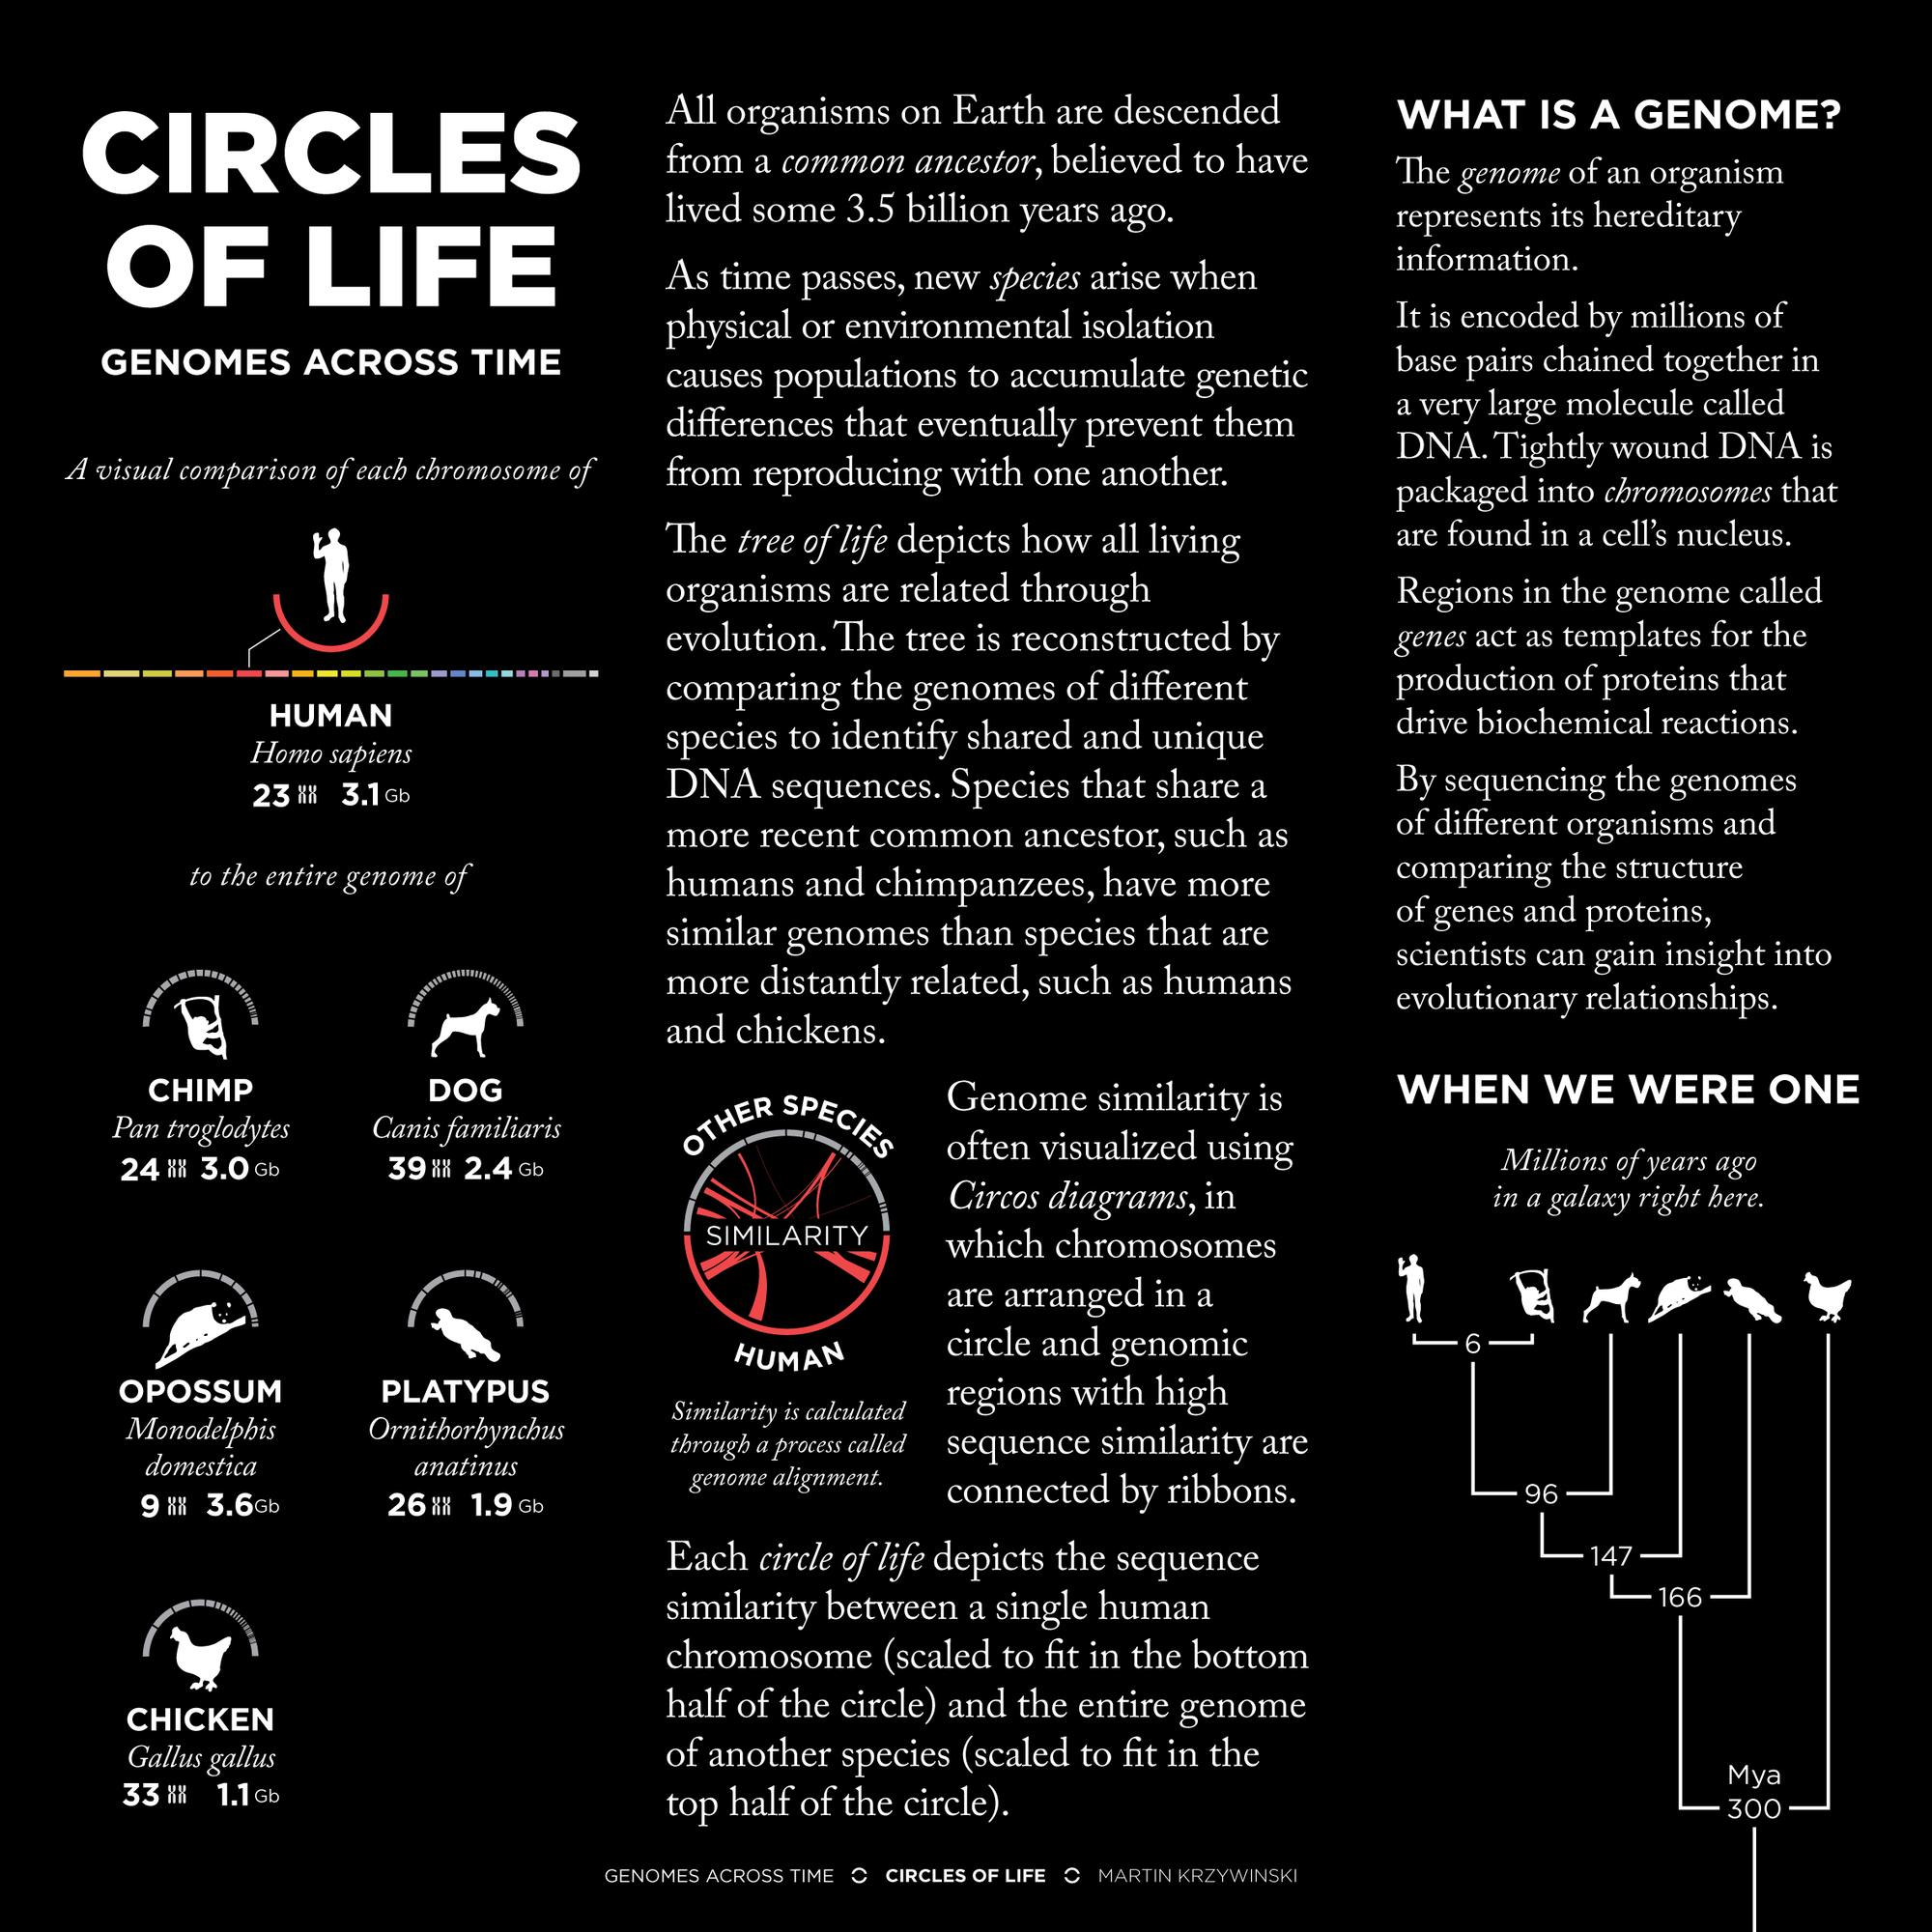
CIRCLES OF LIFE — GENOMES ACROSS TIME | Interpretive panel. (BUY ARTWORK)

4.1.1 · How to read the poster

All organisms on Earth are descended from a common ancestor, believed to have lived some 3.5 billion years ago.

As time passes, physical or environmental isolation causes populations to accumulate genetic differences that eventually prevent them from reproducing with one another. This is how new species arise.

The tree of life depicts how all living organisms are related through evolution. The tree is reconstructed by comparing the genomes of different species to identify shared and unique DNA sequences. Species that share a more recent common ancestor, such as humans and chimpanzees, have more similar genomes than species that are more distantly related.

Genome similarity is often visualized using Circos diagrams, in which chromosomes are arranged in a circle. Links between chromosomes or genomic regions represent areas of sequence similarity.

Each circle of life depicts the sequence similarity between a single human chromosome (scaled to bottom half of the circle) and the entire genome of another species (scaled to top half of the circle).

4.1.2 · What is a genome?

The genome of an organism represents its hereditary information.

It is encoded by millions of base pairs chained together in a very large molecule called DNA. Tightly wound DNA is packaged into chromosomes that are found in a cell’s nucleus.

Regions in the genome called genes act as templates for the production of proteins that drive biochemical reactions.

By sequencing the genomes of different organisms and comparing the structure of genes and proteins, scientists can gain insight into evolutionary relationships.
Discover all the things that are not trying to make you stronger.
Explore how a great deal of data turns into a story.

4.2 · Human vs. chimp (Pan troglodytes)

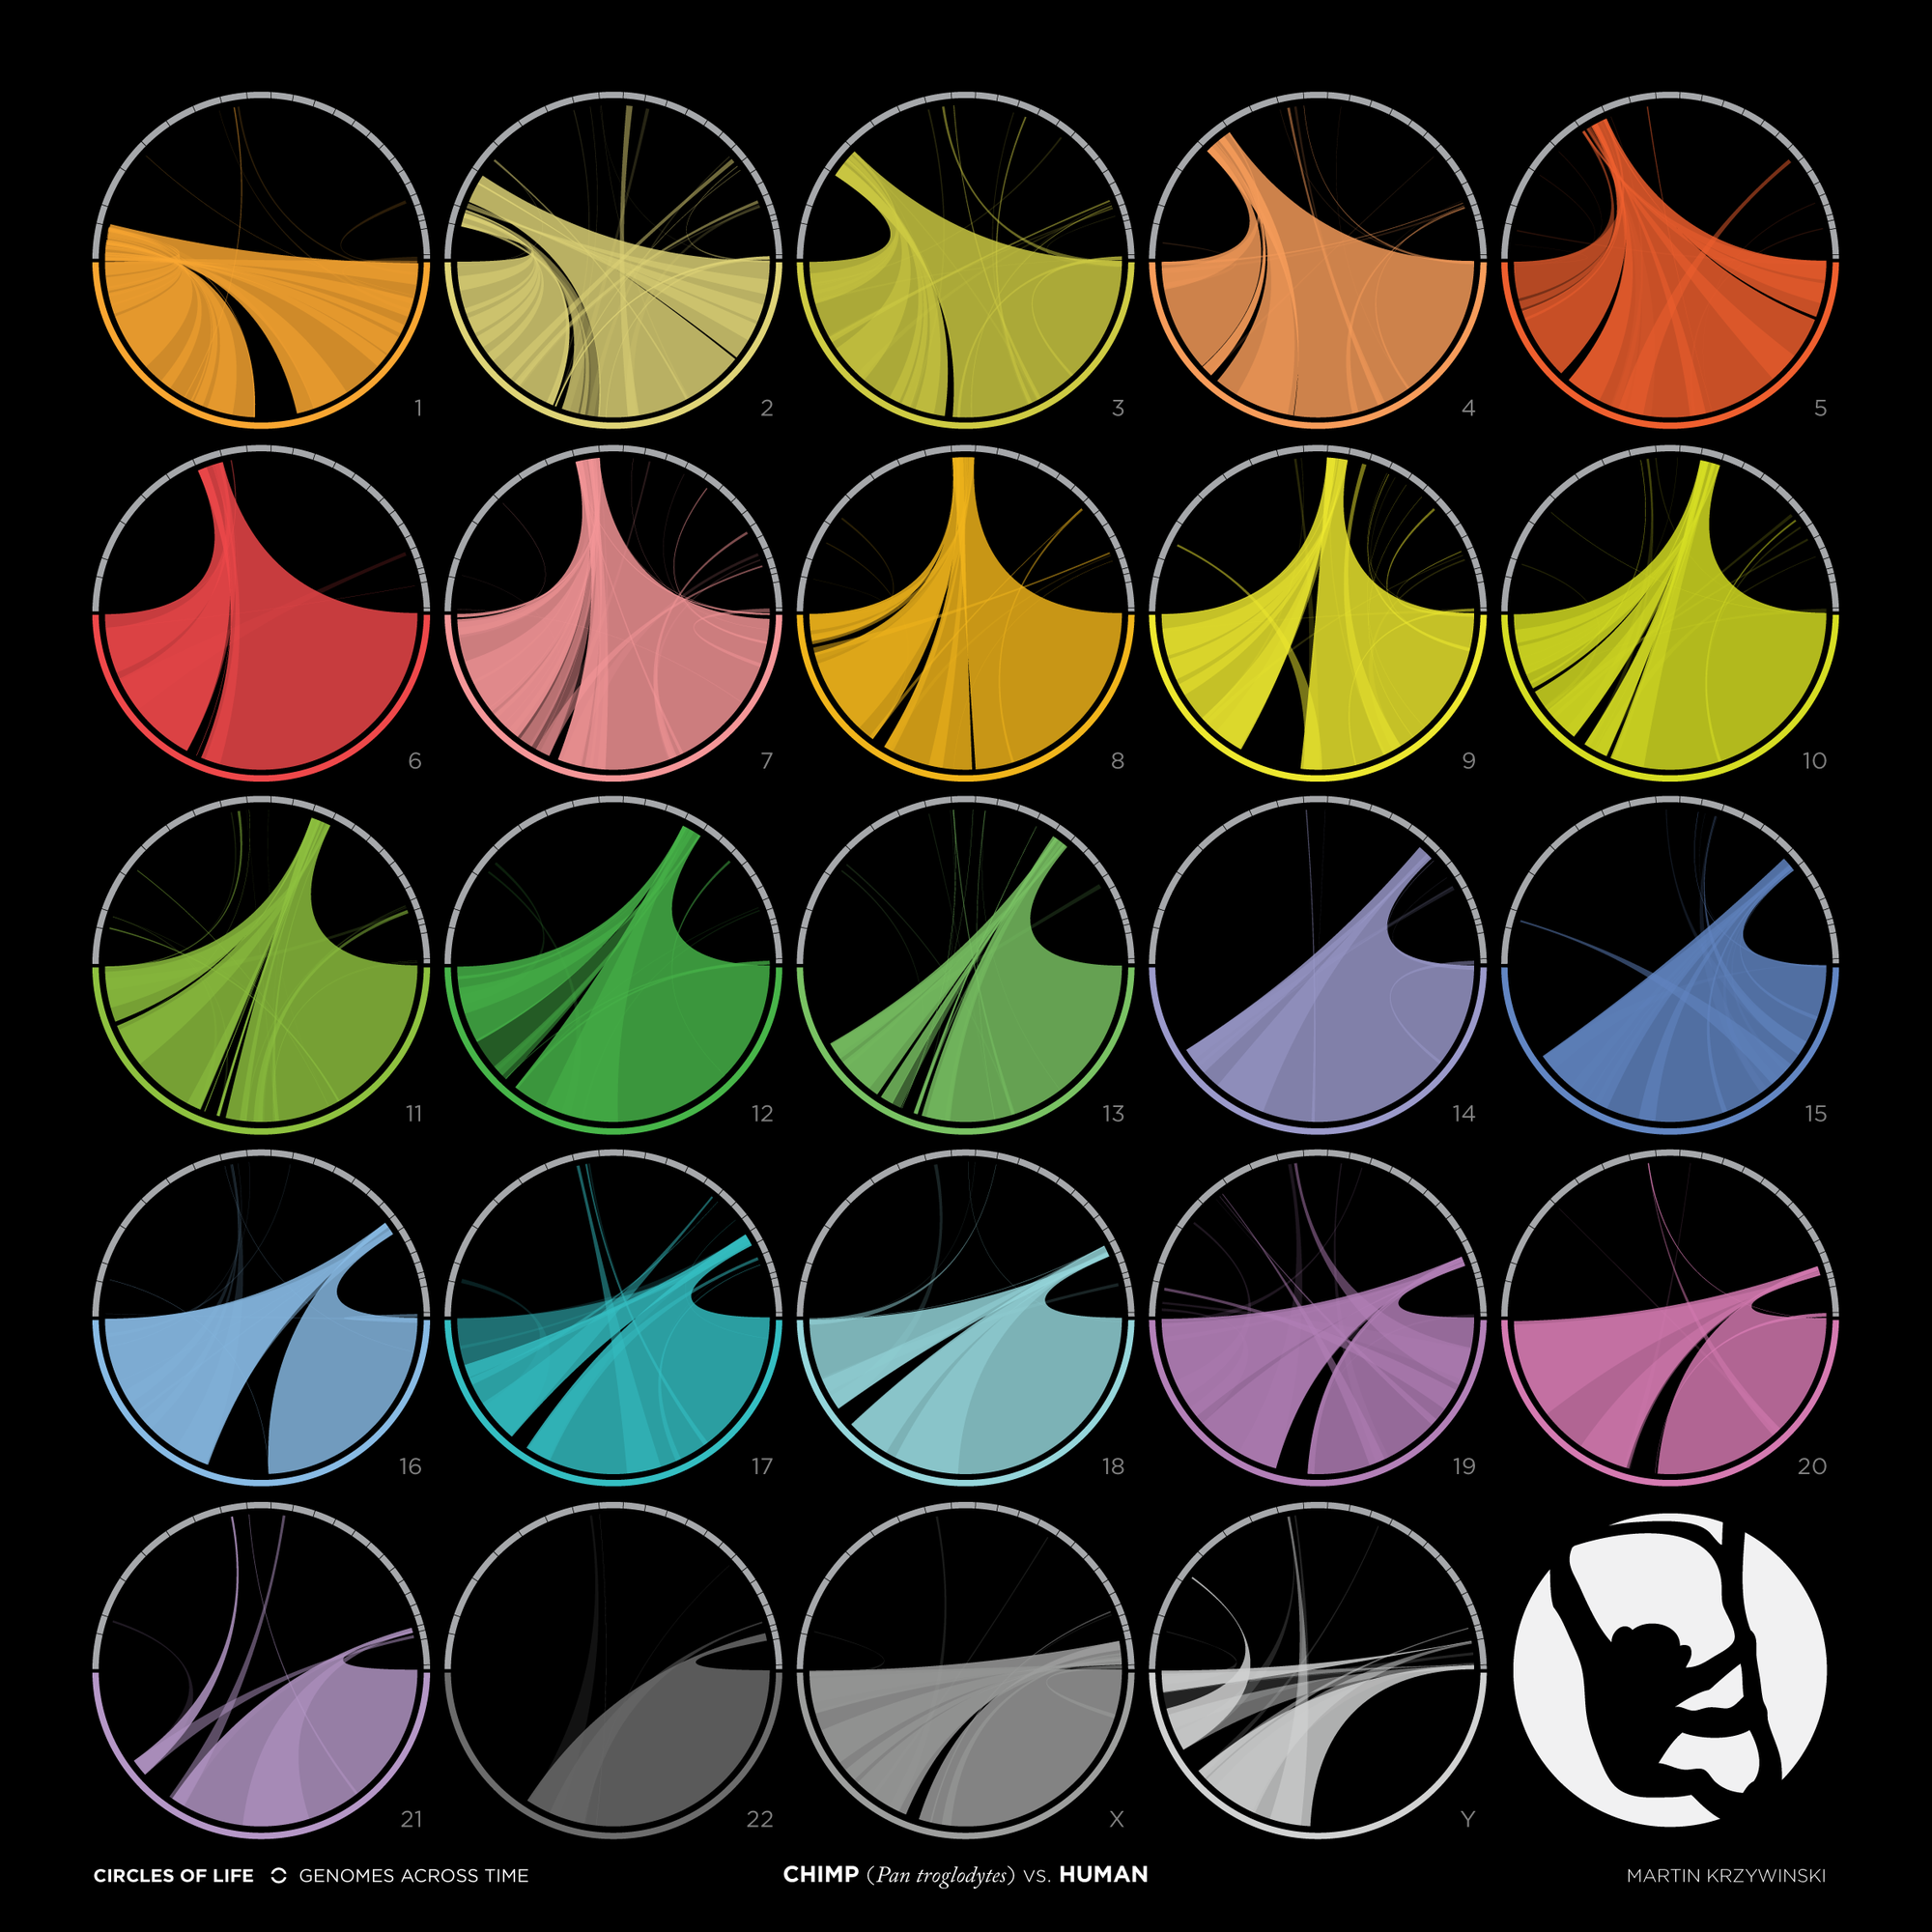
Human (Homo sapiens, 23 chromosome pairs, 3.1 Gb) vs. chimp (Pan troglodytes, 24 chromosome pairs, 3 Gb).
Martin Krzywinski @MKrzywinski mkweb.bcgsc.ca buy artwork
CIRCLES OF LIFE — GENOMES ACROSS TIME | A comparison of each chromosome of the human genome (scaled to fill the bottom half of the circle) to the entire genome of chimp (Pan troglodytes), which is 3 Gb and has 24 chromosome pairs, and scaled to fill the top half of the circle. (BUY ARTWORK)

4.3 · Human vs. dog (Canis familiaris)

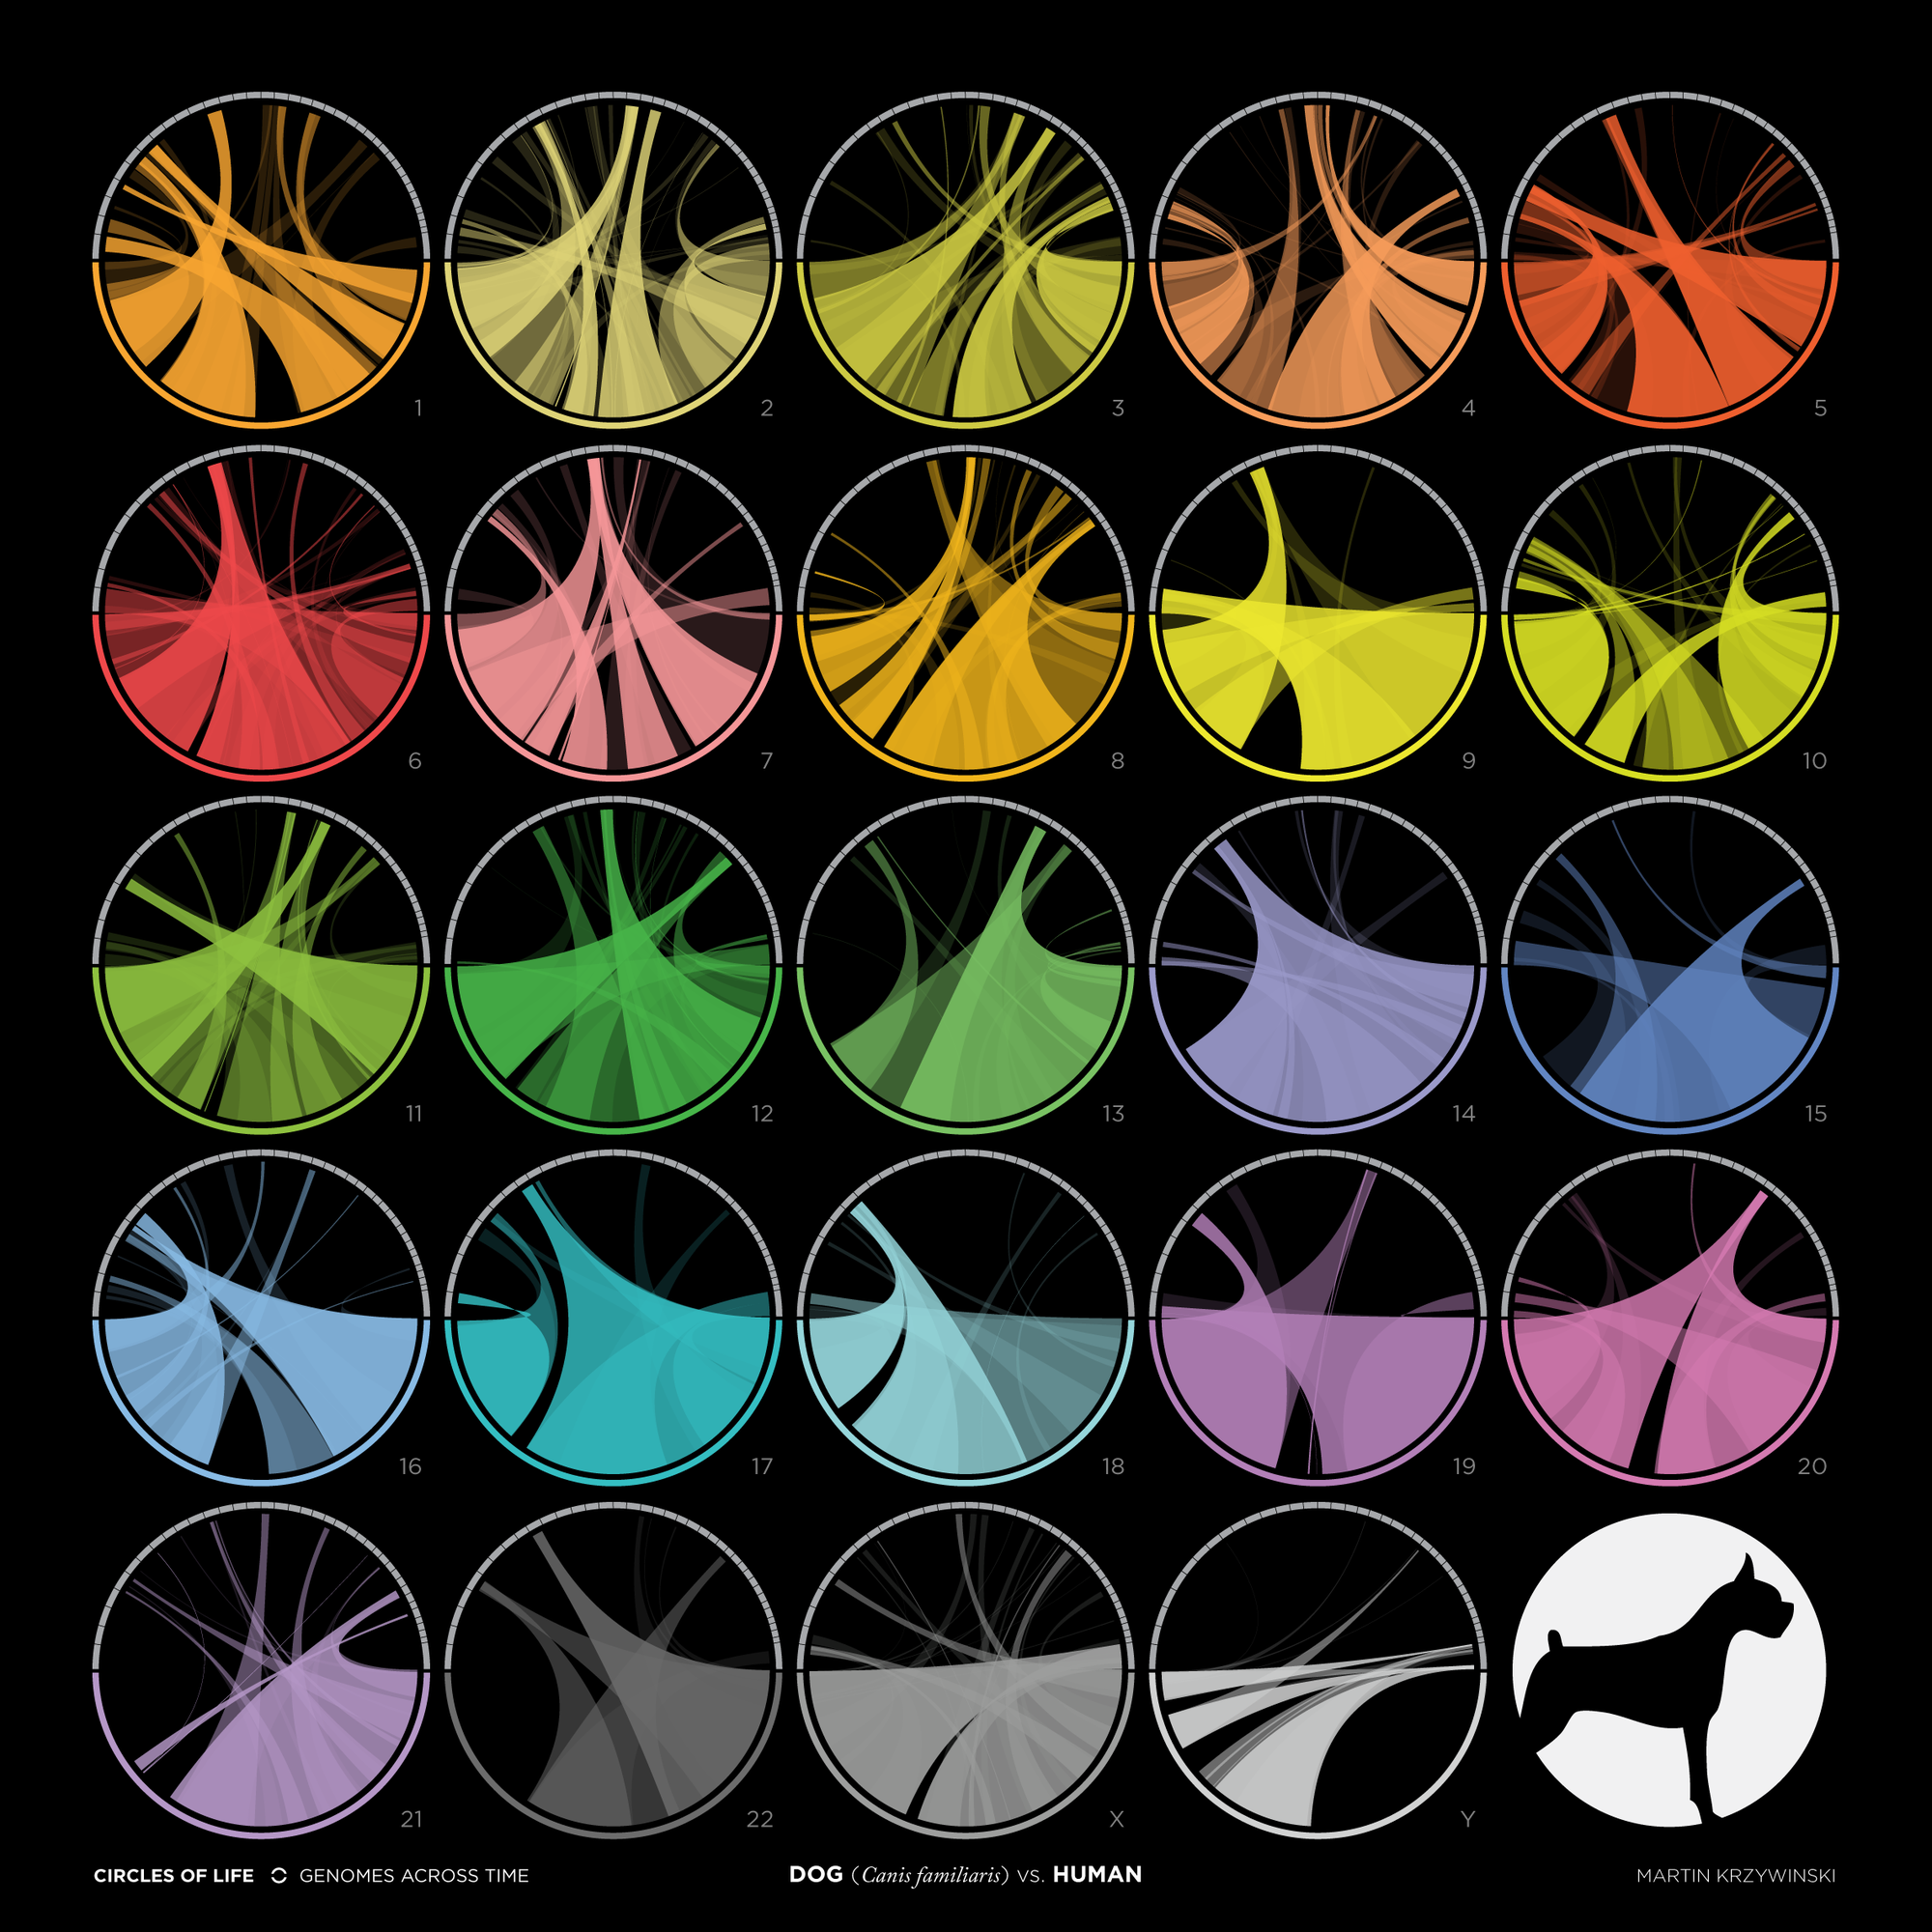
Human (Homo sapiens, 23 chromosome pairs, 3.1 Gb) vs. dog (Canis familiaris, 39 chromosome pairs, 2.4 Gb).
Martin Krzywinski @MKrzywinski mkweb.bcgsc.ca buy artwork
CIRCLES OF LIFE — GENOMES ACROSS TIME | A comparison of each chromosome of the human genome (scaled to fill the bottom half of the circle) to the entire genome of dog (Canis familiaris), which is 2.4 Gb and has 39 chromosome pairs, and scaled to fill the top half of the circle. (BUY ARTWORK)

4.4 · Human vs. opossum (Monodelphis domestica)

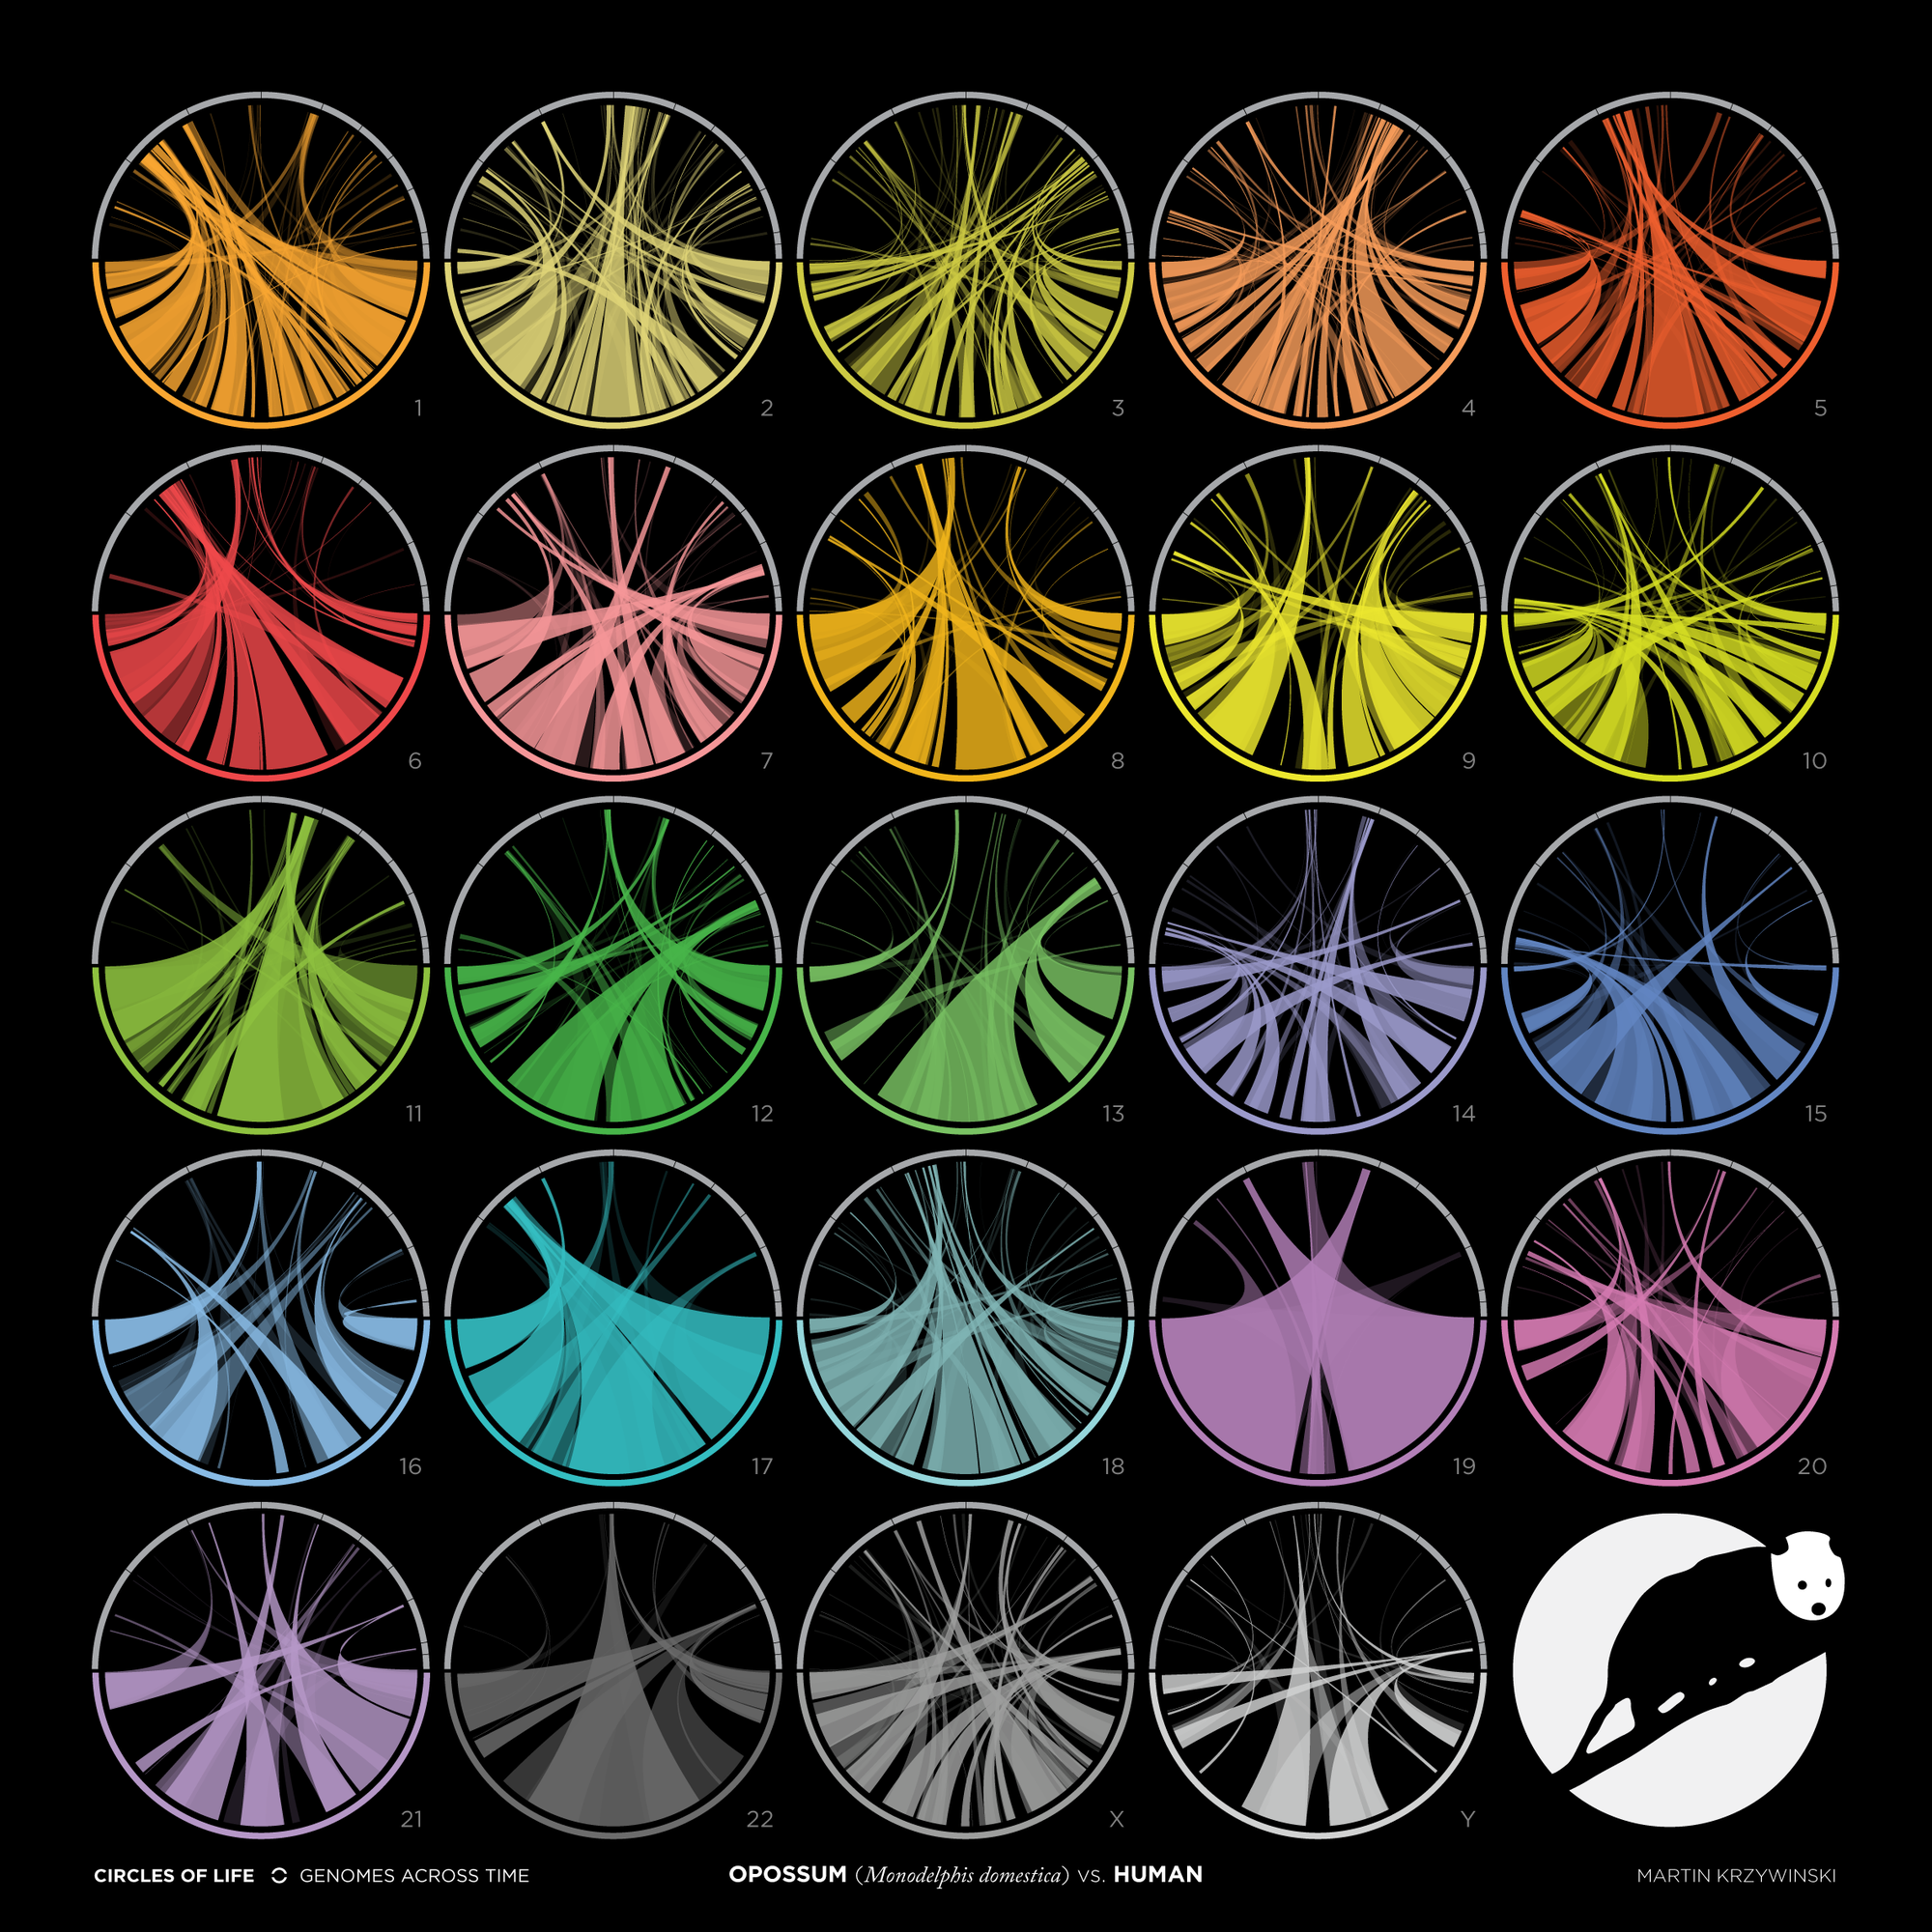
Human (Homo sapiens, 23 chromosome pairs, 3.1 Gb) vs. opossum (Monodelphis domestica, 9 chromosome pairs, 3.6 Gb).
Martin Krzywinski @MKrzywinski mkweb.bcgsc.ca buy artwork
CIRCLES OF LIFE — GENOMES ACROSS TIME | A comparison of each chromosome of the human genome (scaled to fill the bottom half of the circle) to the entire genome of opossum (Monodelphis domestica), which is 3.6 Gb and has 9 chromosome pairs, and scaled to fill the top half of the circle. (BUY ARTWORK)

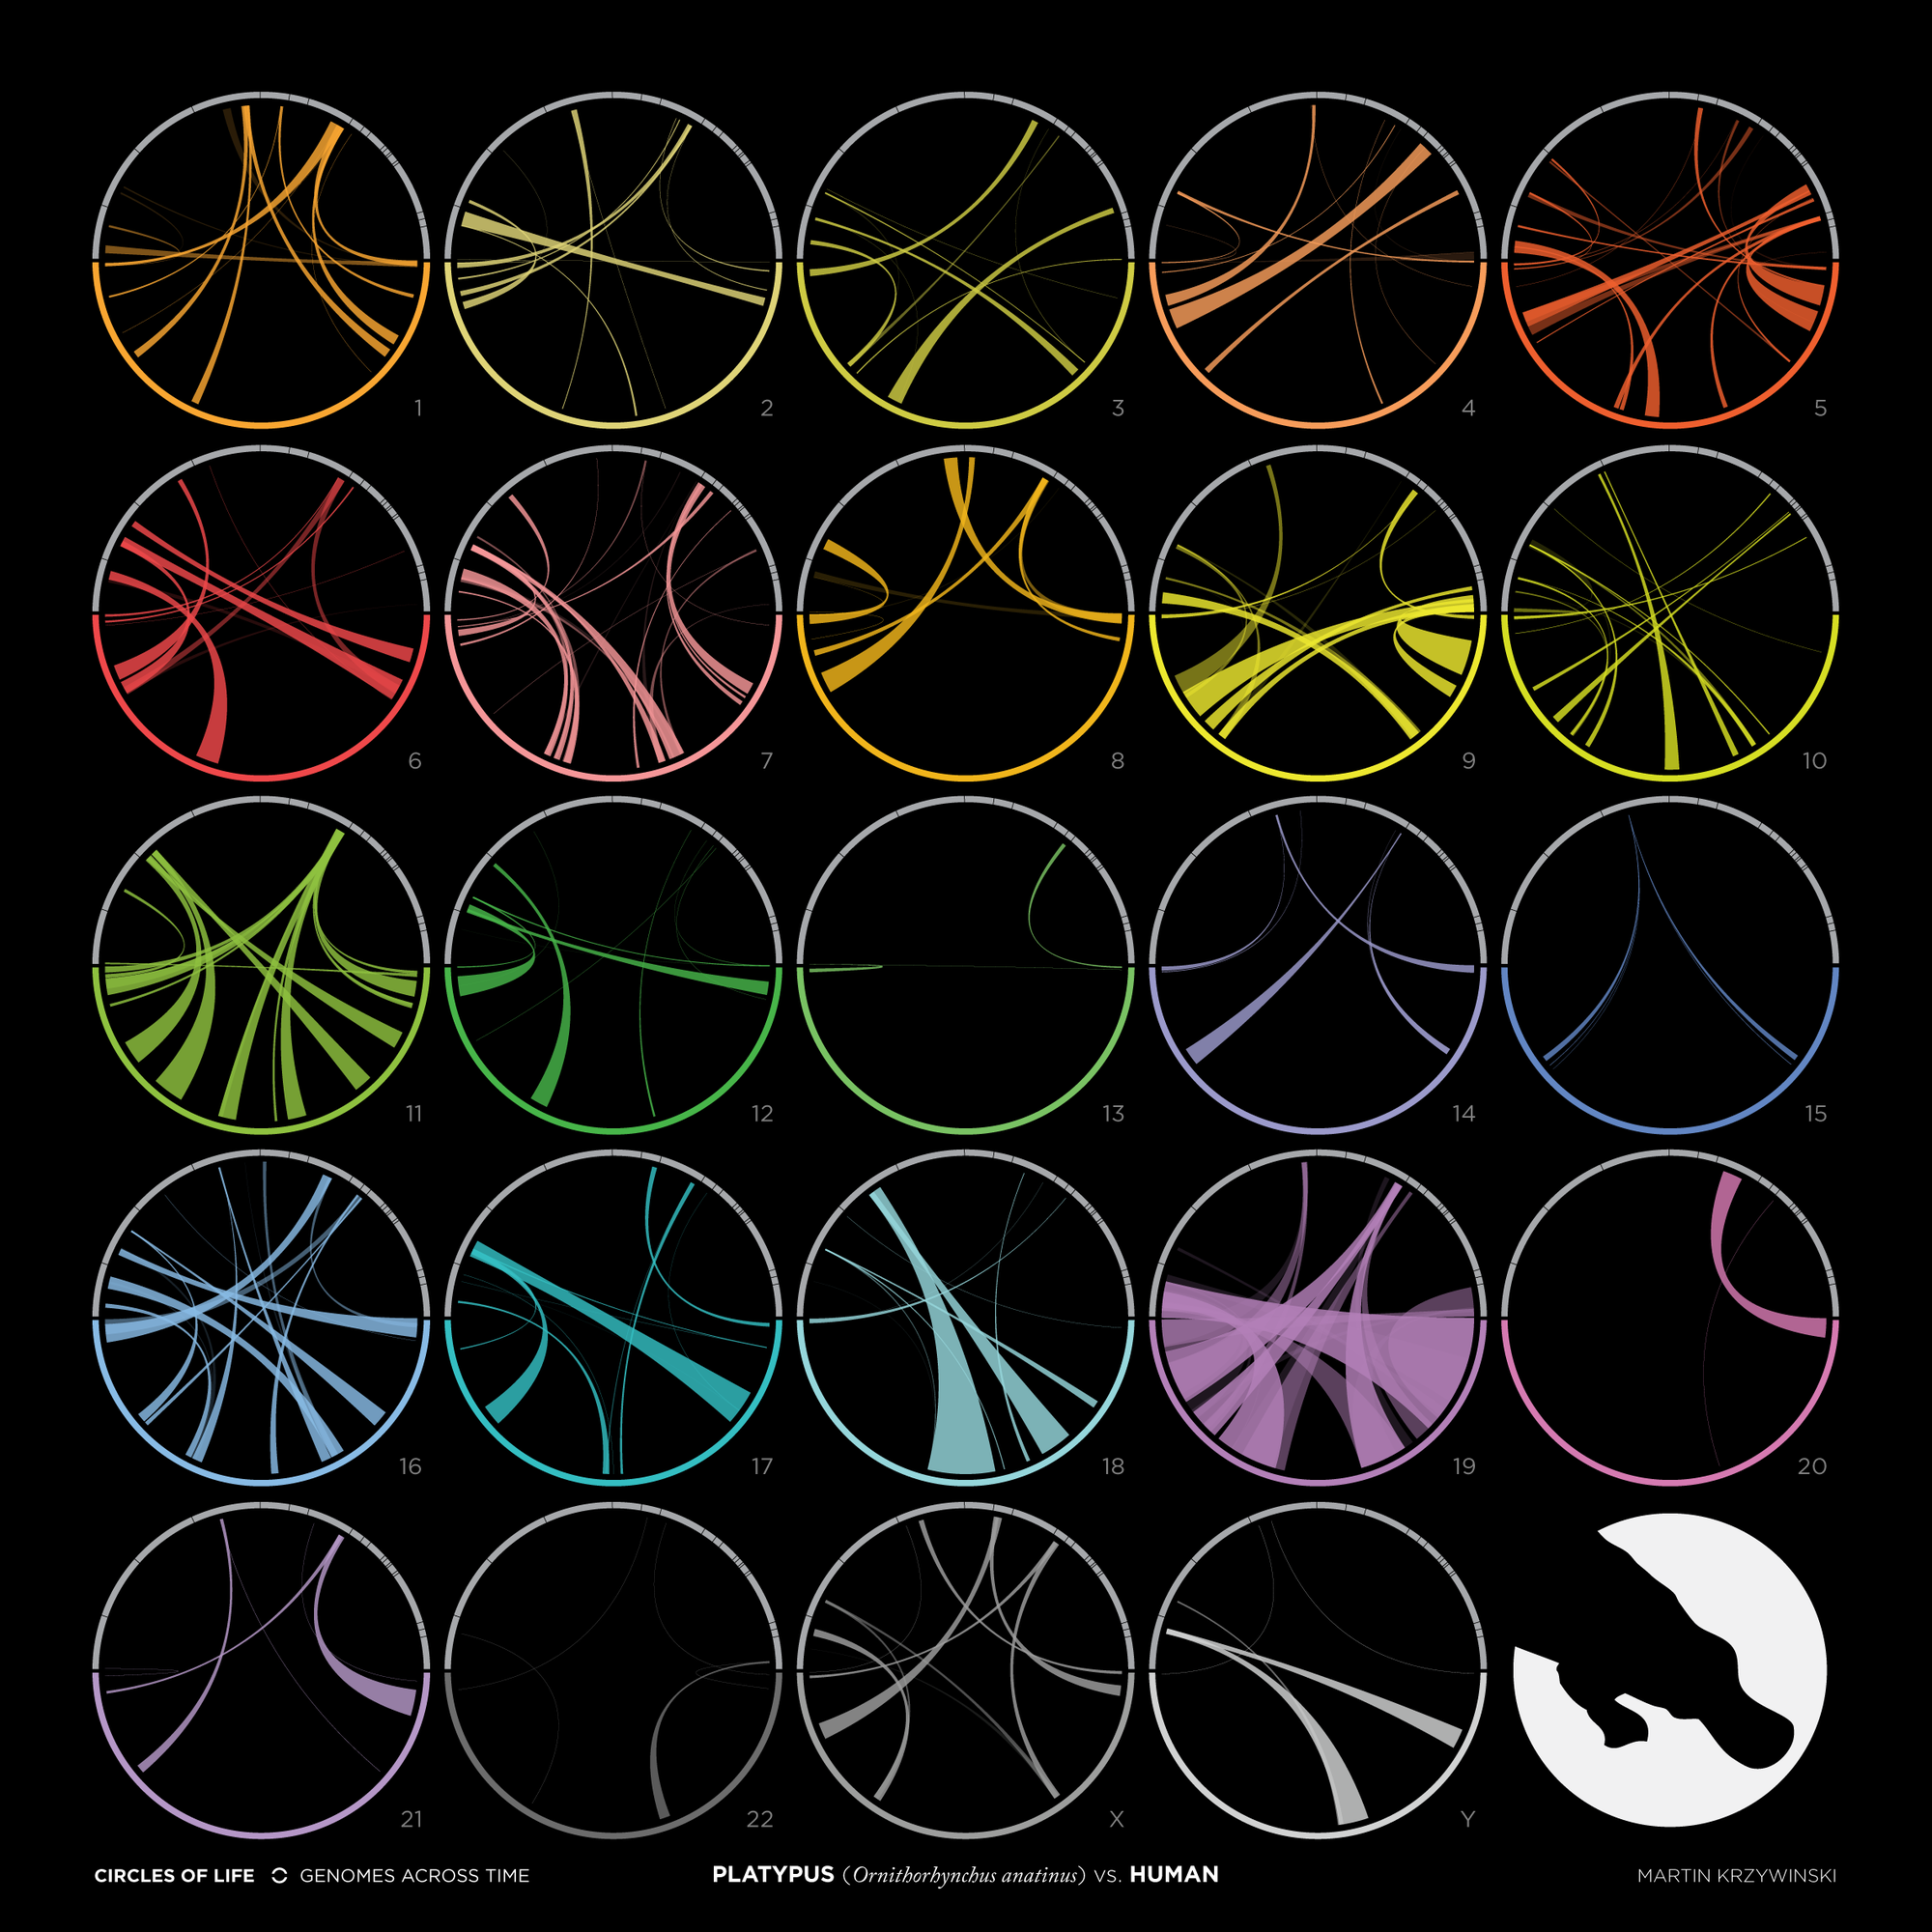
4.5 · Human vs. platypus (Ornithorhynchus anatinus)

Human (Homo sapiens, 23 chromosome pairs, 3.1 Gb) vs. platypus (Ornithorhynchus anatinus, 26 chromosome pairs, 1.9 Gb).
Martin Krzywinski @MKrzywinski mkweb.bcgsc.ca buy artwork
CIRCLES OF LIFE — GENOMES ACROSS TIME | A comparison of each chromosome of the human genome (scaled to fill the bottom half of the circle) to the entire genome of platypus (Ornithorhynchus anatinus), which is 1.9 Gb and has 26 chromosome pairs, and scaled to fill the top half of the circle. (BUY ARTWORK)

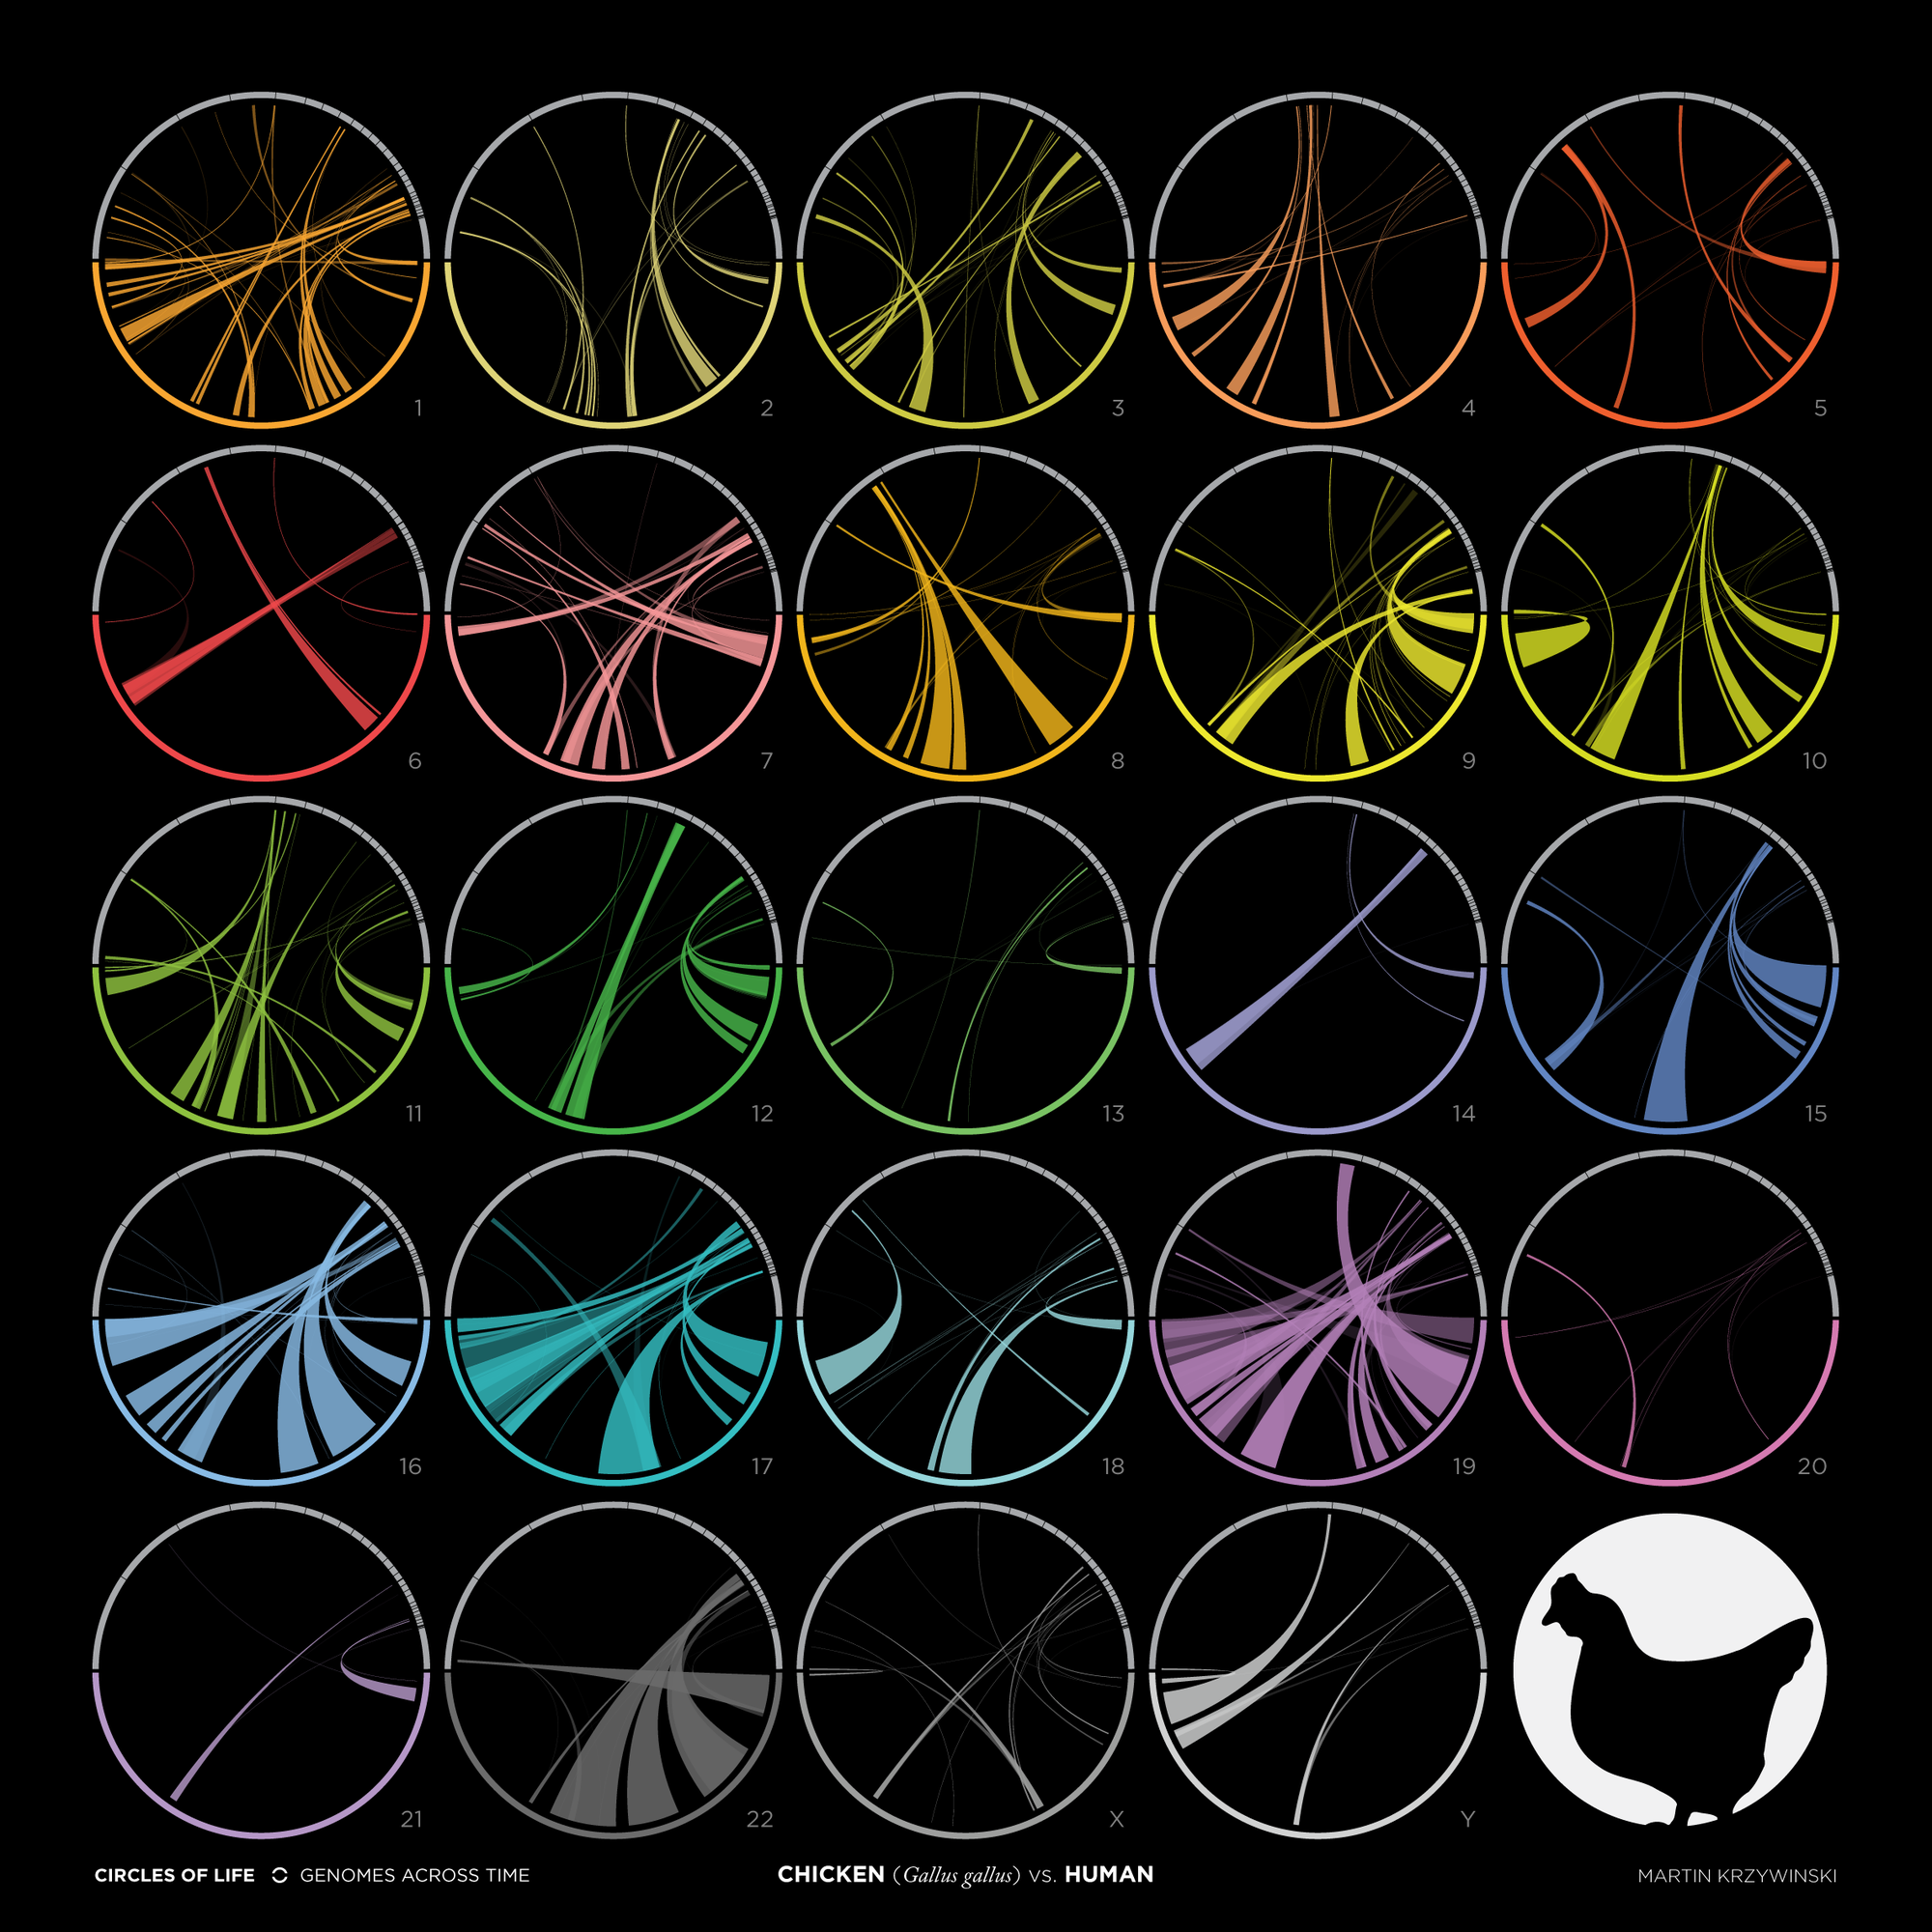
4.6 · Human vs. chicken (Gallus gallus)

Human (Homo sapiens, 23 chromosome pairs, 3.1 Gb) vs. chicken (Gallus gallus, 33 chromosome pairs, 1.1 Gb).
Martin Krzywinski @MKrzywinski mkweb.bcgsc.ca buy artwork
CIRCLES OF LIFE — GENOMES ACROSS TIME | A comparison of each chromosome of the human genome (scaled to fill the bottom half of the circle) to the entire genome of chicken (Gallus gallus), which is 1.1 Gb and has 33 chromosome pairs, and scaled to fill the top half of the circle. (BUY ARTWORK)
My animation of the scale and structure of the human genome is part of the MIT Museum Gene Cultures exhibit.
Explore how a great deal of data turns into a story.
Martin Krzywinski | contact | Canada's Michael Smith Genome Sciences CentrePHSA
Google whack “vicissitudinal corporealization”