Color encoding, also called color mapping, is a method to represent numbers or text as colors. In order for color encoding to be useful, the output color scheme must be effective in helping to understand the input data and to identify patterns in it.
Typically encoding schemes use HSV color space (hue, saturation, value), which is more useful because it is possible to visually evaluate each HSV component independently. On the other hand, it is much more difficult to guess values, or even relative propotions, in RGB for most colors.
HSV is additionally useful for encoding periodic quantities - such quantities (e.g. cardinal direction) map naturally onto hue, which itself is periodic. In fact, hue is a very useful characteristic: not only periodic, it is perceptually continuous across the boundary (hue at 359° is perceptually close to hue at 1°) and small changes in hue are easily perceived.
Color encoding schemes are useful to help perceive the absolute or relative size of numbers. Because our eyes are very sensitive to changes in hue, a scheme that maps onto HSV can create encodings in which minor variation in input is easily identified.
Additionally, because color can be represented more compactly than the numbers it encodes (a single pixel can be used), a color encoded image can be used to convey multi-dimensional information. As long as the encoding scheme is sensible and the reader understands how the encoding was done, a large amount of information can be represented in a small space.
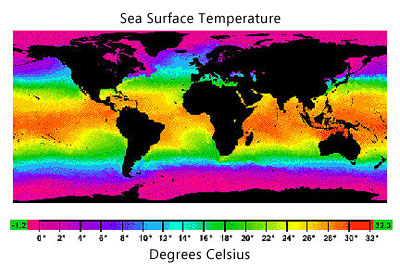
A classic example of color encoding is a 1-dimensional encoding that maps temperature onto a color. This is illustrated in the figure below, where color is used to show sea surface temperature. In this encoding temperature is mapped to a hue, with saturation and value kept constant.
This kind of encoding scheme is a false-color
scheme. Typically this method maps a single value
(e.g. intensity), associated with an (x,y) position (e.g. map
coordinates), onto a rainbow of colors (low
•
•
•
•
•
•
•
high). Because our vision is very sensitive to changes in hue —
more so than to changes in value or saturation — a false-color
scheme can more clearly demonstrate minor changes in input data.
A false-color encoding can be adjusted to produce a large change in hue over a range of interest in the input data to further accentuate small changes in input.
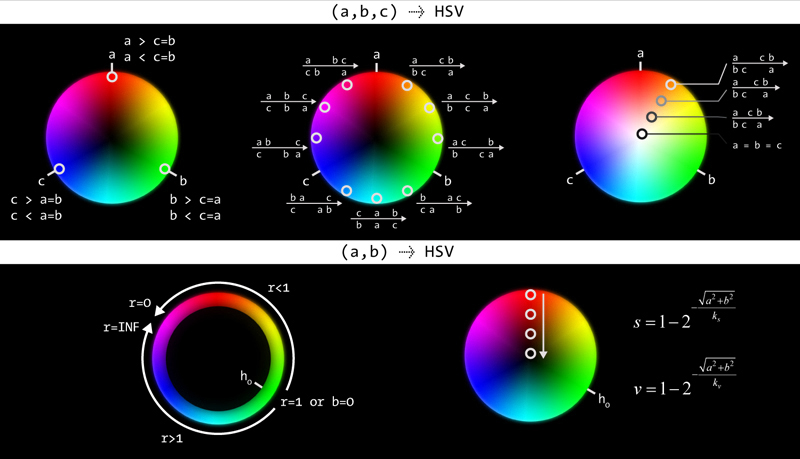
A more complex encoding scheme would accept a 2-tuple as input
(e.g. wind strength and direction for each position on a
weather map) and assign a characteristic color to each combination of
values. In this example, wind direction could be mapped onto the color
wheel (hue) and strength could be encoded in the value (dark for low
strength and bright for high strength).
The encoding schemes discussed here methods that associate a color
with a vector (a tuple). Methods and Perl
modules for 2- and 3-element vectors are presented. This is in
contrast to the temperature example above, which associated a color
with a one-dimensional quantity (temperature).
The details of how a vector is encoded by a color will depend on what the purpose of the encoding is. What about the vector is important to represent visually? For example,
(c) 2006-2017 Martin Krzywinski mkweb.bcgsc.ca