Sample Benchmarks
Periodically, I'll update these benchmark times as more nodes become available
Sample Benchmark
Below is the profile of our IBM x330 cluster at the Genome Sciences Centre. The profile was captured when the cluster was idle. The CPU, IO and memory benchmarks are histogramed below the table, showing the distribution of times across cluster nodes.
clustersnapshot -c "benchio(80e3,2);benchcpu(5e5);
                    benchmem(70,1e6);mhz;load(1)" -t 60
        host  b_all  b_cpu   b_io  b_mem live load   mhz
        0of1  8.427  3.618  1.622  3.187    1  0.2  1992
        8of0  8.482  3.584  1.623  3.275    1  0.1  1992
        3of2  8.719  3.864  1.592  3.264    1  0.1  1992
        9of0  8.741  3.856  1.624  3.262    1  0.1  1992
        4of0  8.742  3.856  1.621  3.264    1  0.1  1992
        2of0  8.746  3.861  1.616  3.269    1  0.2  1992
        2of2  8.750  3.864  1.621  3.265    1  0.2  1992
        9of2  8.755  3.856  1.632  3.266    1  0.2  1992
        3of0  8.757  3.856  1.635  3.266    1  0.2  1992
        7of0  8.763  3.861  1.629  3.273    1  0.2  1992
        6of2  8.766  3.867  1.626  3.272    1  0.1  1992
        5of0  8.768  3.856  1.647  3.266    1  0.2  1992
        1of3  8.778  3.875  1.638  3.265    1  0.2  1992
        0of3  8.787  3.879  1.635  3.273    1  0.2  1992
        2of1  8.800  3.867  1.650  3.283    1  0.2  1992
        5of8  8.955  2.772  3.363  2.820    1  0.2  2792
        6of8  8.957  2.778  3.300  2.880    1  0.2  2792
        1of8  8.958  2.774  3.356  2.828    1  0.1  2792
        7of7  8.979  2.776  3.331  2.872    1  0.1  2792
        2of7  9.011  2.776  3.352  2.883    1  0.2  2792
        2of8  9.015  2.774  3.357  2.884    1  0.2  2792
        7of8  9.024  2.774  3.370  2.880    1  0.2  2792
        1of7  9.031  2.797  3.350  2.884    1  0.2  2792
        0of8  9.037  2.798  3.356  2.882    1  0.2  2792
        4of7  9.078  2.794  3.401  2.883    1  0.2  2792
        8of7  9.084  2.799  3.397  2.889    1  0.2  2792
        8of8  9.088  2.761  3.443  2.884    1  0.2  2792
        6of7  9.092  2.772  3.451  2.869    1  0.1  2792
        5of7  9.100  2.797  3.420  2.883    1  0.2  2792
        9of7  9.117  2.799  3.431  2.887    1  0.2  2792
        3of7  9.161  2.797  3.479  2.884    1  0.2  2792
        4of8  9.593  2.795  3.912  2.886    1  0.1  2792
        6of4  9.688  3.063  3.637  2.988    1  0.2  2522
        0of5  9.697  3.109  3.613  2.975    1  0.2  2522
        1of4  9.708  3.074  3.650  2.984    1  0.2  2522
        7of3  9.738  3.065  3.689  2.984    1  0.2  2522
        0of0  9.740  3.875  2.600  3.265    1  0.2  1992
        3of4  9.744  3.053  3.708  2.982    1  0.2  2522
        4of3  9.745  3.060  3.700  2.984    1  0.2  2522
        0of4  9.759  3.075  3.699  2.985    1  0.2  2522
        8of4  9.767  3.067  3.714  2.986    1  0.2  2522
        9of3  9.769  3.075  3.711  2.983    1  0.2  2522
        3of8  9.781  2.799  4.097  2.885    1  0.2  2792
        1of5  9.782  3.111  3.686  2.985    1  0.2  2522
        9of4  9.792  3.110  3.697  2.986    1  0.2  2522
        5of3  9.802  3.060  3.757  2.985    1  0.2  2522
        5of4  9.857  3.065  3.809  2.984    1  0.3  2522
        4of4  9.866  3.057  3.827  2.982    1  0.2  2522
        2of4 10.267  3.073  4.210  2.984    1  0.2  2522
        3of3 10.422  3.060  4.378  2.984    1  0.3  2522
        6of3 11.128  3.060  5.216  2.852    1  0.2  2522
        8of3 11.216  3.072  5.163  2.981    1  0.2  2522
        7of2 17.376  3.864 10.246  3.267    1  0.4  1992
        6of0 17.526  3.856 10.404  3.266    1  0.4  1992
        4of2 17.623  3.869 10.485  3.269    1  0.5  1992
        6of1 17.772  3.865 10.632  3.274    1  0.4  1992
        3of1 17.904  3.867 10.772  3.266    1  0.4  1992
        1of2 18.034  3.864 10.907  3.263    1  0.4  1992
        1of1 18.038  3.866 10.901  3.271    1  0.4  1992
        5of2 18.117  3.864 10.990  3.264    1  0.5  1992
        4of1 18.126  3.862 10.999  3.265    1  0.5  1992
        8of1 18.133  3.867 10.996  3.269    1  0.3  1992
        8of2 18.180  3.864 11.052  3.264    1  0.4  1992
        9of1 18.198  3.868 11.061  3.270    1  0.5  1992
        5of1 18.727  3.864 11.600  3.264    1  0.4  1992
        0of2 18.761  3.866 11.625  3.269    1  0.5  1992
       TOTAL 736.845 220.840 312.713 203.293   66 14.8 155412
Benchmark Distribution
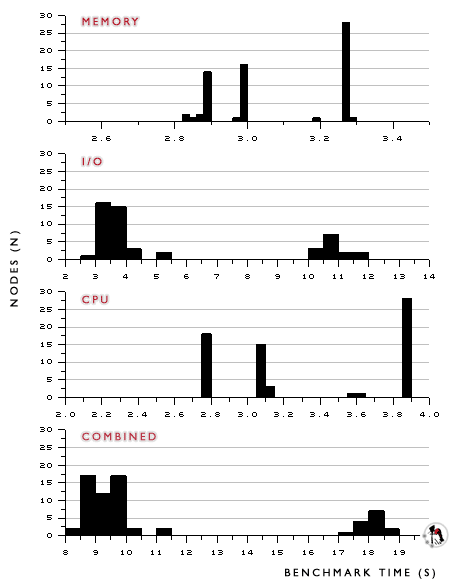
Benchmark Distribution. Times for CPU, IO, memory and combined (CPU+IO+memory) benchmarks are histogramed in this figure. The trimodal distributions illustrate that the cluster contains nodes which differentiate into three distinct groups. The nodes in fact come in three different speeds: 2x1GHz, 2x1.26GHz and 2x1.4GHz (P3 processors).
The relationship between the node speed an each of the benchmark times is shown below. All nodes are based on the IBM x330 platform, with dual CPUs and on-board SCSI-160 disk controller. All nodes have a single 18Gb disk. The main difference are the CPUs, which come in flavours of 1 GHz, 1.26 GHz and 1.4 GHz.
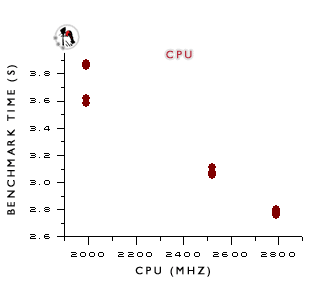
CPU Benchmark Profile. The CPU benchmark makes 500,000 calls to rand(). This benchmark scales linearly with CPU speed and is a reasonable measure of CPU speed.
|
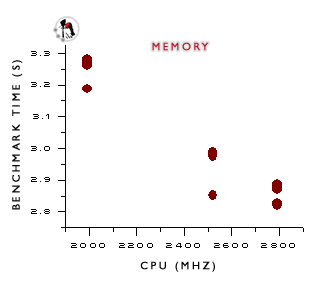
Memory Benchmark Profile. The memory benchmark allocates/deallocates a 1,000,000 element array 70 times. This particularly benchmark appears to scale linearly with CPU speed, much like the CPU benchmark.
|
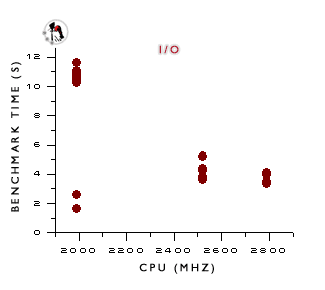
IO Benchmark Profile. The IO benchmark writes 2 80Mb files to /tmp. A group of nodes (2x1GHz) appears to have very fast I/O using the same disks as nodes with slower I/O times. The effect of the low benchmark times is not known.
|
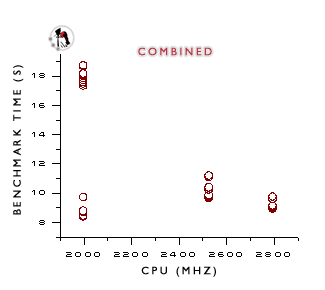
Combined Benchmark Profile. The combined time shown is the sum of the three other benchmarks.
|