Description
Clusterpunch is a Perl-based system for distribution of mini-benchmarks across a UNIX computer cluster. The benchmarks, termed punches, are broadcast over UDP to all network hosts. Those nodes running the clusterpunchserver perform the benchmark, or possibly diagnostics, and return the results to the client. The results can be used to rank the cluster nodes, such as according to their computational availability or hardware profiles. Clusterpunch is distributed under the GNU General Public License.
Clusterpunch was published in July 2003 issue of Sys Admin Journal (code listing).
*Punch Philosophy
Clusterpunch
Purpose
- Perl system for distributed benchmarks
- cluster nodes are ranked by short benchmarks
- benchmarks rate CPU, memory and I/O subsystems
Design
- UDP broadcast mechanism
- API for easy design of client utilities
- punches defined in external Apache-style configuration
- network-wide and host-specific benchmark configurations
Clusterpunch is designed on the *punch method. In this method, any kind of system is monitored by subjecting the system to a small stress. The reaction of the system is monitored. If the system is a cluster node, the stress is a small benchmark suitable for testing the node's subsystem of interest. A client broadcasts a series of benchmarks, or punches, and any listening nodes respond with the results of the benchmarks. The nodes can then be ranked according to their benchmark scores.
Ranking Cluster Nodes
Tools already exist (Big Brother, Big Sister, and Ganglia to name a few) to monitor networked computers. Clusterpunch is specifically designed to allow you to distribute and time the execution of code chunks to cluster nodes. It supports both a central and host-specific configuration. It is a light-weight and portable Perl-based system designed to monitor computational availability.
No Cluster - No Problem
"But I don't have a cluster!" No problem. You can use Clusterpunch to monitor a single system. You may have a web server or firewall whose availability you want to track. You can design a network punch, which measures your network connectivity, or a web punch, which polls your own web server.
I/O Benchmark Example
Suppose you have a cluster of 100 nodes and are looking for the least busy node to run your job. One way to do this is to install a batch queueing system, like PBS or DQS, and submit the job to the system. If you have a system like this set up - great! The queue system generally figures out which is the least loaded node and submits the job there. Of course, you hope that the scheduler set up the job on the node which is best suited for your job type.
If you don't run a centralized queue, or don't want to use one for whatever reason, you could retrieve the current load of all the machines. This value would be either a process load (e.g. 2.5 running jobs), or a CPU load (e.g. 50% CPU load). Given the load, and knowing the hardware profile of each node you could try to figure out which node is most likely to finish your job first. A 2GHz node with a load of 2.0 is still faster than a 1GHz node with a load of 1.5. Maybe. If your job really spent a lot of time performing heavy I/O, then you'd need to figure out which nodes have the fastest disks. If your job spent a lot of time thrashing memory ... well, you get the picture.
Clusterpunch was designed to address this issue. If your job was I/O intensive, you would construct an I/O benchmark (e.g. write 5 100MB files to local disk) and broadcast the benchmark to all your nodes. Each node would perform the benchmark and return the result. On our cluster, executing this benchmark returns the following
        host  b_all  b_cpu   b_io live load   mhz
        3of1 12.131  7.290  4.841    1  0.0  1992
        1of1 12.072  7.224  4.847    1  0.0  1992     b_all   cumulative benchmark
        4of1 12.058  7.210  4.849    1  2.1  1992     b_cpu   CPU benchmark
        2of2 12.068  7.216  4.852    1  0.0  1992     b_io    I/O benchmark
        1of3 12.092  7.231  4.862    1  0.0  1992     load    current 1 minute load
        3of0 12.075  7.208  4.866    1  0.0  1992     mhz     sum of CPU MHz
        1of0 12.096  7.220  4.876    1  0.0  1992
        0of2 12.177  7.299  4.878    1  0.0  1992
        ...
        5of0 12.209  7.225  4.983    1  2.0  1992
        8of2 18.294 10.726  7.568    1  3.0  1992
        4of7 16.205  5.548 10.656    1  2.0  2792
        5of7 16.376  5.561 10.815    1  2.0  2792
        7of7 16.510  5.557 10.953    1  2.0  2792
        7of8 16.555  5.550 11.005    1  2.0  2792
        4of3 17.402  6.119 11.283    1  2.0  2522
        1of7 16.826  5.532 11.294    1  0.0  2792
        ...
        3of4 20.898  6.190 14.707    1  0.9  2522
        6of3 21.392  6.120 15.272    1  2.0  2522
        1of5 21.745  6.130 15.616    1  0.0  2522
        1of4 28.541  6.199 22.342    1  1.0  2522
        6of4 37.233 11.786 25.447    1  4.1  2522
        5of4 37.200  7.717 29.483    1  3.0  2522
        4of4 38.136  8.368 29.768    1  3.0  2522
        2of4 36.603  6.229 30.374    1  1.0  2522
       TOTAL 1019.7 390.73 629.01   59 78.2 140938
The table was produced by clustersnapshot. The first column shows the cluster node host name. b_all is the total benchmark time, comprised of the time for the execution of a cpu benchmark (b_cpu) and the I/O benchmark (b_io). The live status, 1 minute load and MHz rating of the node are also shown. The results are sorted by the I/O benchmark. The host 3of1 appears to have the fastest I/O time, even though it is not the fastest node. Also nodes with small 1 minute loads are not necessarily highest ranked. Look at 1of5 - a dual 1.26GHz unloaded machine with a poor I/O benchmark. If I were a user looking for the fastest I/O node, I'd pick 3of1. If I were sorting by load and/or speed, I might have picked 1of5.
Let's check these systems individually with dd. First 3of1,
{3of1} >  time dd if=/dev/zero of=/tmp/test count=200000
200000+0 records in
200000+0 records out
0.20user 0.75system 0:00.94elapsed 100%CPU (0avgtext+0avgdata 0maxresident)
0inputs+0outputs (121major+19minor)pagefaults 0swaps
Looks like 3of1 wrote a 100MB file in 0.94 seconds (score above was 4.7 s for 5 files). Now, 1of5
{5of1} > time dd if=/dev/zero of=/tmp/test count=200000
200000+0 records in
200000+0 records out

real	0m2.273s
user	0m0.190s
sys	0m2.080s
This machines took 2.3 seconds to write the same sized file (score above was 15.2 for 5 files). Obviously one machine is more than twice as fast performing local I/O, a quantity that is not reflected in differences of other subsystems. Both machines are IBM x330 nodes with dual CPUs and 1 GB of RAM.
Visualization
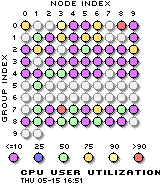
The current state of each node can be visualized as a table of current values

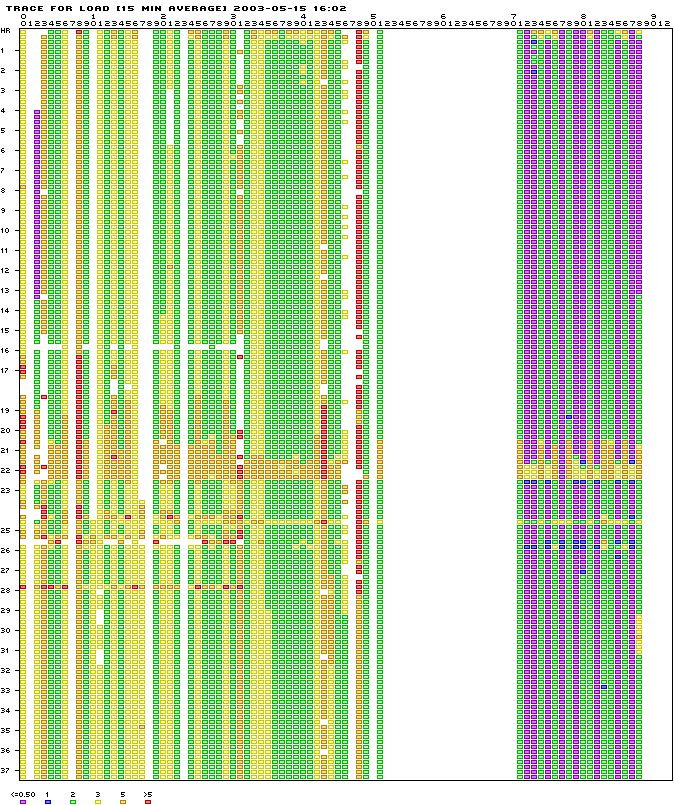
or a historical trace across the entire cluster.

Development
The system was developed at the Genome Sciences Centre and runs on our IBM x330 cluster.
